

The Power of 3-7-11 and the Grand Super Cycle: How We Saw the Bullish Turn in April 2025 Back on April 9, 2025, while World Indices were dropping sharply and global sentiment had turned overwhelmingly bearish, we published an article that challenged the fear-driven narrative. We explained why selling was not the right approach and […]
-
NZDCAD Medium Term Elliottwave Analysis 11.25.2015
Read MoreThis is a medium term Elliottwave Analysis video on $NZDCAD. Pair looks to be correcting the decline from 10/27 peak. So far two swings can be counted and another swing higher is ideal towards 0.88 area before the decline resumes. As far as 0.9015 pivot is holding, pair is expected to resume the weekly move […]
-
ABC (Zig-Zag) Elliott Wave Structure
Read MoreSee Eric Morera explain an ABC (Zig-Zag) Elliott Wave Structure in an interview with Dale Pinkert (@ForexStopHunter). He goes over the 5 key rules that we use at Elliottwave-Forecast.Com to define an ABC structure. Learn to spot what is and what is not an ABC structure with the help of this video.
-
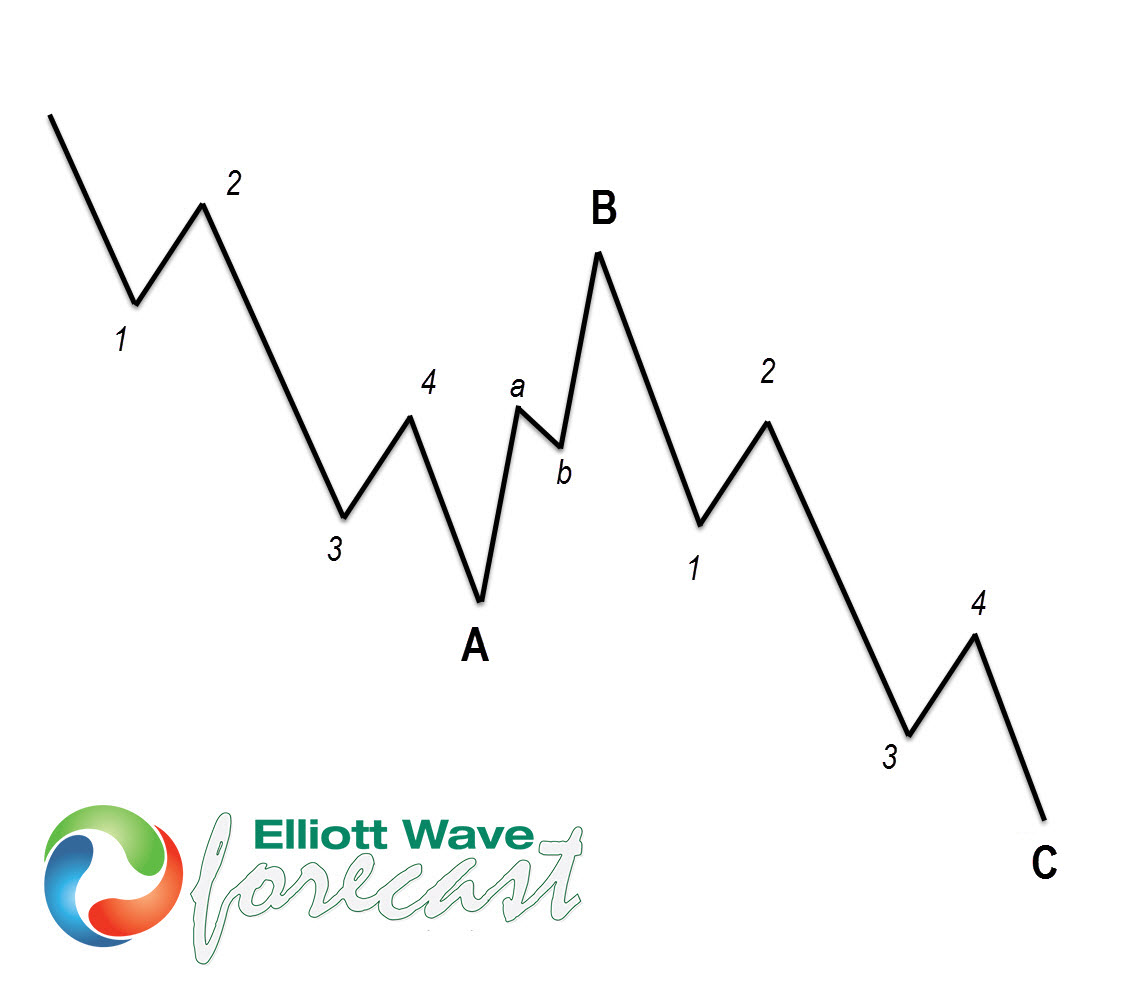
Interview with Eric Morera: ABC (Zig-Zag) Elliott Wave Structure
Read MoreSee Eric Morera explain an ABC (Zig-Zag) Elliott Wave Structure in an interview with Dale Pinkert (@ForexStopHunter). He goes over the 5 key rules that we use at Elliottwave-Forecast.Com to define an ABC structure. Learn to spot what is and what is not an ABC structure with the help of this video.
-
$AUD/CHF Medium Term Elliottwave Analysis 11.17.2015
Read MoreThis is a medium term Elliottwave Analysis video on $AUD/CHF. The pair has reached 100% from 8/6/2012 high (1.0348) and looks to be correcting this cycle. From 1/12/2015 low of 0.5654, we can count two swings, and another swing higher is likely towards 0.863 – 0.912 area in the next few months. Short term, a pullback is possible towards […]
-
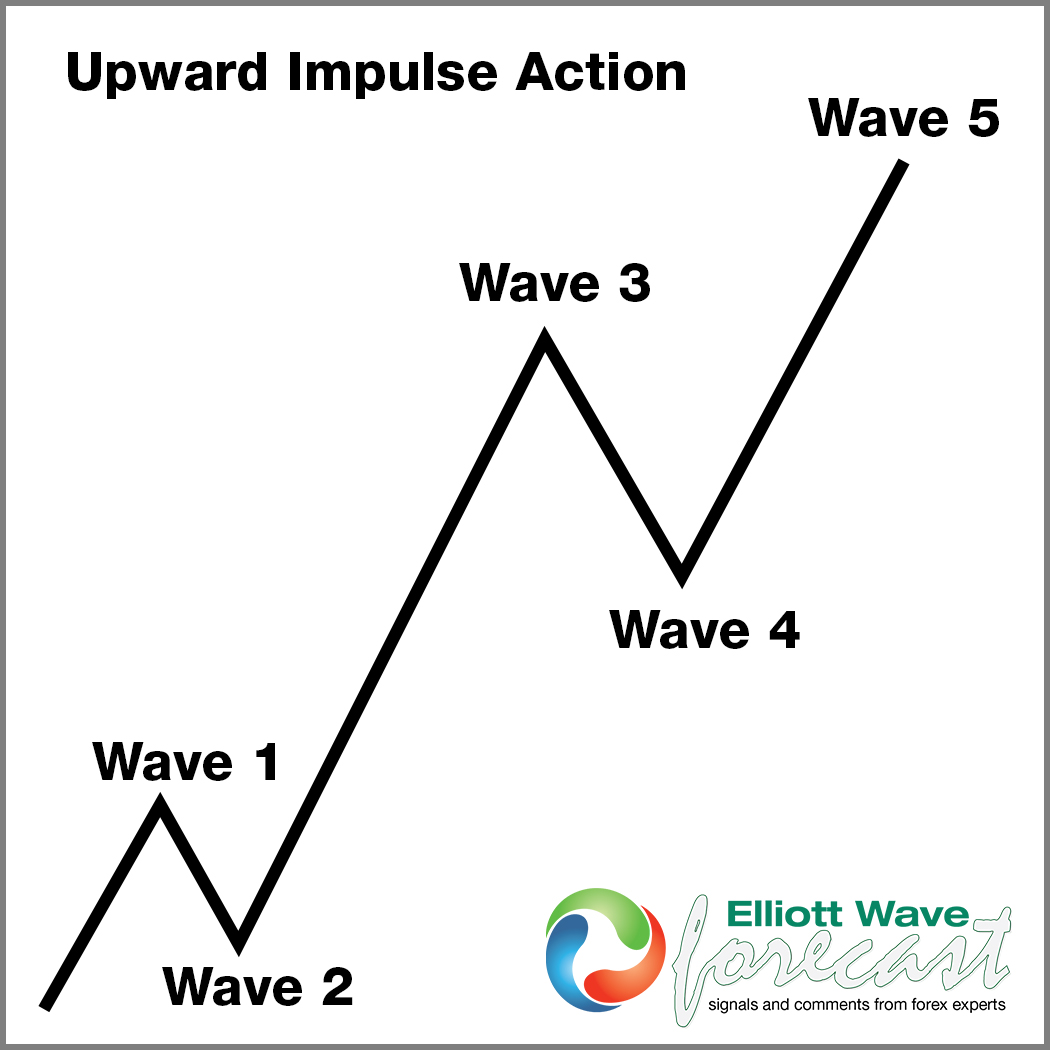
EWP The 5 waves Structure: Interview with Eric Morera
Read MoreIn this interview by Dale Pinkert at Nov 11, 2015 with our chief currency strategist and founder Eric Morera, we cover the rules and idea of 5 impulsive waves in Elliottwave Theory. Eric explained in this video that in today’s world, trend doesn’t only move in 5 waves, but trend also moves in 3 waves. It’s different […]
-
Shanghai Composite Index Medium Term EWF Analysis 11.02.2015
Read MoreThis is a medium term Elliottwave Analysis video on Shanghai Composite Index. Index is still expected to make another leg lower sometimes later towards 1944 – 2370 equality area before a larger bounce or a new bullish cycle can be seen. Short term, Index is in the process of completing wave (X) bounce. EWF currently covers 50 instrument […]