
The Power of 3-7-11 and the Grand Super Cycle: How We Saw the Bullish Turn in April 2025 Back on April 9, 2025, while World Indices were dropping sharply and global sentiment had turned overwhelmingly bearish, we published an article that challenged the fear-driven narrative. We explained why selling was not the right approach and […]
-

USDMXN (Mexican Peso): Might Be Showing The Path For US Dollar
Read MoreUSDMXN looks to have ended the cycle from all-time lows in an impulse sequence & started the pullback. This Article & Video look at Elliott wave path.
-

FTSE: Giving Warning About A Possible Acceleration Among Indices
Read MoreFTSE is providing a warning about a possible acceleration among indices with a possible nest. This article and video look at the Elliott Wave path.
-

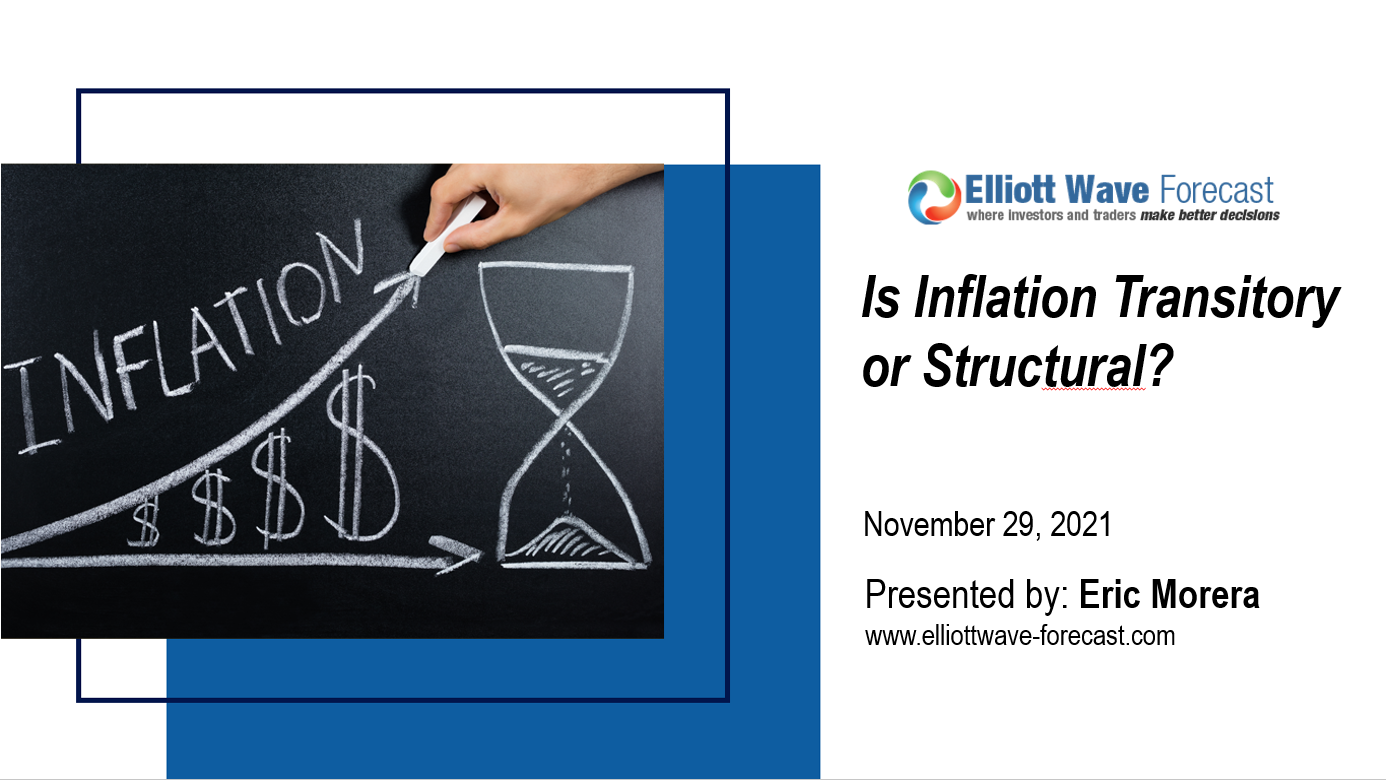
Is Inflation Transitory Or Structural Seminar Recording
Read MoreWe hosted the free Elliott wave webinar titled “Inflation Transitory Or Structural?” on November 29, 2021. In which, we provided a brief introduction about inflation, different type of inflations, etc. We particularly talked about US inflation & looked at the Elliott wave structures in various commodities such as OIL, Gold, Silver, GCC to arrive at the conclusion […]
-

GCC: Reacting From Blue Box Supporting Higher Commodities Prices
Read MoreGCC is WisdomTree Enhanced Commodity Strategy Fund, it an actively managed exchange-traded fund and intends to provide broad-based exposure to the following four commodity sectors: Energy, Agriculture, Industrial Metals, and Precious Metals primarily through investments in futures contracts. The Fund may also invest up to 5% of its net assets in bitcoin futures contracts. The […]
-

Crude Oil Price Action Might Be Showing A Temporary Pause in Gas Prices
Read MoreIn today’s video blog we will look at a very interesting topic around the market which is the price of Crude Oil and how it could affect the price of Gasoline. We will start by taking a look at the famous Impulse Wave pattern in Elliott wave which is shown below Elliott Wave Impulse Pattern […]
-

SIL (Silver Miners ETF) Sending A Warning To Silver Shorts
Read MoreSilver related symbols including Silver Funds and ETFs have been trading lower since the peak around either 08.06.2020 or 02.01.2021. Most of them have taken a different Elliott wave structure, some have been doing an Elliott wave FLAT like $XAGUSD and some are doing a simple ABC (5-3-5) structure like SIL. The group advanced in […]