Elliott Wave Forecast

Login
Start 14-Day Trial
  • Plans and Pricing
  • Education
    • 6 Educational Seminar Recordings
    • 4 Educational Seminar Recordings
    • EW Structures & Swing Sequence
    • Platinum Package
    • Trading Execution Seminar
    • New Elliott Wave, Correlation & Trading Execution
    • Premium Plus Package
    • Learn Elliott Wave
    • 1-1 Training
    • Premium Package
    • Trading Right Side using Elliott Wave Theory, Cycles and Sequences
    • Elliottwave, Market Dynamic and Correlations
  • Resources
    • Elliott Wave Theory
    • E-Books
      • Elliott Wave eBook
      • eBook – Comprehensive Guide to Trading Stocks & ETFs
      • eBook – Complete Beginners Guide to Forex Trading
      • eBook – Best Trading Strategies Using Elliott Wave Theory
    • Position Size Calculator
    • Risk/Reward Calculator
    • News
    • Newsletter
    • Crypto-Currencies
  • Free Articles
  • About Us
  • Performance

S&P 500 E-Mini (ES_F) Elliott Wave: Forecasting the Rally From Equal Legs Zone

February 20, 2025 By EWF Vlada

Hello traders ! In this technical article, we’re going to take a quick look at the Elliott Wave charts of the S&P 500 E-Mini (ES_F Futures) , published in the members area of the website.

As our members know, $ES_F recently pulled back and found buyers at the equal legs area. The main outlook remains bullish. Here’s our Elliott Wave Forecast and what to expect next.

ES_F Elliott Wave 1 Hour Chart 02.02.2025

$ES_F has made a clear five-wave decline from the peak—((a)) in black—followed by a three-wave bounce in ((b)), as expected. Since the decline unfolded in 5 waves, we assume ES_F completed only the first leg of a deeper Zig Zag pattern. As long as the price remains below the 6148.21 peak, $ES_F is likely now in the final ((c)) leg of the correction. We expect the decline toward the 5935–5884 area to complete wave 2 (red) before the larger trend resumes.

90% of traders fail because they don’t understand market patterns. Are you in the top 10%? Test yourself with this advanced Elliott Wave Test

ES_F Elliott Wave Chart 02.02.2025

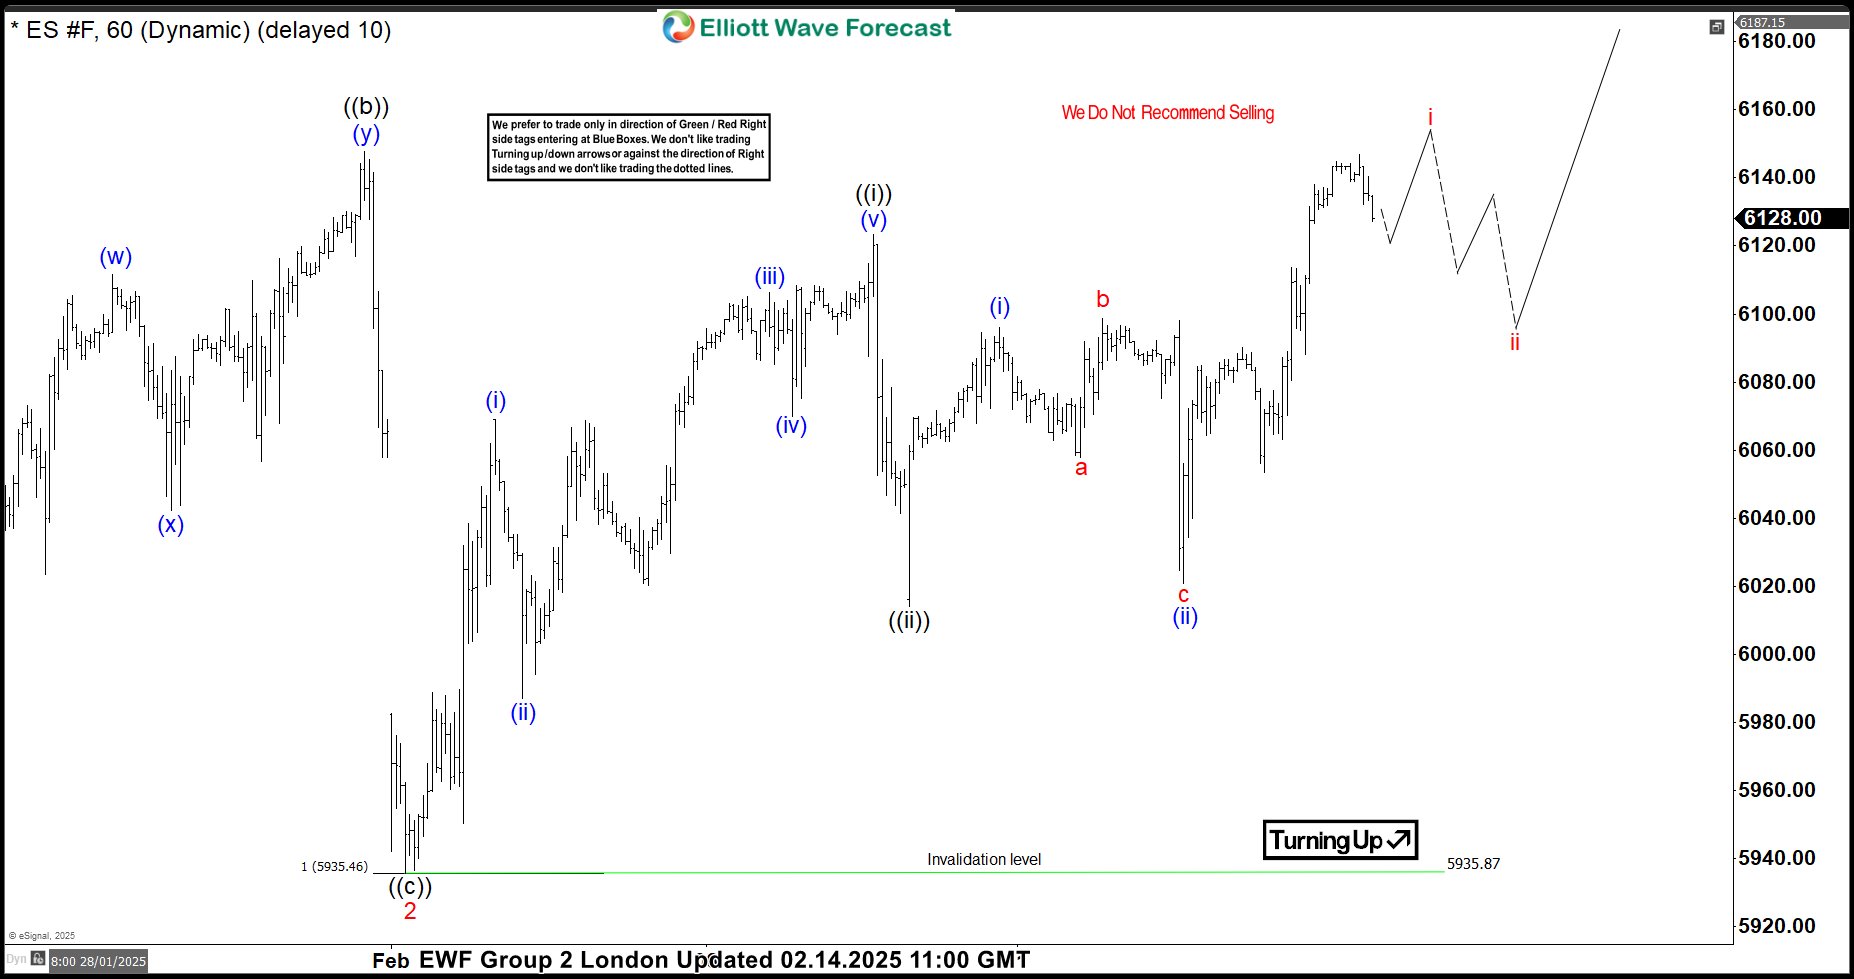
ES_F Elliott Wave 1 Hour Chart 02.14.2025

ES_F made another leg down, following a 5-wave structure toward the extreme zone. It found buyers and turned higher as expected. Now, we’d like to see a break above the January 24th peak, which will confirm further extension to the upside. The futures should ideally remain supported as long as the pivot at the 5935 low holds.

Reminder for members: Our chat rooms in the membership area are available 24 hours a day, providing expert insights on market trends and Elliott Wave analysis. Don’t hesitate to reach out with any questions about the market, Elliott Wave patterns, or technical analysis. We’re here to help.


ES_F Elliott Wave Chart 02.14.2025

Elliott Wave Forecast

Thank you for exploring our S&P 500 E-Mini (ES_F)  Forecast with us. While we analyze 78 instruments, it’s important to remember that not every chart represents a trading recommendation. For official trading signals, we invite you to join our Live Trading Room, where we provide actionable insights in real-time. If you’re not yet a member, take advantage of our 14-day trial to unlock new trading opportunities.

Over the years, we’ve developed a reliable trading strategy that clearly defines entry, stop loss, and take profit levels. By joining us, you’ll gain access to expert guidance and the chance to refine your trading skills

Join us today !

📈 Elevate your trading with Elliott Wave Forecast!

💻 Ask unlimited questions during trading hours (Monday to Friday). Our Chat Rooms are an excellent place to learn, with continuous support from our market experts!

🔍 Explore our expert insights and real-time analysis covering Forex, Indices, Commodities, Cryptocurrencies, Stocks, and ETFs across 78 instruments.

📊 Gain exclusive access to our Official Trading Recommendations in the Live Trading Room, where seasoned experts provide valuable insights and guidance on new trading opportunities.

💰 For just $9.99, unlock a wealth of knowledge and experience with our 14-day Trial. Experience firsthand our proven trading strategy, which accurately defines Entry, Stop Loss, and Take Profit levels, empowering you to make informed decisions with confidence.

👉 Ready to take the next step? Get your 14-day Trial in just a few clicks! Click here to start your Trial today!

Start your 14-day Elliott Wave Forecast trial

Filed Under: Elliottwave Tagged With: Elliott Wave, ES-F, Indices, S&P 500 E-Mini, SPX, stock market, trading

SPX Reacting Higher From Extreme Equal Legs Area

February 11, 2025 By Hassan Sheikh

In this technical blog, we will look at the past performance of the 1-hour Elliott Wave Charts of SPX. We presented to members at the elliottwave-forecast. In which, the rally from 13 January 2025 unfolded as an impulse structure. And showed a higher high sequence favored more upside extension to take place. Therefore, we advised members not to sell the index & buy the pullback in 3, 7, or 11 swings. Based on Elliott wave hedging area looking to get 3 wave reaction higher at least. We will explain the structure & forecast below:

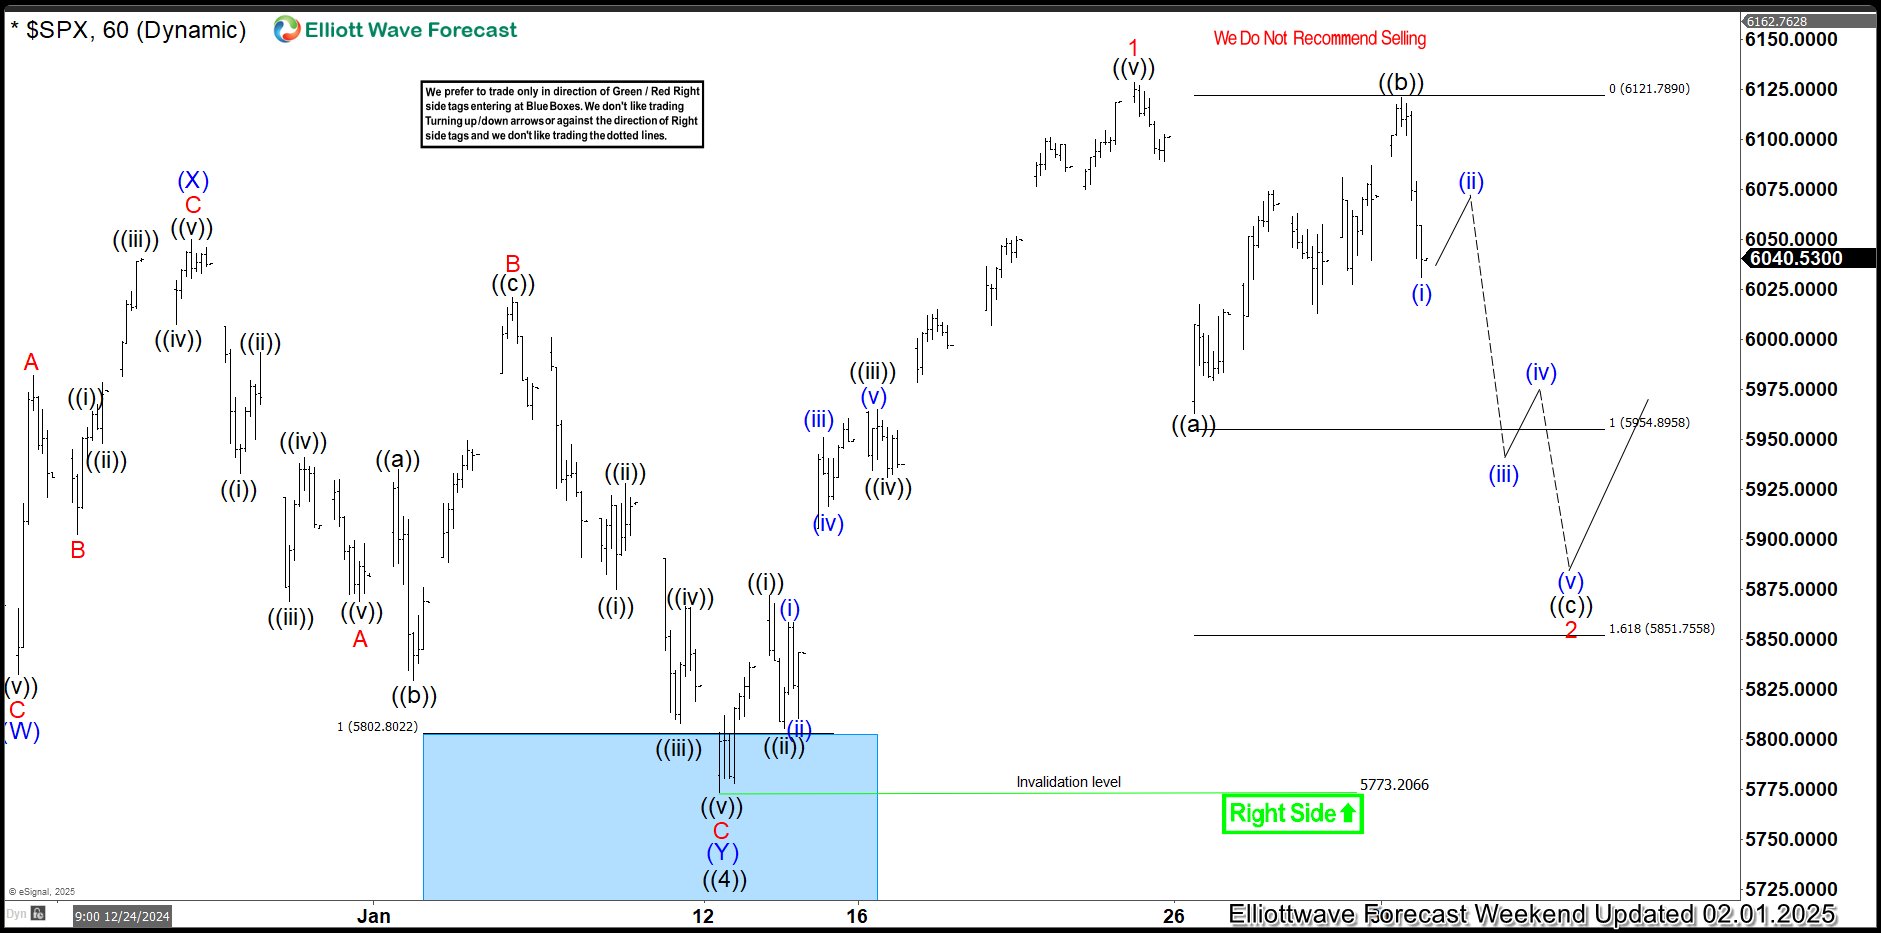
SPX 1-Hour Elliott Wave Chart From 2.01.2025

SPX Reacting Higher From Extreme Equal Legs Area

Here’s the 1-hour Elliott wave chart from the 2.01.2025 update. In which, the cycle from the 13 January low ended in wave 1 as an impulse structure at $6128.18 high. Down from there, the index made a pullback in wave 2 to correct that cycle. The internals of that pullback unfolded as Elliott wave zigzag structure where wave ((a)) ended at $5962.92 high. Then wave ((b)) bounce ended at $6120.91 high and wave ((c)) was expected to reach the Elliott wave hedging area at $5954.89- $5851.75 area. From there, buyers were expected to appear looking for next extension higher or do a 3 wave reaction higher at least.

SPX Latest 1-Hour Elliott Wave Chart From 2.11.2025

SPX Reacting Higher From Extreme Equal Legs Area

This is the latest 1-hour Elliott wave Chart from 2.11.2025 Asia update. In which the SPX is showing a strong reaction higher taking place, right after ending the zigzag correction within the equal legs area. Allowed members to create a risk-free position shortly after taking the long position. However, a break above $6128.18 high is needed to confirm the next extension higher & avoid double correction lower.

If you are looking for real-time analysis in SPX along with the other indices then join us with a 14-Day Trial for the latest updates & price action.

Success in trading requires proper risk and money management as well as an understanding of Elliott Wave theory, cycle analysis, and correlation. We have developed a very good trading strategy that defines the entry.

Stop loss and take profit levels with high accuracy and allow you to take a risk-free position, shortly after taking it by protecting your wallet. If you want to learn all about it and become a professional trader. Then join our service by taking a Trial.

Filed Under: Stock Market Tagged With: Elliott Wave, Elliott Wave Analysis, Elliottwave, ES_F, Indices, S&P500, Snp500, SPX, SPY, trading, trading setup, trading setups, trading signals

S&P 500 E-Mini (ES_F) Elliott Wave:Forecasting the Future Path

February 10, 2025 By EWF Vlada

Hello traders ! In this technical article, we’re going to take a quick look at the Elliott Wave charts of the S&P 500 E-Mini (ES_F Futures) , published in the members area of the website.

As our members know, $ES_F recently provided a solid trading setup. The main outlook remains bullish, with the market currently correcting the cycle from the August 5812.28 low.

In this article, we’ll explain our forecast and the best way to approach trading $ES_F.

ES_F 1-Hour Chart Analysis: January 27, 2025 Wave Pattern

Futures show an impulsive decline from the peak. Consequently, we assume that the price is nearing the completion of the first leg of a deeper wave 2 (red) pullback, unfolding as a Zig-Zag pattern. We expect to see a three-wave bounce in ((b)), followed by another leg down in wave 2 (red). The final target for wave 2 (red) will depend on how far wave ((b)) extends to the upside.

S&P 500 E-Mini 1-Hour Elliott Wave Chart January 27, 2025 showing wave patterns

S&P 500 E-Mini (ES_F) 1-Hour Elliott Wave Chart showing wave 2 correction pattern


ES_F 1-Hour Chart Update: February 2, 2025 Market Correction

$ES_F has completed a clear five-wave decline from the peak—((a)) in black—followed by a three-wave bounce in ((b)), as anticipated. The market is now likely in the final ((c)) leg of the correction.As long as the price remains below the 6148.21 peak, $ES_F  can see a drop toward the 5934.5–5884 area to complete wave 2 (red) before resuming the larger trend.

If you’re not already long and risk-free from the previous blue box area, the best approach to trading $ES_F would be to wait for a break above the 1 red peak. Once that happens, we can look for an intraday pullback to buy the dips in the 3, 7, and 11 swings. You will also receive further support in the Live Trading Room and 24h Chat Room.

24/7 Expert Market Analysis in Our Trading Community

Reminder for members: Our chat rooms in the membership area are available 24 hours a day, providing expert insights on market trends and Elliott Wave analysis. Don’t hesitate to reach out with any questions about the market, Elliott Wave patterns, or technical analysis. We’re here to help.

You can find detailed information on trading setups in the membership area and in the Live Trading Room

90% of traders fail because they don’t understand market patterns. Are you in the top 10%? Test yourself with this advanced Elliott Wave Test

S&P 500 E-Mini 1-Hour Elliott Wave Chart February 2, 2025 showing correction pattern

Updated ES_F Elliott Wave Chart showing completion of wave ((a)) and ((b)) with potential ((c)) wave target


Master Elliott Wave Trading With Our Proven Strategy

Thank you for exploring our S&P 500 E-Mini (ES_F) Forecast with us. While we analyze 78 instruments, it’s important to remember that not every chart represents a trading recommendation. For official trading signals, we invite you to join our Live Trading Room, where we provide actionable insights in real-time. If you’re not yet a member, take advantage of our 14-day trial to unlock new trading opportunities.

Over the years, we’ve developed a reliable trading strategy that clearly defines entry, stop loss, and take profit levels. By joining us, you’ll gain access to expert guidance and the chance to refine your trading skills.

Start Your Trading Success Journey Today

📈 Elevate your trading with Elliott Wave Forecast!

💻 Ask unlimited questions during trading hours (Monday to Friday). Our Chat Rooms are an excellent place to learn, with continuous support from our market experts!

🔍 Explore our expert insights and real-time analysis covering Forex, Indices, Commodities, Cryptocurrencies, Stocks, and ETFs across 78 instruments.

📊 Gain exclusive access to our Official Trading Recommendations in the Live Trading Room, where seasoned experts provide valuable insights and guidance on new trading opportunities.

💰 For just $9.99, unlock a wealth of knowledge and experience with our 14-day Trial. Experience firsthand our proven trading strategy, which accurately defines Entry, Stop Loss, and Take Profit levels, empowering you to make informed decisions with confidence.

👉 Ready to take the next step? Get your 14-day Trial in just a few clicks! Click here to start your Trial today!

Filed Under: Elliottwave Tagged With: Elliott Wave, Elliottwave, ES_F, ES-F, S&P 500 E-Mini, S&P500, SPX, trading, trading setup

Uncertain Recovery: Projections Indicate Continued Decline in Ford’s Stock Price

February 2, 2025 By EWFLuis

Ford Motor Company (F) is an American multinational automobile manufacturer headquartered in Dearborn, Michigan, United States. It was founded by Henry Ford and incorporated on June 16, 1903. The company sells automobiles and commercial vehicles under the Ford brand, and luxury cars under its Lincoln luxury brand.

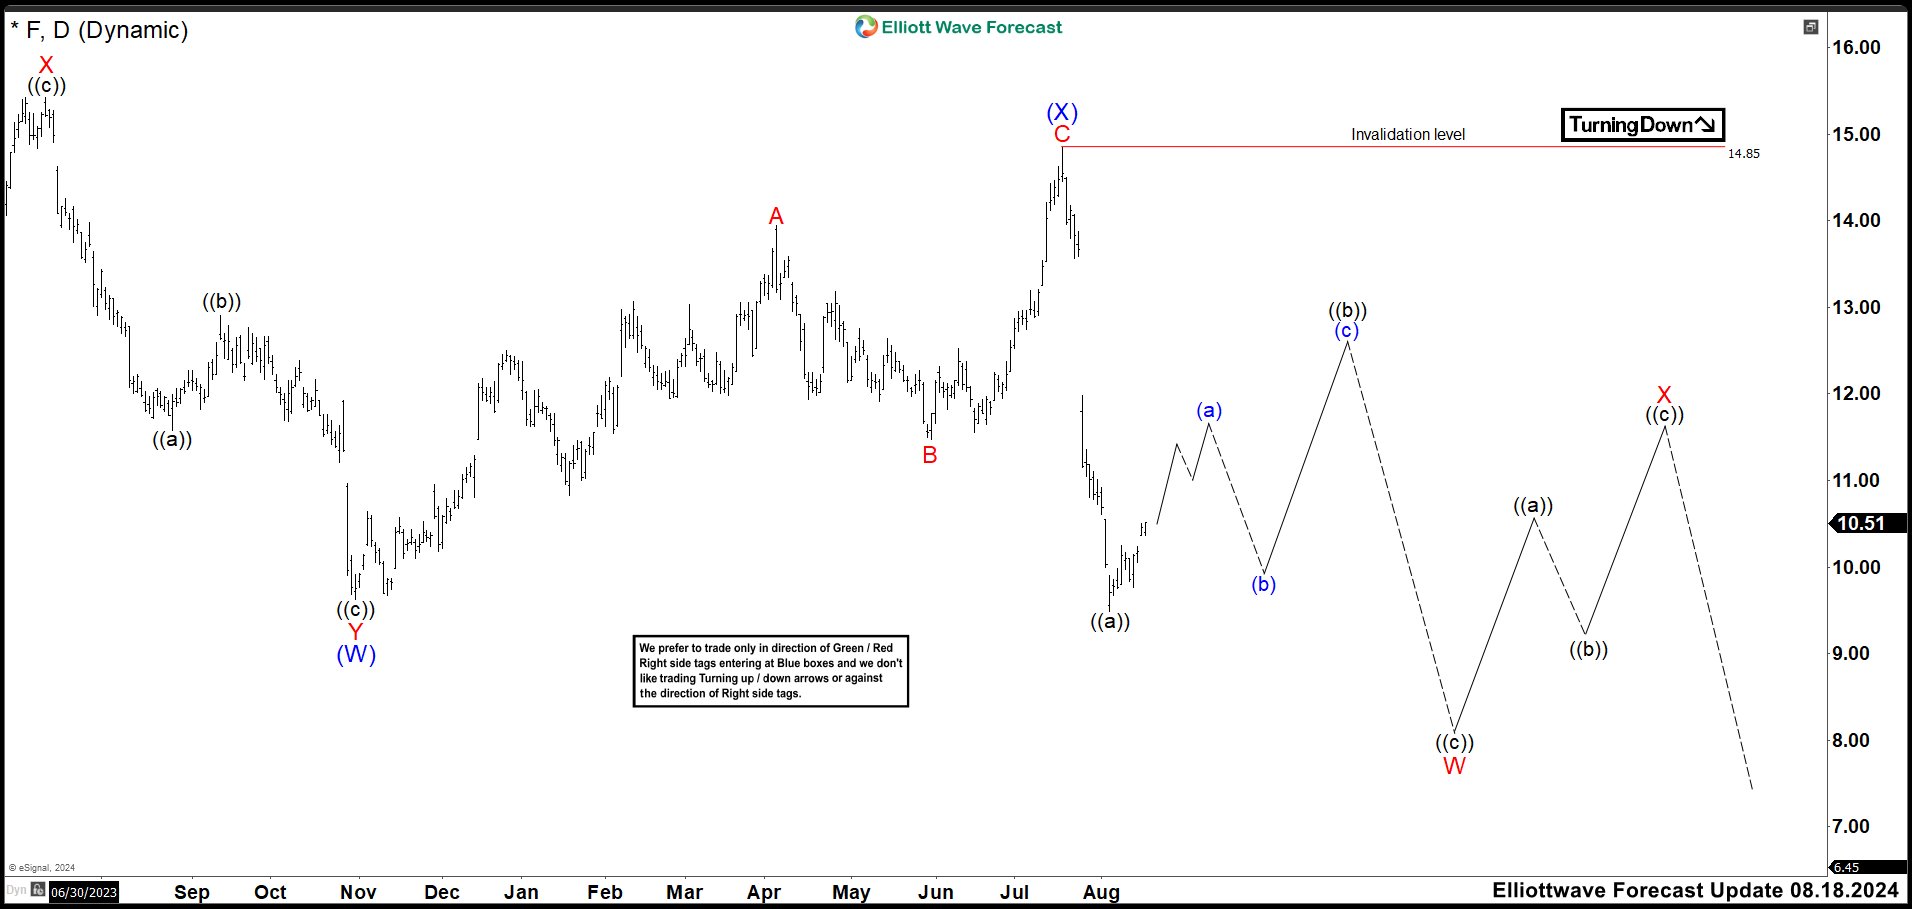
FORD (F) Daily Chart August 2024

FORD (F) Daily Chart August 2024

We have been calling Ford bearish since it ended a wave ((X)) at 16.68 high. Since then, the market continued lower and we are expecting a double correction (W), (X), (Y) to complete wave ((Y)). Down from August 2022 high, we can see 7 swings lower developing a double correction structure ending wave (W) at 9.63 low. A new rally started from wave (W) low to build a structure of 3 swings as wave (X) ending at 14.85 high. (If you want to learn more about Elliott Wave Theory, follow these links: Elliott Wave Education and Elliott Wave Theory).

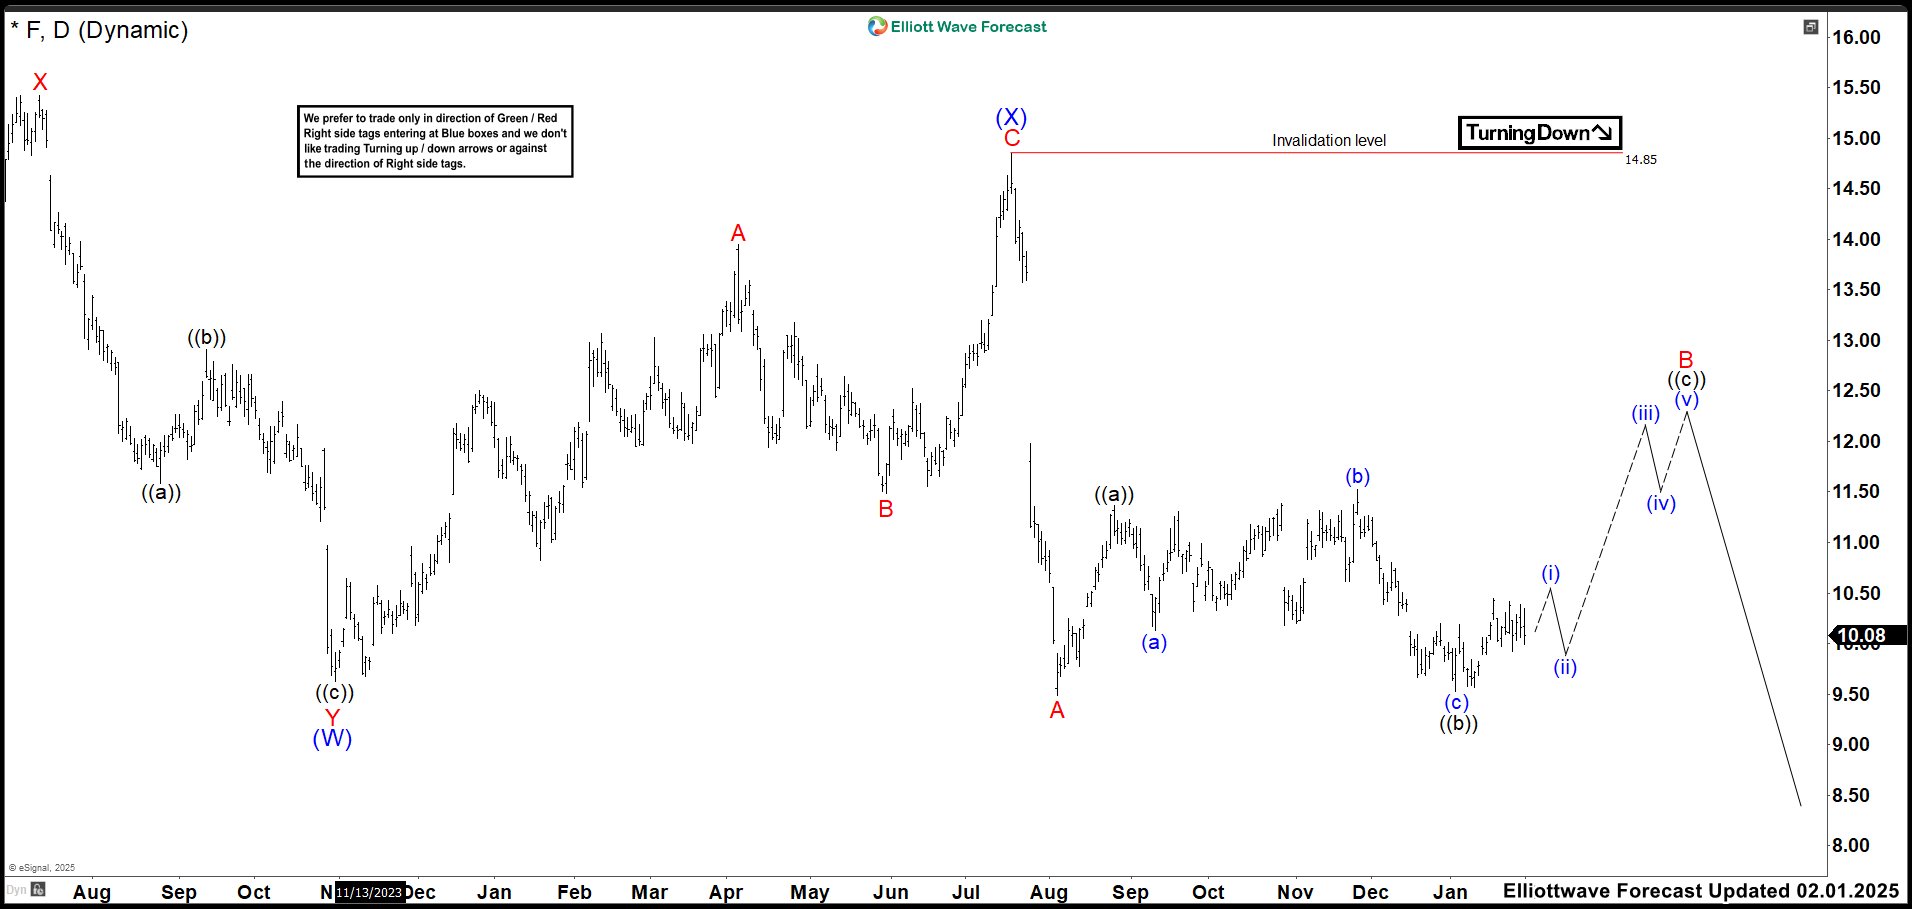
FORD (F) Daily Chart February 2025 

FORD (F) Daily Chart February 2025 

After a few days, F opened with a big gap that would eventually break the low of wave (W). This suggested that we should at least see 3 more waves down to finish the bearish cycle. In the last few months, the market has been moving sideways, so we have adjusted the count based on the new structure. Therefore, we have labeled the strong drop from wave (X) as A ending at 9.49 low. The structure formed from here could be a flat correction (3-3-5). For that, we need to see a rally to 11.86 – 12.58 area to complete wave B and then resuming lower in wave C of (Y). We still expect more downside in the stock and it could drop to 7.79 – 3.43 area. We do NOT recommend to buy near term in this possible wave ((c)) of B. The trend is bearish against 14.85 high. Trade smart!

Elliott Wave Forecast  

www.elliottwave-forecast.com updates one-hour charts 4 times a day and 4-hour charts once a day for all our 78 instruments. We do a daily live session where we guide our clients on the right side of the market. In addition, we have a chat room where our moderators will help you with any questions you have about what is happening in the market. Trial Us!

14 days trial cost $9.99 only. Cancel anytime at support@elliottwave-forecast.com

Filed Under: Stock Market Tagged With: Dow Jones, FORD, SPX

S&P 500 E-Mini (ES_F) Elliott Wave: Buying the Dips at Blue Box

January 30, 2025 By EWF Vlada

Hello fellow traders,

As our members know we have had many profitable trading setups in Indies recently.   In this technical article, we are going to present another Elliott Wave trading setup we got in SPX E-Mini ( ES_F ) . ES_F completed this correction precisely at the Equal Legs zone, referred to as the Blue Box Area. In the following sections, we will delve into the specifics of the Elliott Wave pattern observed and discuss the corresponding trading setup in detail.

ES_F Elliott Wave 1 Hour Chart 01.09.2025

The current view indicates that ES_F is forming a wave ((4)) black correction. The price action shows an incomplete 5-wave decline from the peak, suggesting that only the first leg of the proposed correction has completed. This correction is likely unfolding as an Elliott Wave Zig-Zag pattern. We anticipate an extension toward the extreme zone at 5808–5623 area, where we are looking to re-enter as buyers.

We recommend members to avoid selling ES_F . As the main trend remains bullish, we anticipate at least a 3-wave bounce from this Blue Box area. Once the price touches the 50 fibs against the ((b)) black connector, we’ll make positions risk-free and set the stop loss at breakeven and book partial profits. On other hand, breaking below the 1.618 Fibonacci extension level at 5338.5 would invalidate the trade.

Official trading strategy on How to trade 3, 7, or 11 swing and equal leg is explained in details in Educational Video, available for members viewing inside the membership area.

Quick reminder on how to trade our charts :

Red bearish stamp+ blue box = Selling Setup
Green bullish stamp+ blue box = Buying Setup
Charts with Black stamps are not tradable. 🚫

ES_F

ES_F Elliott Wave 1 Hour Chart 01.19.2025

The futures has made extension down toward Blue Box and found buyers as expected. ES_F is showing a decent bounce from the Buying Zone. Consequently, any long positions from the Blue Box should now be risk-free. We’ve set our stop loss at breakeven and have already secured partial profits. Now, we would like to see a break of the ((3)) black peak to confirm that the next leg up is in progress.

90% of traders fail because they don’t understand market patterns. Are you in the top 10%? Test yourself with this advanced Elliott Wave Test

Reminder for members: Our chat rooms in the membership area are available 24 hours a day, providing expert insights on market trends and Elliott Wave analysis. Don’t hesitate to reach out with any questions about the market, Elliott Wave patterns, or technical analysis. We’re here to help.

Elliott Wave Forecast

Thank you for exploring our S&P 500 E-MINI (ES_F) Forecast with us. While we analyze 78 instruments, it’s important to remember that not every chart represents a trading recommendation. For official trading signals, we invite you to join our Live Trading Room, where we provide actionable insights in real-time. If you’re not yet a member, take advantage of our 14-day trial to unlock new trading opportunities.

Over the years, we’ve developed a reliable trading strategy that clearly defines entry, stop loss, and take profit levels. By joining us, you’ll gain access to expert guidance and the chance to refine your trading skills

Join us today!

📈 Elevate your trading with Elliott Wave Forecast!

💻 Ask unlimited questions during trading hours (Monday to Friday). Our Chat Rooms are an excellent place to learn, with continuous support from our market experts!

🔍 Explore our expert insights and real-time analysis covering Forex, Indices, Commodities, Cryptocurrencies, Stocks, and ETFs across 78 instruments.

📊 Gain exclusive access to our Official Trading Recommendations in the Live Trading Room, where seasoned experts provide valuable insights and guidance on new trading opportunities.

💰 For just $9.99, unlock a wealth of knowledge and experience with our 14-day Trial. Experience firsthand our proven trading strategy, which accurately defines Entry, Stop Loss, and Take Profit levels, empowering you to make informed decisions with confidence.

👉 Ready to take the next step? Get your 14-day Trial in just a few clicks! Click here to start your Trial today!

Filed Under: Trading Tagged With: E-mini, ES_F, Futures, Indices, SPX, trading

SPX Pullback Expected To Hold in 3, 7 Or 11 Swings

January 28, 2025 By Hassan Sheikh

Short Term Elliott Wave view in S&P 500 ( SPX) suggests that rally to new all time high on 12.16.2024 at $6099.97 ended wave ((3)).

Wave Structure Breakdown

Wave ((4)) Correction (Completed)

Pullback in wave ((4)) is proposed complete at $5773.20 as the 1 hour chart below shows. Internal subdivision of wave ((4)) unfolded as Elliott wave double three structure. Down from wave ((3)), wave (W) ended in lesser degree 3 swings at $5832.30. Wave (X) bounce ended in 3 swings at $6049.75 high. Then wave (Y) lower ended at $5773.20 low with another lesser degree 3 swings thus completed wave ((4)) pullback.

Key Trading Levels & Strategy

The Index has turned higher in wave ((5)) and managed to make a new high above previous wave ((3)) high of $6099.97 confirming the next extension higher. Up from wave ((4)), the rally took place as an impulse sequence where wave ((i)) ended at $5871.92 high. Wave ((ii)) pullback ended at $5805.42 low. Index nested higher in wave ((iii)) & ended at $5964.69 high. Then wave ((iv)) pullback ended at $5930.72 low. Above from there, wave ((v)) ended with extension at $6128.18 high & completed wave 1. Down from there, the index is doing a pullback in wave 2 against 1.13.2025 low. Therefore, pullback should hold in 3, 7 or 11 swings looking for more upside.

SPX 1-Hour Elliott Wave Chart (01.28.2025)

SPX 1-Hour Chart: Wave ((4)) Double Three Correction and Emerging Wave ((5))
Chart Note: Wave ((4)) completed as a double three, with wave ((5)) now testing new highs.


Video Update: SPX Elliott Wave Outlook

Filed Under: News, Stock Market Tagged With: Elliott Wave, Elliott Wave Analysis, Elliottwave, ES_F, Indices, S&P500, Snp500, SPX, trading, trading setup, trading setups

  • « Previous Page
  • 1
  • 2
  • 3
  • 4
  • …
  • 7
  • Next Page »
Elliott Wave Forecast
Categories
  • Video Blog
  • Trading
  • Stock Market
  • News
  • Forex
  • Elliottwave
  • Cryptos
  • Commodities
  • Bond
  • Blue Box Wins
  • Aidans Corner
Latest Post
  • Silver (XAGUSD) Ended Its Zig Zag Correction – Ready for the Next Leg Up?
  • Elliott Wave Analysis: Spot Silver (XAGUSD) Targeting Fresh All-Time Highs
  • Dow Futures (YM) Breaks Record : Five Waves Elliott Wave Impulse in Sight
  • Bitcoin BTCUSD Elliott Wave Analysis : Forecasting the Decline After 3-Wave Recovery
  • USDJPY Elliott Wave View: Extends Rally After Buyers Zone Reaction
Leading Elliott Wave technical analysis firm covering all major asset groups.

Forex

  • EUR/USD Forecast
  • GBP/USD Forecast
  • EUR/GBP Forecast
  • AUD/USD Forecast
  • GBP/JPY Forecast
  • EUR/JPY Forecast
  • USD/CHF Forecast

Stock Market

  • NASDAQ Forecast
  • DOW JONES Forecast
  • FTSE INDEX Forecast
  • DAX INDEX Forecast
  • NIFTY 50 Forecast
  • IBEX INDEX Forecast
  • S&P500 (SPX) Forecast

Commodities

  • Silver Forecast
  • Gold Forecast
  • Palladium Forecast
  • Copper Forecast
  • OIL Forecast
  • Natural Gas Forecast

Resources

  • Crypto-Currencies
  • Elliott Wave Videos
  • FAQs
  • Forex Signals
  • Commodity Signals
  • Elliott Wave Theory
  • Free Articles
  • Position Size Calculator
  • News

Education

  • Free eBook
  • Educational Products
  • About Us
  • Best Trading Strategies

Subscriptions

  • Silver Plan
  • Gold Plan
  • Platinum Plan
  • Diamond Plan

Quick Links

  • Contact Us
  • Terms & Conditions
  • Privacy Policy
  • Disclaimer
  • FAQs
  • Jobs Opportunities
  • Testimonials
  • Cancellation / Refund Policy
  • Consent Preferences

Get in Touch

Contact Us

EME Processing & Consulting LLC. 7090 NW 173 Dr. Miami FL, 33015, USA

support@elliottwave-forecast.com

Copyright © 2025 All Rights Reserved

safe icon
Disclaimer: Futures, options, stocks, ETFs and over the counter foreign exchange products may involve substantial risk and may not be suitable for all investors. Leverage can work against you as well as for you. You should therefore carefully consider your investment experience as well as financial condition before deciding if trading is suitable for you.