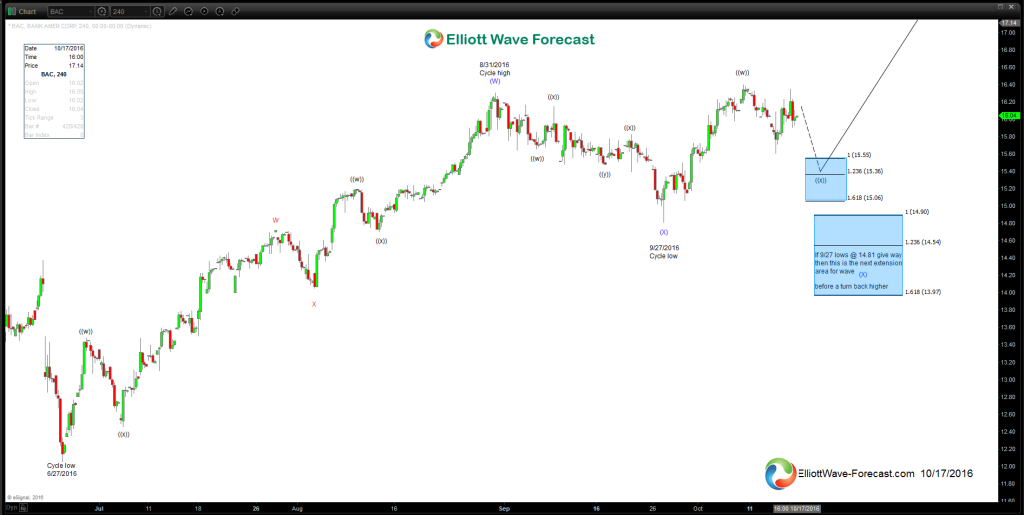
Bank of America Corporation $BAC of course is one of the larger market cap stocks in the financial banking sector listed on the NYSE . Most are aware the stock peaked in November 2006 and was sold off heavily during the financial crisis decline then the stock found a low in February of 2009. From that point in the longer term chart I’m not going to get into what the Elliott Wave count is or is not as there is a couple of likely probabilities however what I want to mention that is important from that 2009 low is an obvious bounce higher and then a dip in 2011 that held above the 2009 lows. This has been a weak longer term rally relative to some of the banking sector stocks however it does project an equal legs-1.236 extension target area higher at 22.25 to 26.35 while that December 2011 low remains intact. From there the rally stalled from getting back above the April 2010 highs however appears the dip that ended in February 2016 corrected that cycle up and the trend higher has resumed with a rally into April then a dip into what is shown in the 4 hour chart at the 6/27/2016 lows.
This chart shown below illustrates the two most likely nearer term buying areas presuming the stock sees a dip lower. In the first and most bullish scenario, while below the 10/17 highs at 16.35 a corrective dip from the 10/10 highs at 16.40 shows the equal legs-1.236 extension area at 15.55-15.36 with a possible 1.618 extension at 15.06. The dip should show it will remain above the 9/27 lows. Usually if an instrument gets into an extension area such as this it will show in the trend system we use here whether or not the price will either bounce from that area and fail to rally into new highs for another deeper corrective extension or proceed on toward new highs. This the reason I put the other lower extension area at the 14.90-13.97 region. If the stock shows it is going to break below the 9/27 lows or does then this is the projected area for a three swing corrective cycle lower from the 8/31 cycle highs. From that area it should remain bullish for the turn higher while the dip shows it is going to remain above the 6/27/2016 cycle lows.
Thanks for looking and coming to the website and if you like take a free trial subscription of our service and see if we can be of help in your trading. We cover 52 global instruments in 4 time frames from weekly, daily , 4 hour on down to the 1 hour time frame in stock indices futures, commodities futures, forex and bond yields. Kind regards & good luck trading. Lewis Jones of the elliottwave-forecast.com Team
Back

