TMUS may have started a new bullish cycle after ending the bearish cycle from 03.03.2025. Meanwhile, the corrective pullback ended with a 7-swing structure within a blue box. In the coming weeks, this resurgence could advance to a new bullish cycle.
T-Mobile US (NASDAQ: TMUS) is a leading U.S. wireless carrier, known for its aggressive pricing and nationwide 5G network. Headquartered in Bellevue, Washington, it is majority-owned by Deutsche Telekom. Since merging with Sprint in 2020, T-Mobile has become the third-largest U.S. telecom provider. It is listed on the NASDAQ-100 and S&P 500 indices.
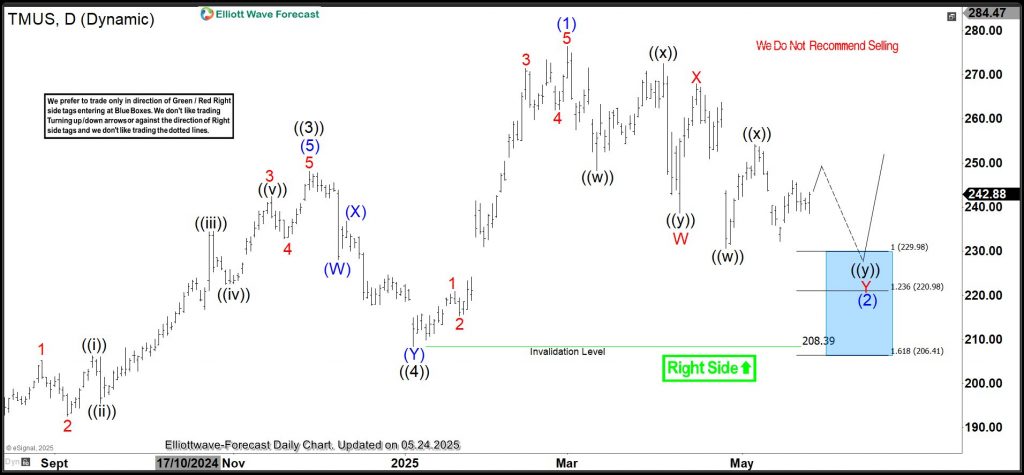
After completing wave IV in January 2022 on the weekly chart, TMUS started a bullish cycle. In the last update on this stock, I explained this bullish cycle on the weekly chart. You might want to read it here. Wave V stated from that low and completed sub-waves ((1)), ((2)), ((3)), ((4)). Meanwhile, wave ((5)) started in January 2025 where wave ((4)) ended. From the low of January 2025, the stock completed wave (1) of ((5)) in March 2025 and then started a corrective pullback for wave (2). It’s important to note that there is a clear incomplete bullish sequence from the January 2022 low. Thus, the pullback, if it completes a 3/7/11 swing setup, should end at the extreme zone where buyers should enter new trade. In the last update, I used the chart below to track the pullback. In addition, I shared the blue box where buyers should buy from lower prices.
TMUS Elliott Wave Analysis – 05.24.2025 Update
In the last update I shared the TMUS daily chart above. The chart identified a 7-swing structure for the wave (2) pullback. In addition, I shared the 229.98-206.41 as the blue box zone where buyers should go long on this stock.
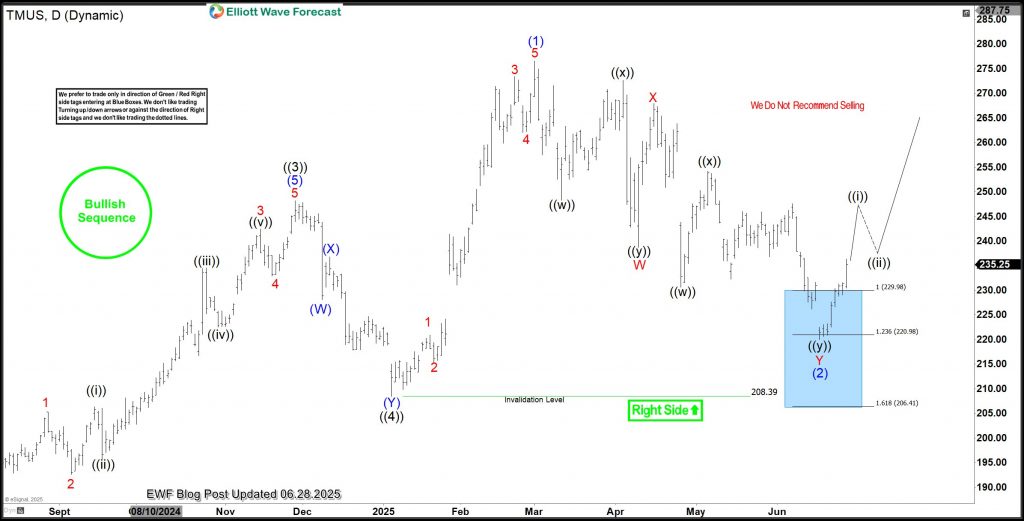
TMUS Elliott Wave Analysis (Latest) – 06.28.2025 Update
Just over a month after, the stock dropped as expected to the blue box and bounced. The chart above shows the updated daily. The bounce from the blue box is swift and should make at least a 3-swing (5-3-5) bounce although 5-wave bullish cycle for wave (3) toward 304-331 is more ideal. In trading numbers, traders who bought at the blue box could take partial profit at 238.5 and adjust the rest to either the low of wave (2) or to 229.98 (breakeven).
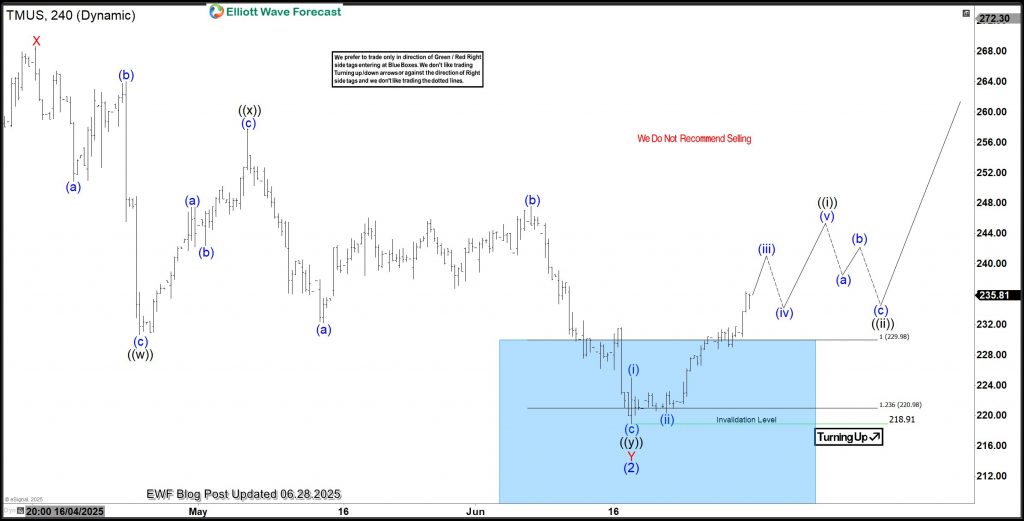
TMUS H4 Chart Analysis: What Next?
The H4 chart above shows the wave count of this resurgence. It shows a potential 5-wave separation from the blue box to finish wave ((i)) of 1 of (3) of ((5)). After that, it should push higher again from a 3/7/11 swing pullback to complete a 3-swing bounce. From there, we will see where it goes.
You can also join the Blue Box traders at ElliottWave-Forecast for just $0.99.
About Elliott Wave Forecast
At www.elliottwave-forecast.com, we update one-hour charts four times daily and four-hour charts once daily for all 78 instruments. We also conduct daily live sessions to guide clients on the right side of the market. Additionally, we have a chat room where moderators answer market-related questions. Experience our service with a 14-day trial for only $0.99. Cancel anytime by contacting us at support@elliottwave-forecast.com.
Back


