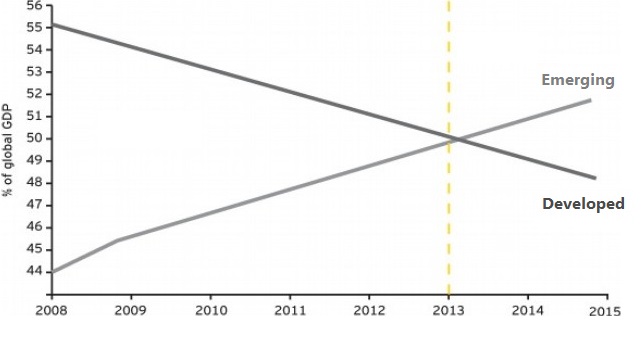
Since 2000 emerging markets and developing economies has grown rapidly becoming the driver of global growth , this progress is clearly confirmed in 2013 when emerging markets became the larger contributor in the global GDP and shifting the wheel of the world economy.
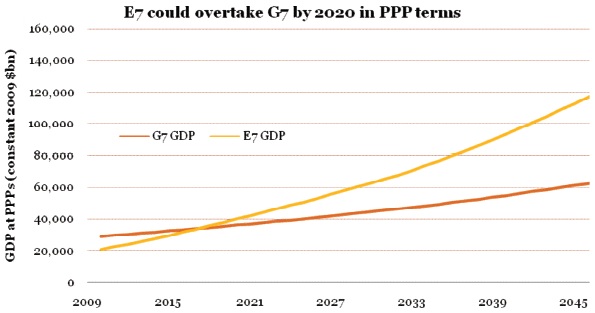
A study based on projected GDP at purchasing power parities (PPP) for the G7 economies ( United States, Canada, France, Germany, Italy, Japan, and the United Kingdom ) relative to the emerging E7 economies (China, India, Brazil, Russia, Mexico, Indonesia and Turkey) shows that by 2020 , E7 GDP will exceed G7 causing a new shift and reshape of the global economy.
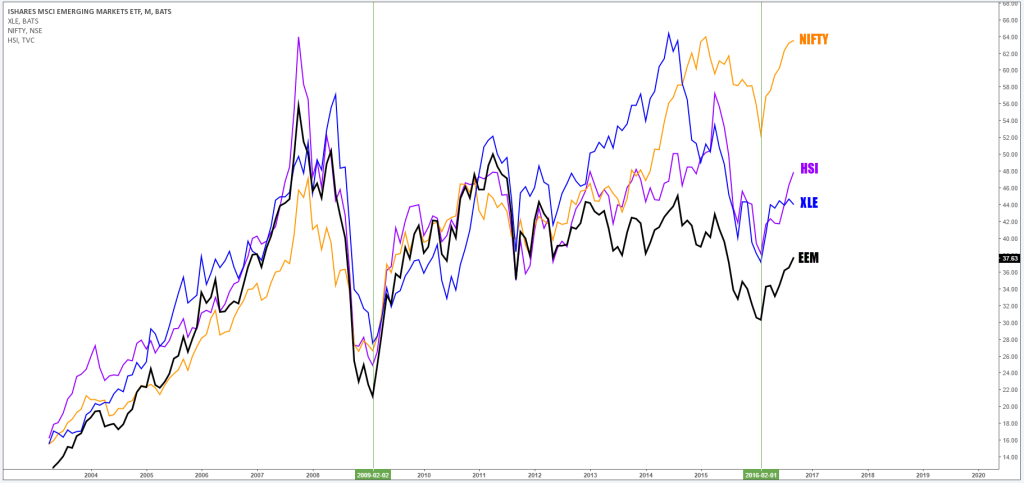
Taking a look at a combined chart of EEM ( Emerging Markets Index ETF ) , XLE ( Energy Select SPDR ) , NIFTY ( National Stock Exchange of India ) and HSI ( Hong Kong stock market Index ) we can clearly see these instruments are heavily connected technically by its oscillating cycles and fundamentally by economic & politic interests . Since the 2008-2009 lows , markets has traded higher with some instruments breaking the all time highs and even with the recent years decline it’s still well supported trading above the 2008 financial crisis low. World indices and commodities bottomed early this year , then followed by a low in energy sector which was an important factor of many that supported the world economy ongoing recovery and especially the growth of emerging market.
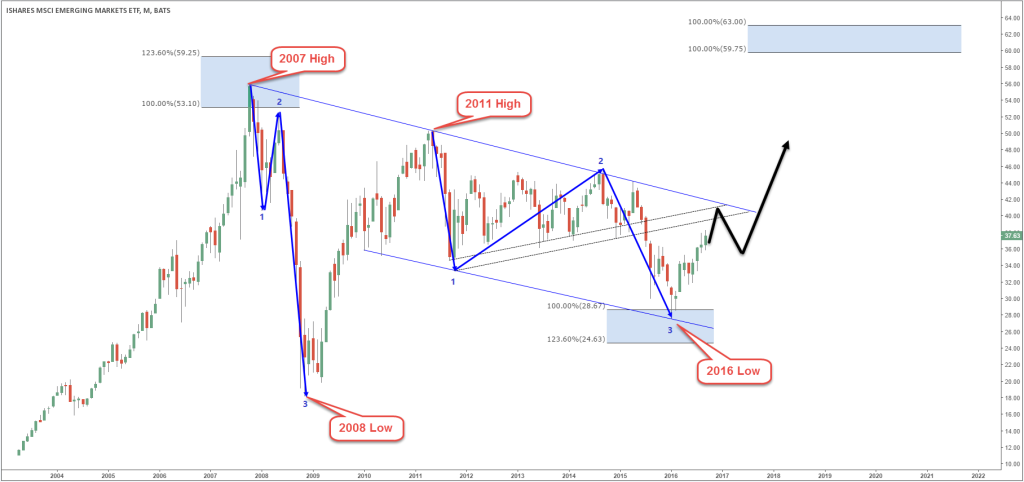
Implemented the simple rules of Elliott wave at the monthly chart of EEM ( iShares MSCI Emerging Markets Index ETF ) , the price is bouncing from 2016 low after dropping in 3 big corrective waves from the 2011 highs supporting the idea that a second major low could be in place and the index is already correcting a 5 years cycle which can result in a break of the bearish channel that’s it been trading in for the recent years as a first steps before retesting or breaking the 2011 high as a second step .
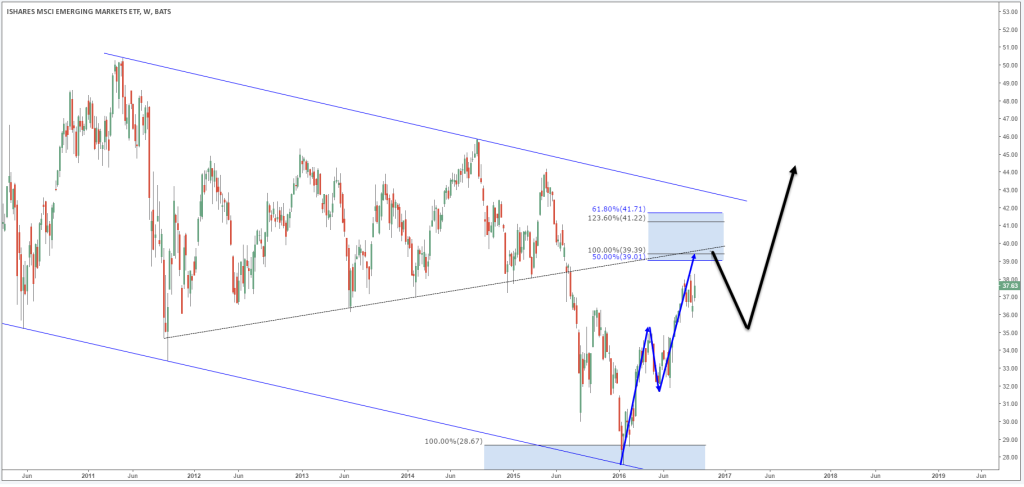
The weekly chart doesn’t look so bullish as EEM did 3 waves from 1.20.2016 low reaching equal legs area and 50-61.8 % Fibonacci retracement , it also facing a retest of the broken 2011 trend-line and the 2007 channel line . Correlating with similar instruments the stock doesn’t need a big pullback , it should remain well supported in 3 , 7 or 11 swings and while it will remain above 1/20 low it should resume higher that’s why it’s not recommended to short it . Only a break below this year’s low could open another extension to the downside turning the stock into a double three correction retesting 2008 low before bouncing again into the same range.
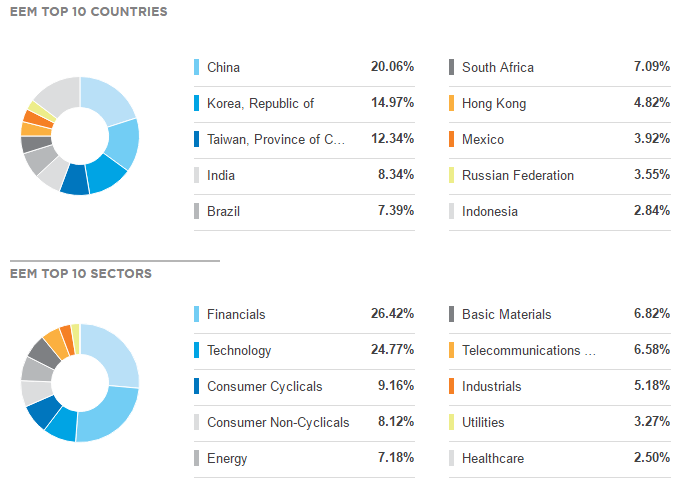
The shift of economic growth toward eastern Asia isn’t a coincidence as EEM & VWO ( Vanguard FTSE Emerging Markets ETF ) top 3 weighted countries are China , Republic of Korea and Taiwan , the most weighted sectors are Financial & Technology which explains why investors are switching their intention to these rapidly growing emerging markets .
If you enjoyed this article, feel free to read other diversified articles at our Technical Blogs and also check Chart of The Day . For further information on how to find levels to trade forex, indices, and stocks using Elliott Wave and the 3 , 7 or 11 swings technique, try us free for 14 days. You will get access to Professional Elliott Wave analysis in 4 different time frames, Daily Elliott Wave Setup Videos , Live Trading Room and 2 live Analysis Session done by our Expert Analysts every day, 24 hour chat room support, market overview, weekly technical videos and much more so if you are not a member yet, use this opportunity and sign up to get your free trial .

