Hello fellow traders. In today’s blog, we will have a look at the RWE AG stock. The stock is listed in the DAX 30.
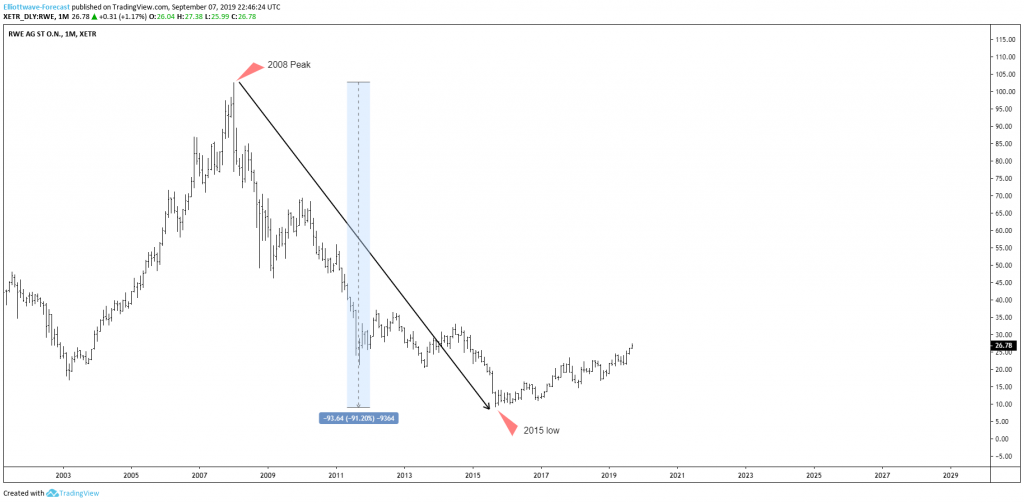
RWE AG is a German electric company which has its Headquarter in Essen Germany. It is one of the biggest electricity producers in Germany. Over the last couple of years, the stock almost lost 90% of its value. Starting from the post-financial peak at 102.60. The stock dropped to 8.67 low which marked the low in 2016.
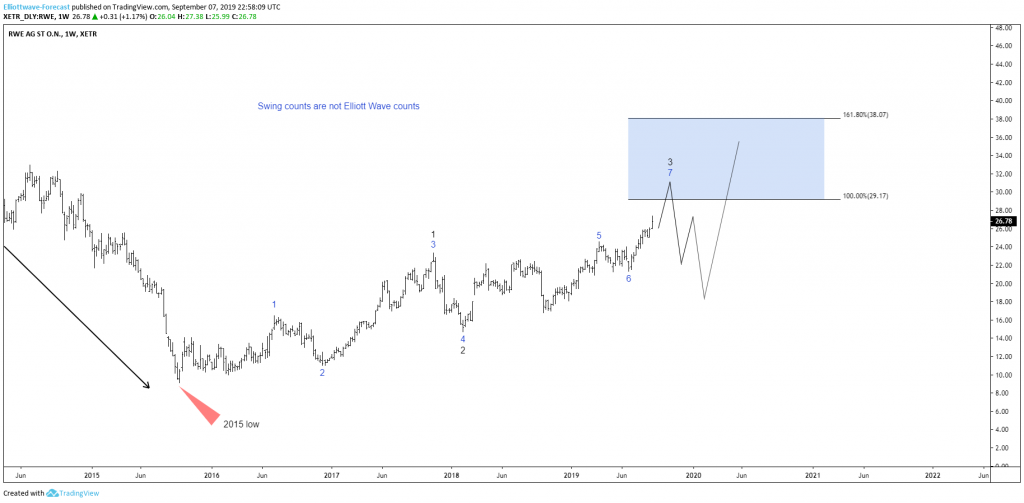
Since, its major low in 2015, RWE could recover almost 20% from its initial low. Let’s have a look at the weekly price action and what to expect for the company.
RWE AG 08.09.2019 Monthly Chart
RWE AG 08.09.2019 Weekly Chart Analysis
In the chart above you can see that the stock ended the cycle up from 2015 crises low at its 2015 peak. Above from there, RWE has been showing strength. Below from there, it has been in the progress of correcting that in 3-7 or 11 swings. Recently, RWE broke above 3/18/2019 peak opening up a higher high sequence. With that said, the stock has an incomplete sequence from 2015 low indicating that more upside towards 29.17-39.07. Consequently, I am looking for another push higher until 29.17 has reached.
Summarizing, the stock should see more upside in the next coming days/ weeks and month into 29.17-39.07 area where a bigger reaction lower could be taking place later on to correct cycle from 2015 low.
I hope you liked this kind of different blog and I wish you all good trades. And for all who are interested in learning more about our unique blue box areas and also want to trade profitably in 2019 then sign up for a free 14 days trial you can cancel anytime. Click the link and see you insight 🙂
Back


