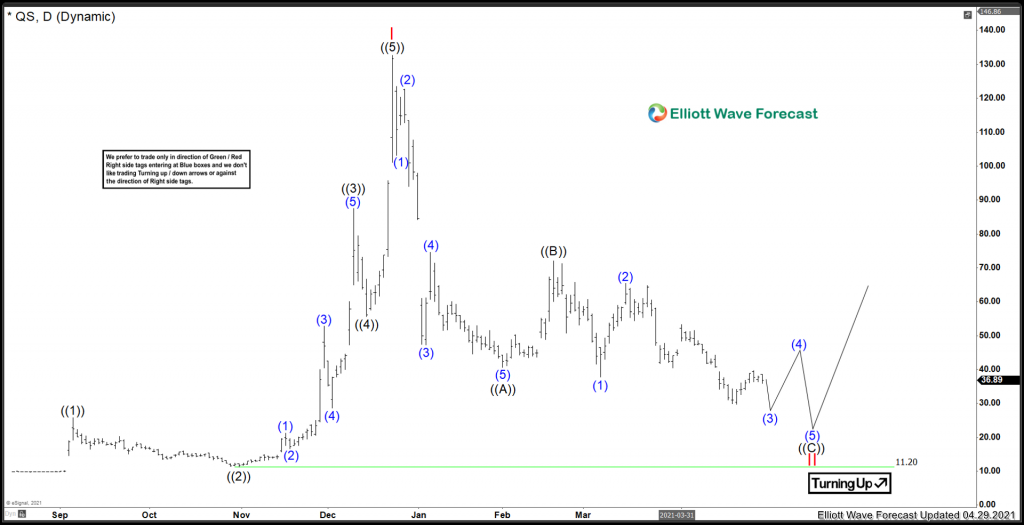
The last time I looked at this chart was spring of 2021, in April. At the time, I was looking for continued downside to take place before resuming higher. You can view this article here. What happened after I analyzed this chart? Pretty much as expected. Lets take a look at the view back in April of 2021.
QuantumScape April 2021 Elliottwave View:
As you can see, I was still looking for some downside before this stock could solidify a bottom. Now lets fast forward to today and see how things turned out.
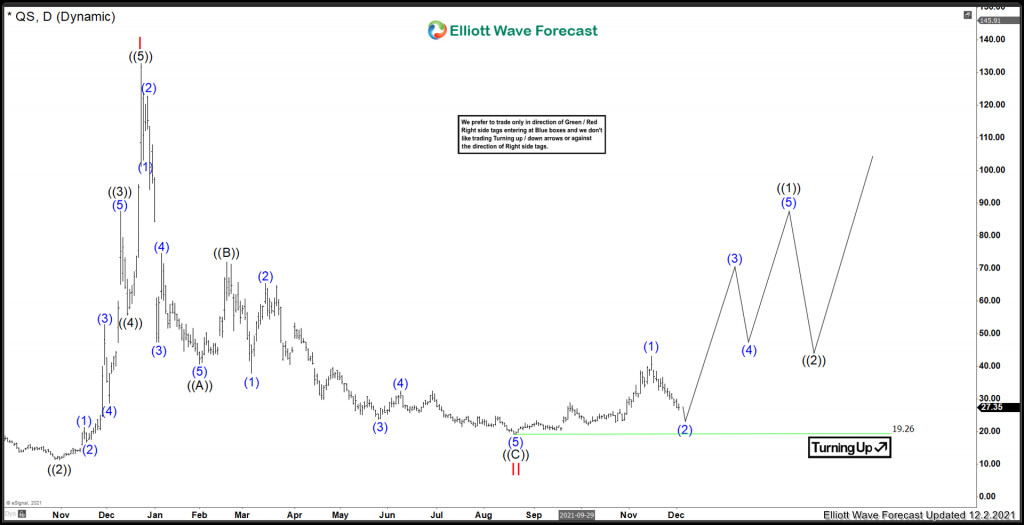
Quantumscape Elliottwave View December 2021:
It appears for now, that the stock has struck a low in August of 2021 at the 19.26 low.
Medium term term view from the August 2021 low at 19.26. The stock has rallied into a peak in Blue (1) which was set on 11/15/2021 at 43.08. Since that peak has taken place the price action has pulled back against that cycle low, in blue (2). For now, it is favoured that the price structure will remain above the 19.26 low. After that (2) low takes place, I am favouring a 5 waves move into ((1)), which would be nesting with the Red I and II degree. For now, there is no confirmation that the low is in place and longs need to remain cautious on taking new long positions. Long positions right now would be trading against the 19.26 low.
In conclusion, should that 19.26 low break, it is possible that the stock will break down to new all time lows. For now, we do not favour that scenario playing out. We don’t prefer to trade the “turning up” and “turning down” right sides, which are more speculative trades.
Risk Management
Using proper risk management is absolutely essential when trading or investing in a volatile stocks. Elliott Wave counts can evolve quickly, be sure to have your stops in and define your risk when trading.
Improve your trading success and master Elliott Wave like a pro with our 14 day trial today. Get Elliott Wave Analysis on over 70 instruments including GOOGL, TSLA, AAPL, FB, MSFT, GDX and many many more.
Back


