In today’s blog, we will have a look at the latest price action of the Pivotal Software stock. In the previous month, I did a blog about the company. You can read it here.
In that blog, we talked about the price action and the reason why the company lost half of its value. But I also said that the stock was close to equal legs. Regardless of what happens when that area has been reached the stock should see a reaction higher.
Now, let’s have a look at the chart from the previous blog.
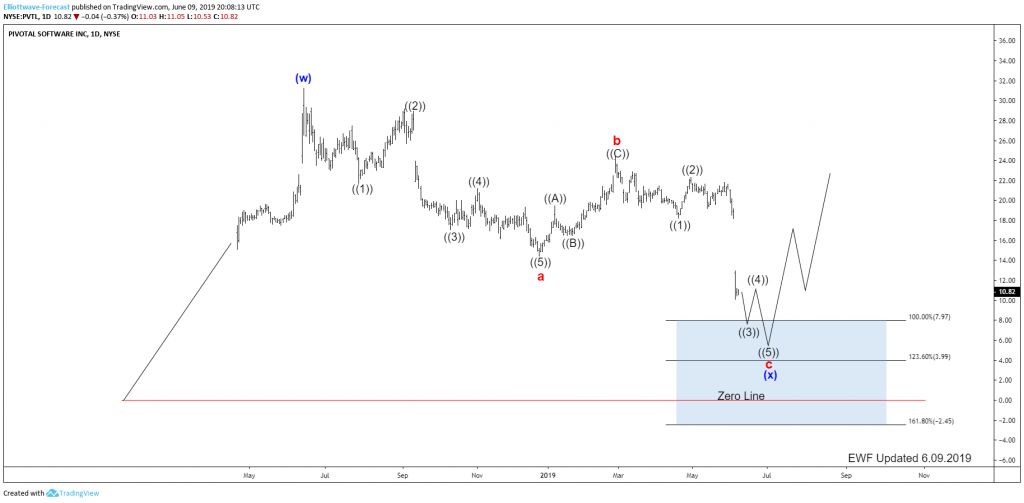
Pivotal Software Daily Elliott Wave view 06.09.2019
In the chart above, you can see the daily chart of Pivotal Siftware Inc. The stock ended the cycle from its Zero line at 6/14/2018 peak ($31.36). Below from there, it has been correcting that cycle in the sequences of 3-7 or 11 swings. With the gap down it opened up an incomplete sequence to the downside from 6/14/2018 peak towards the equal legs of $7.97-3.99 areas (blue box).
From that blue box area, we should get a bigger reaction higher in 3 waves at least which should help the company again to rise in value.
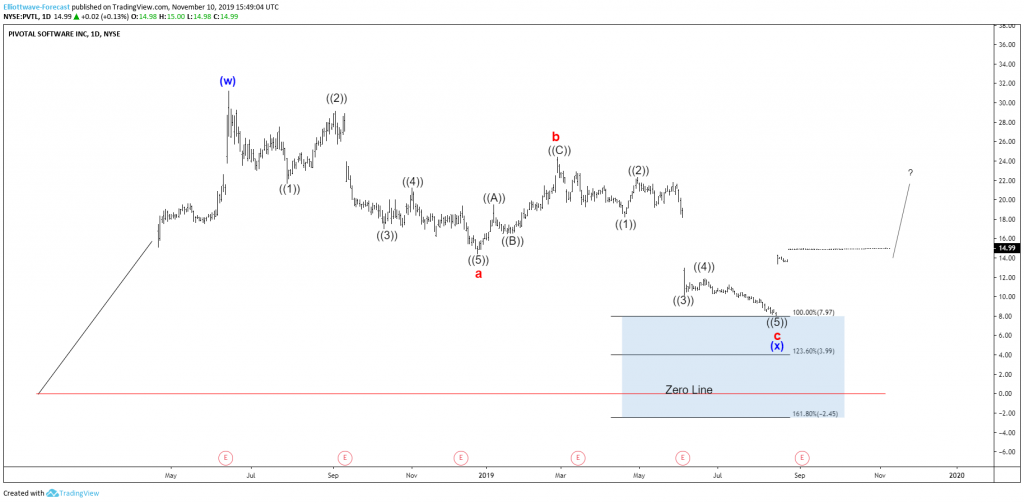
Pivotal Software Daily Elliott Wave view 11.10.2019
In the latest chart above you can see how the market reached perfectly at the blue box. Long term traders could have used that area for buying. At this stage it ended the pullback from its all-time low and could be now in the progress of rising in value again. Anyway, any trades from that blue box should be risk-free by now and looking for more upside. As you can see the blue box is very powerful.
I hope you liked this blog and I wish you all good trades. And for all who are interested in learning more about our unique blue box areas and also want to trade profitably in 2019 then sign up for a free 14 days trial you can cancel anytime. Click the link and see you insight 🙂
Back


