Palantir Technologies (PLTR), Inc. is a holding company, which engages in the development of data integration and software solutions. It operates through the Commercial and Government segments. The firm offers automotive, financial compliance, legal intelligence, mergers and acquisitions solutions.
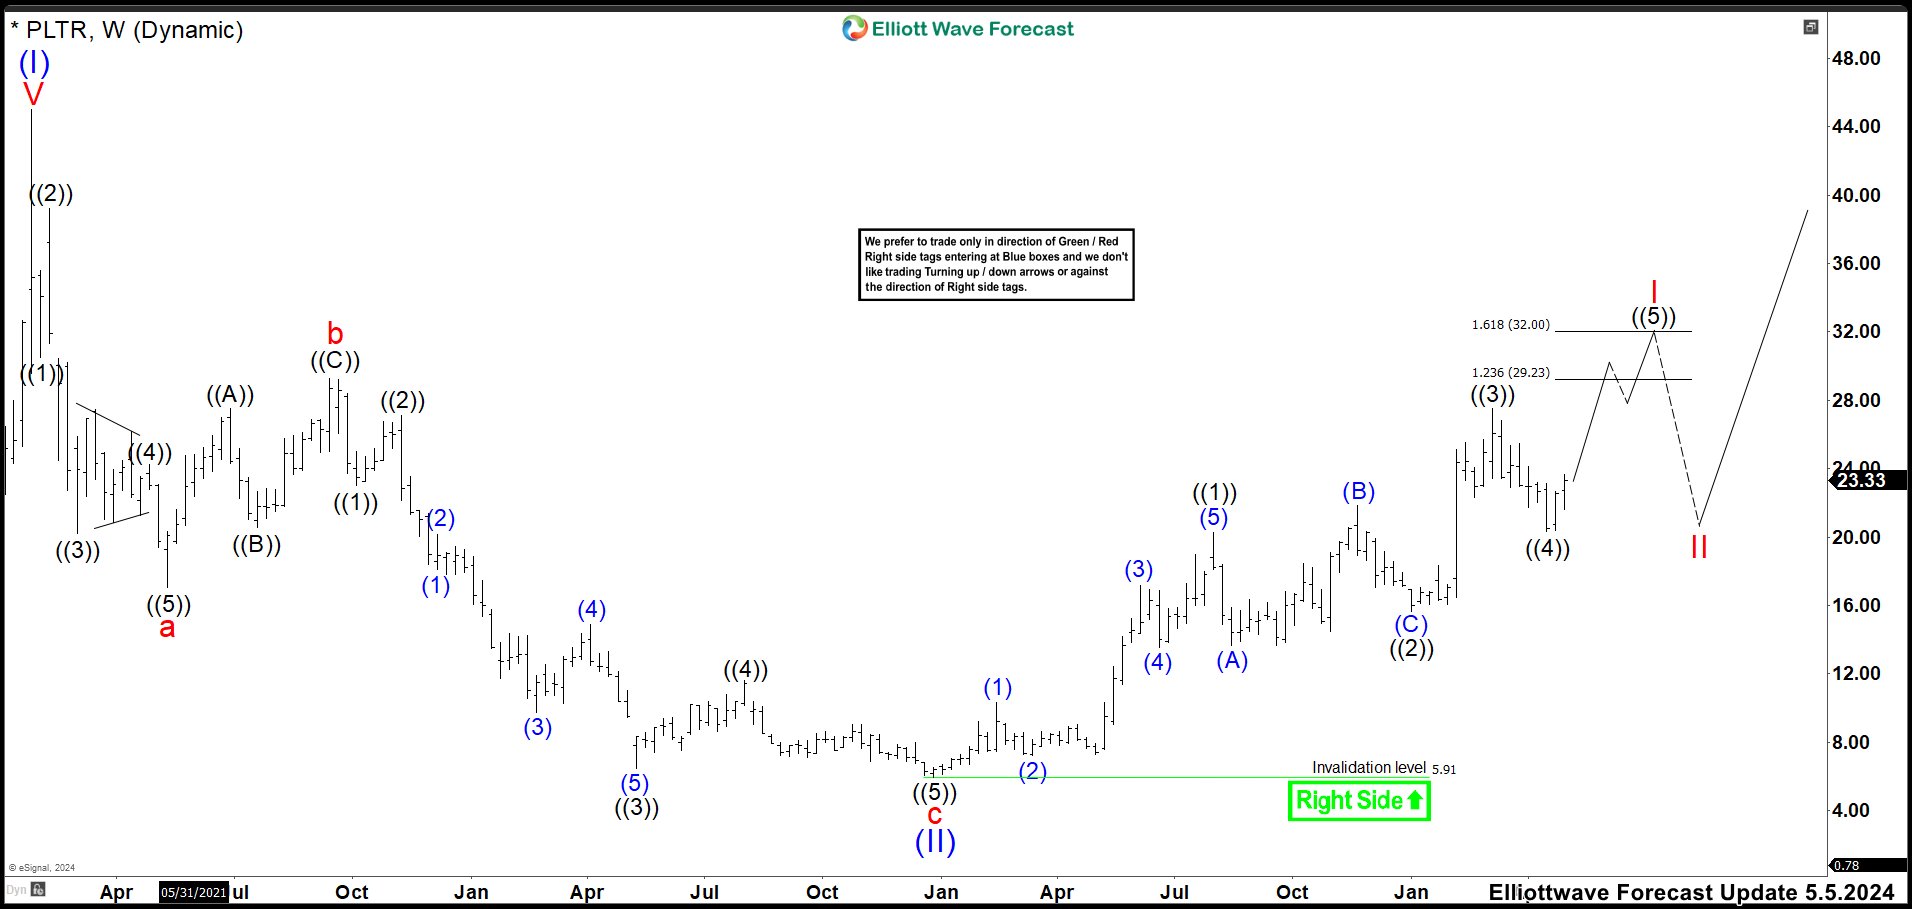
PALANTIR (PLTR) Weekly Chart May 2024
Palantir ended a cycle at $45.00 in January 2021. Then it did a deep pullback as a zig zag correction ending wave (II) at 5.91 low. The market started an impulse structure as wave ((1)) ended at $20.27. Then, wave ((2)) started and it did a running flat correction. The wave (A) ended at $13.68 low and rallied breaking wave ((1)) high completing wave (B) at $21.85. Last leg as wave (C) developed an ending diagonal structure ending at $15.66 low and wave ((2)) correction. Market rallied in 5 waves ending an impulse at $27.50 high as wave ((3)). Next pullback completed at $20.33 low and for us that was the end of wave ((4)) correction. We expected to continue higher to end a wave ((5)) and complete the whole wave I before seeing a correction in 3, 7 or 11 swings as wave II. This wave ((5)) should end in $29.23 – $32.00 area. (If you want to learn more about Elliott Wave Theory, follow these links: Elliott Wave Education and Elliott Wave Theory).
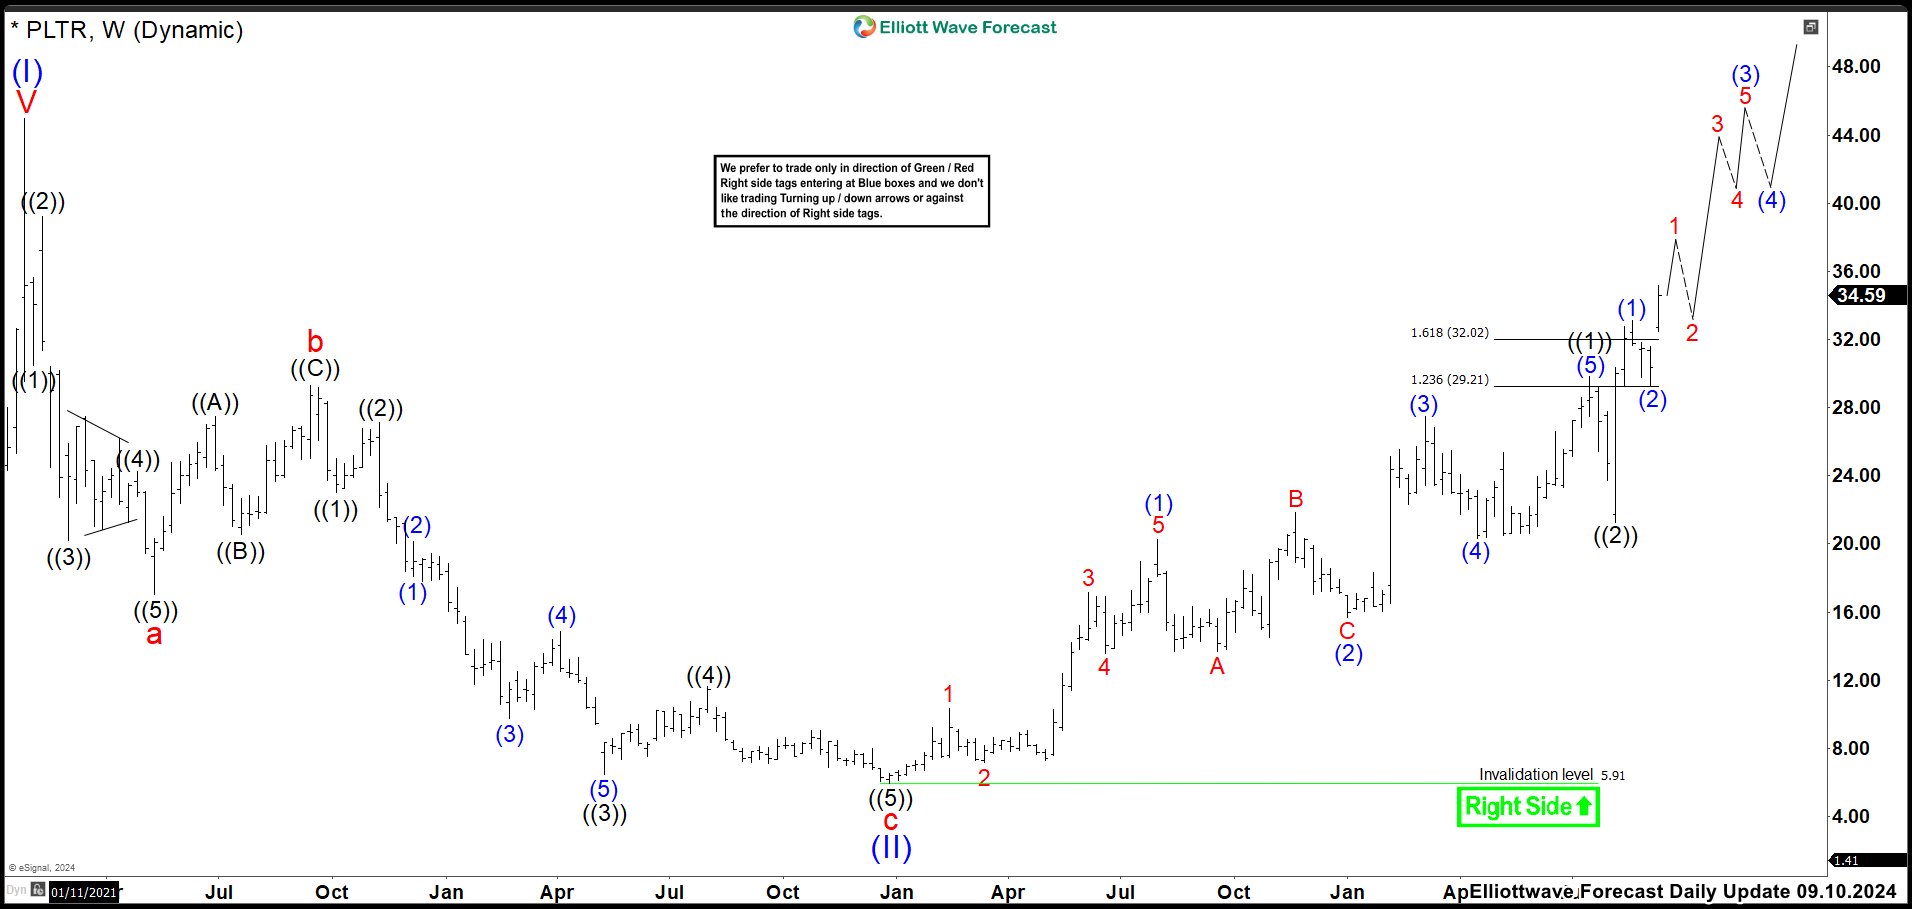
PALANTIR (PLTR) Weekly Chart September 2024
After 4 months, you can check above the current weekly count of PLTR. We have changed the degree of the count. The market conditions suggest PLTR is still in wave I; therefore, we change the wave I for wave ((1)). Wave ((1)) ended at $29.83 in $29.23 – $32.00 area where we were expecting to hit a target. Then, the price pullback to 21.23 where we called wave ((2)) completed resuming with a strong rally breaking above wave ((1)), supporting that wave ((3)) is underway. For now, we are looking to continue to the upside until completing wave ((3)). We should look for buying dips as price remains above wave ((2)) low.
Elliott Wave Forecast
www.elliottwave-forecast.com updates one-hour charts 4 times a day and 4-hour charts once a day for all our 78 instruments. We do a daily live session where we guide our clients on the right side of the market. In addition, we have a chat room where our moderators will help you with any questions you have about what is happening in the market.
14 day Trial costs $9.99 only. Cancel anytime at support@elliottwave-forecast.com
Back


