

The Power of 3-7-11 and the Grand Super Cycle: How We Saw the Bullish Turn in April 2025 Back on April 9, 2025, while World Indices were dropping sharply and global sentiment had turned overwhelmingly bearish, we published an article that challenged the fear-driven narrative. We explained why selling was not the right approach and […]
-
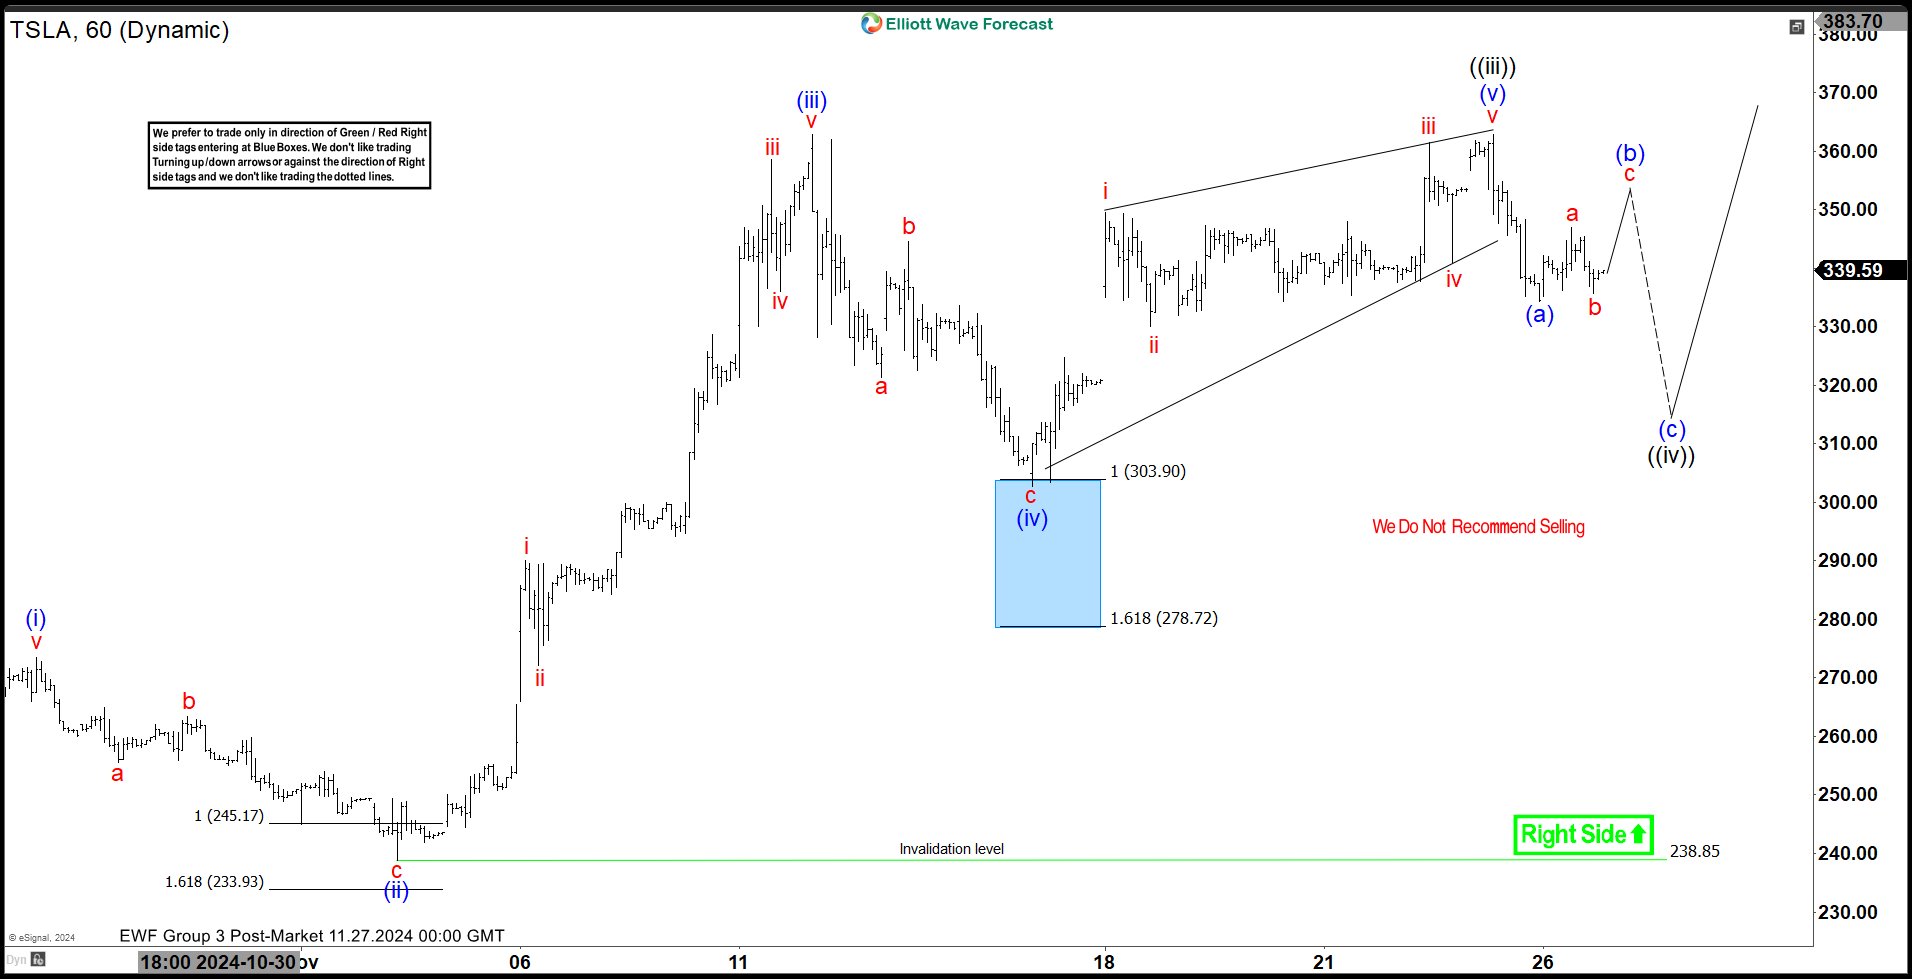
Elliott Wave View: Tesla (TSLA) Impulsive Rally Remains in Progress
Read MoreTesla (TSLA) impulsive rally is in progress and the stock should extend higher. This article and video look at the Elliott Wave path.
-
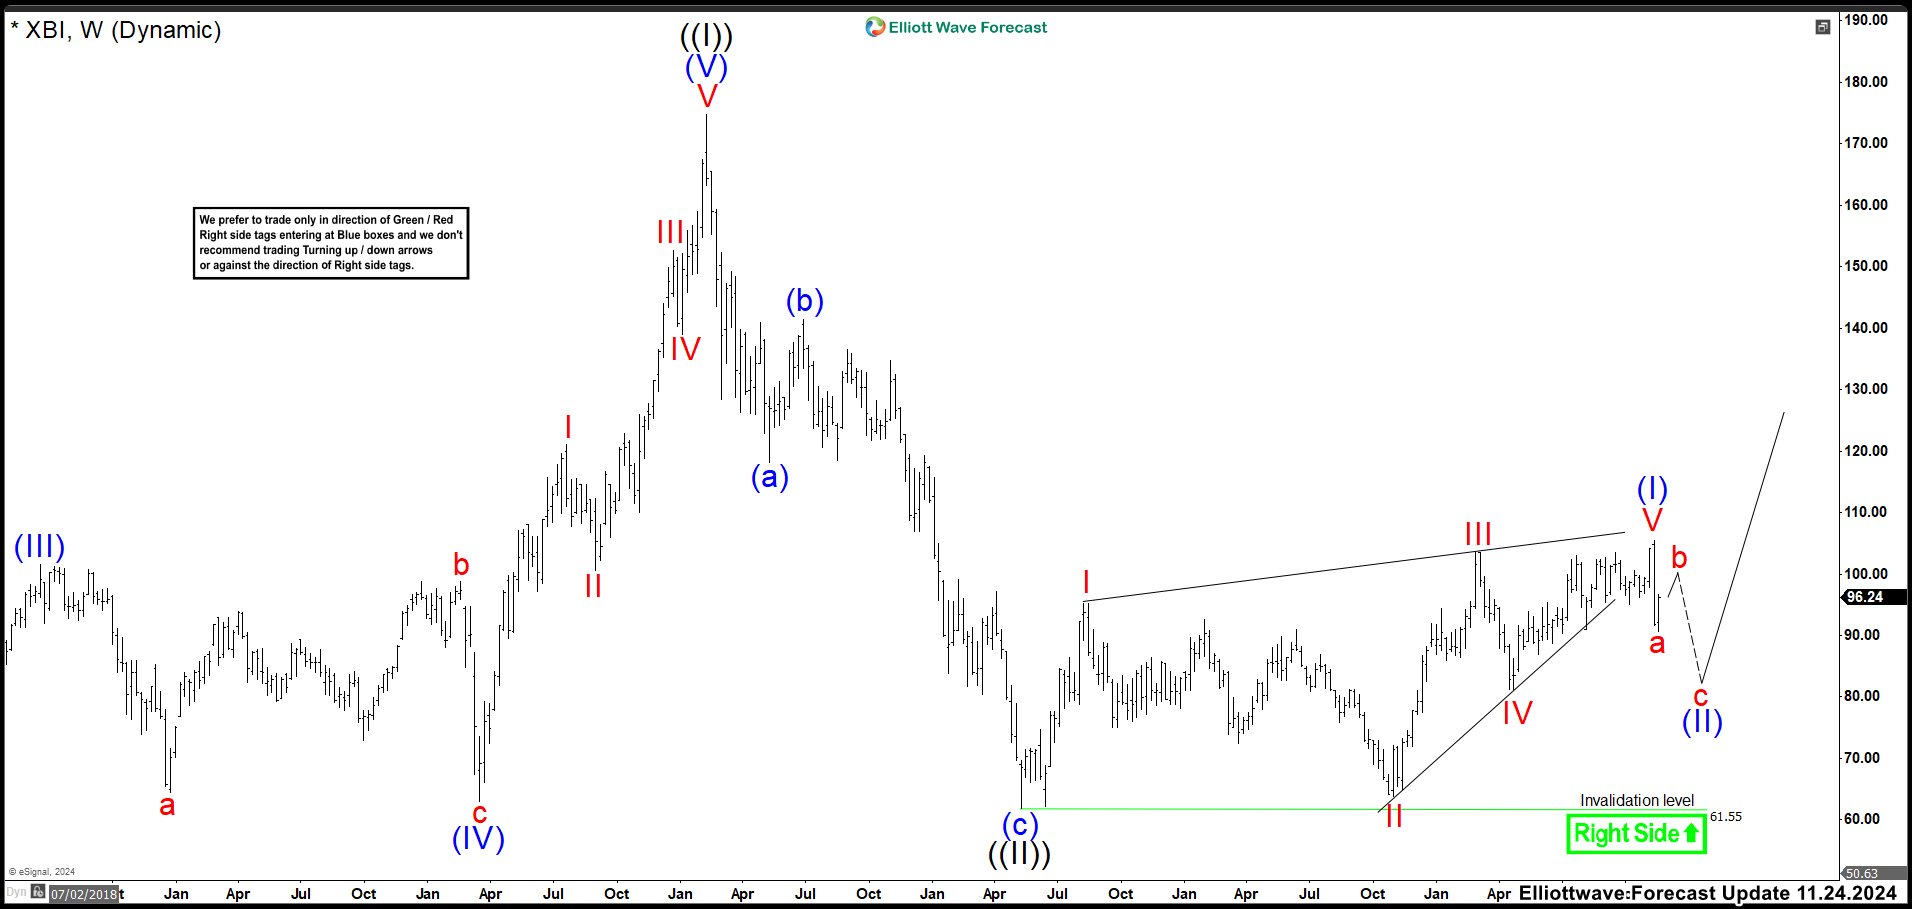
Biotech ETF (XBI) Ended a Diagonal. Looking for Buying Dips.
Read MoreThe SPDR S&P Biotech ETF (XBI) is an exchange-traded fund that tracks the biotechnology segment of the S&P Total Market Index. This ETF allows investors to gain exposure to large, mid, and small-cap biotech stocks. If you’re interested in biotechnology, XBI could be worth exploring further. Here are some of its top holdings and their percentage weights: United Therapeutics […]
-
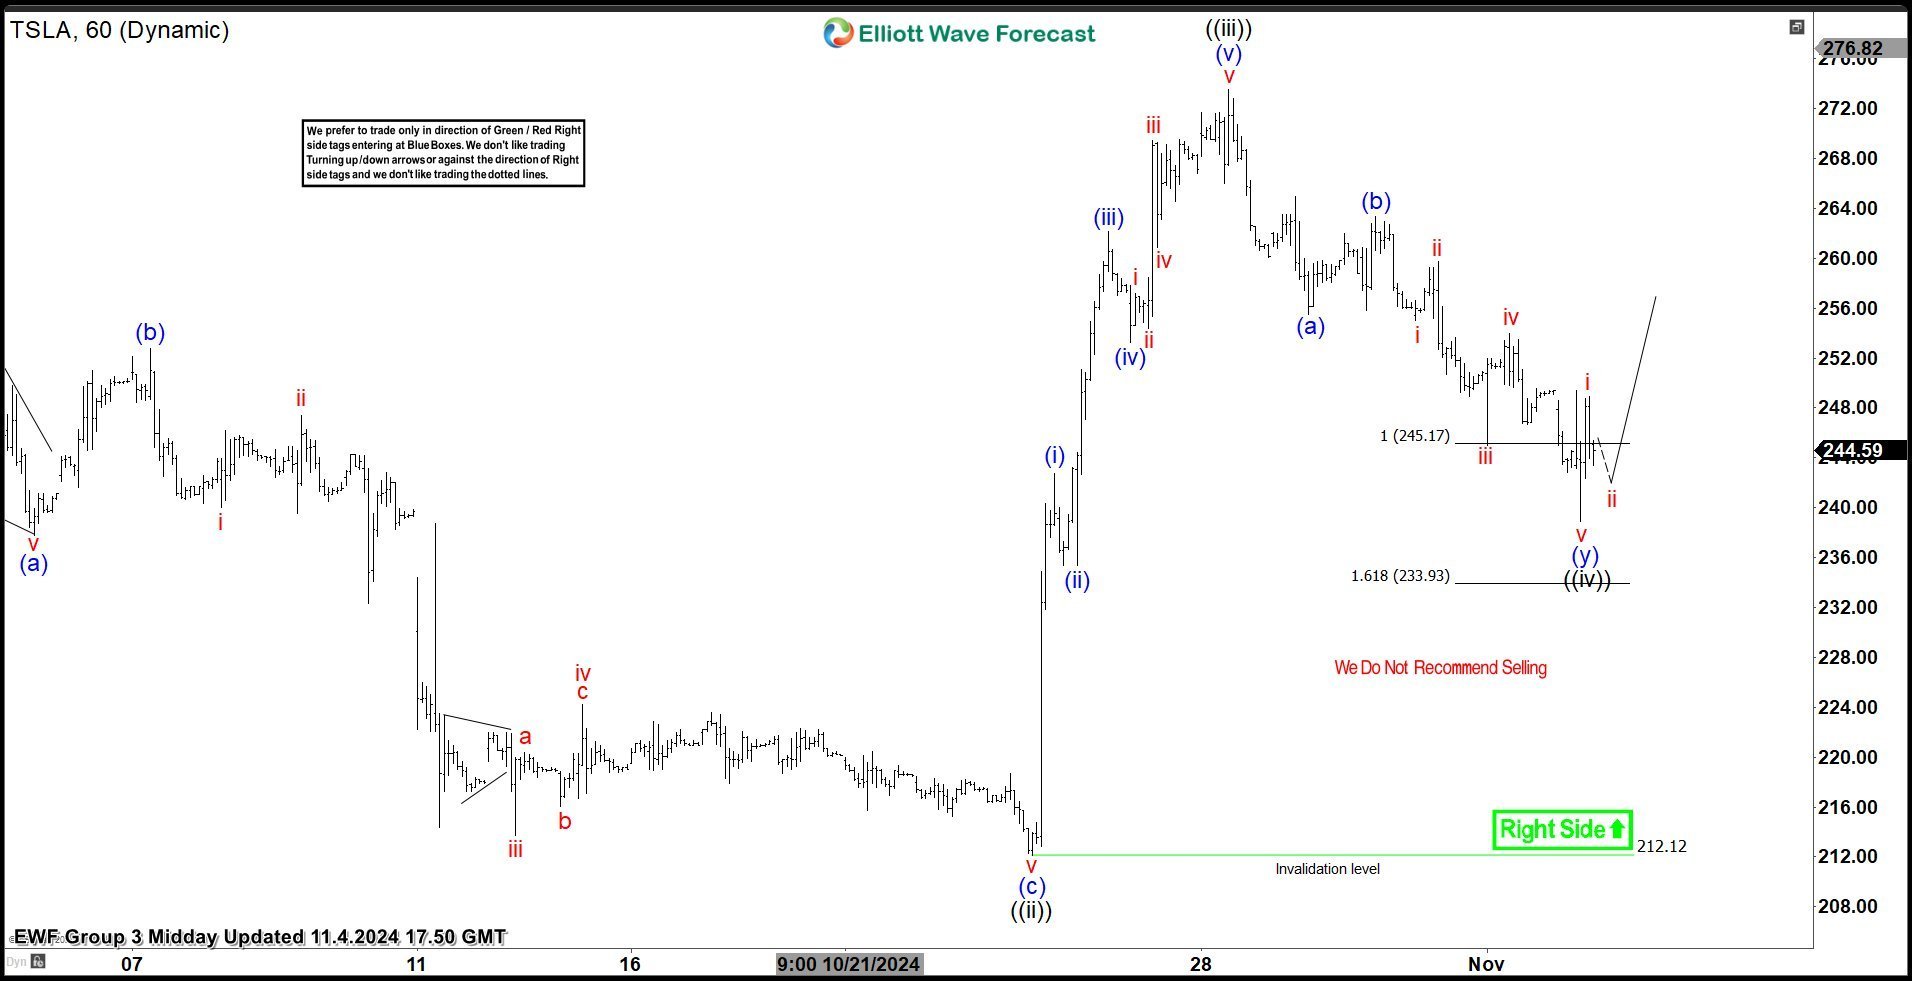
TESLA (TSLA) Stock : Elliott Wave Forecasting the Rally
Read MoreIn this technical article we’re going to take a quick look at the weekly Elliott Wave charts of Tesla Stock (TSLA) , published in members area of the website. As many of our members are aware, the stock has given us good buying opportunities recently. The stock is showing impulsive bullish sequences in the cycle […]
-

BlackRock (NYSE: BLK) Strong Weekly Breakout To Upside
Read MoreIn our previous article, BlackRock (NYSE: BLK) was expected to continue the rally to the upside based on the bullish sequence created from 2022 low. In today’s video blog, we’ll go over the new development in the technical structure of the stock and we’ll explain the potential path based on the Elliott Wave Theory . BLK cycle from […]
-
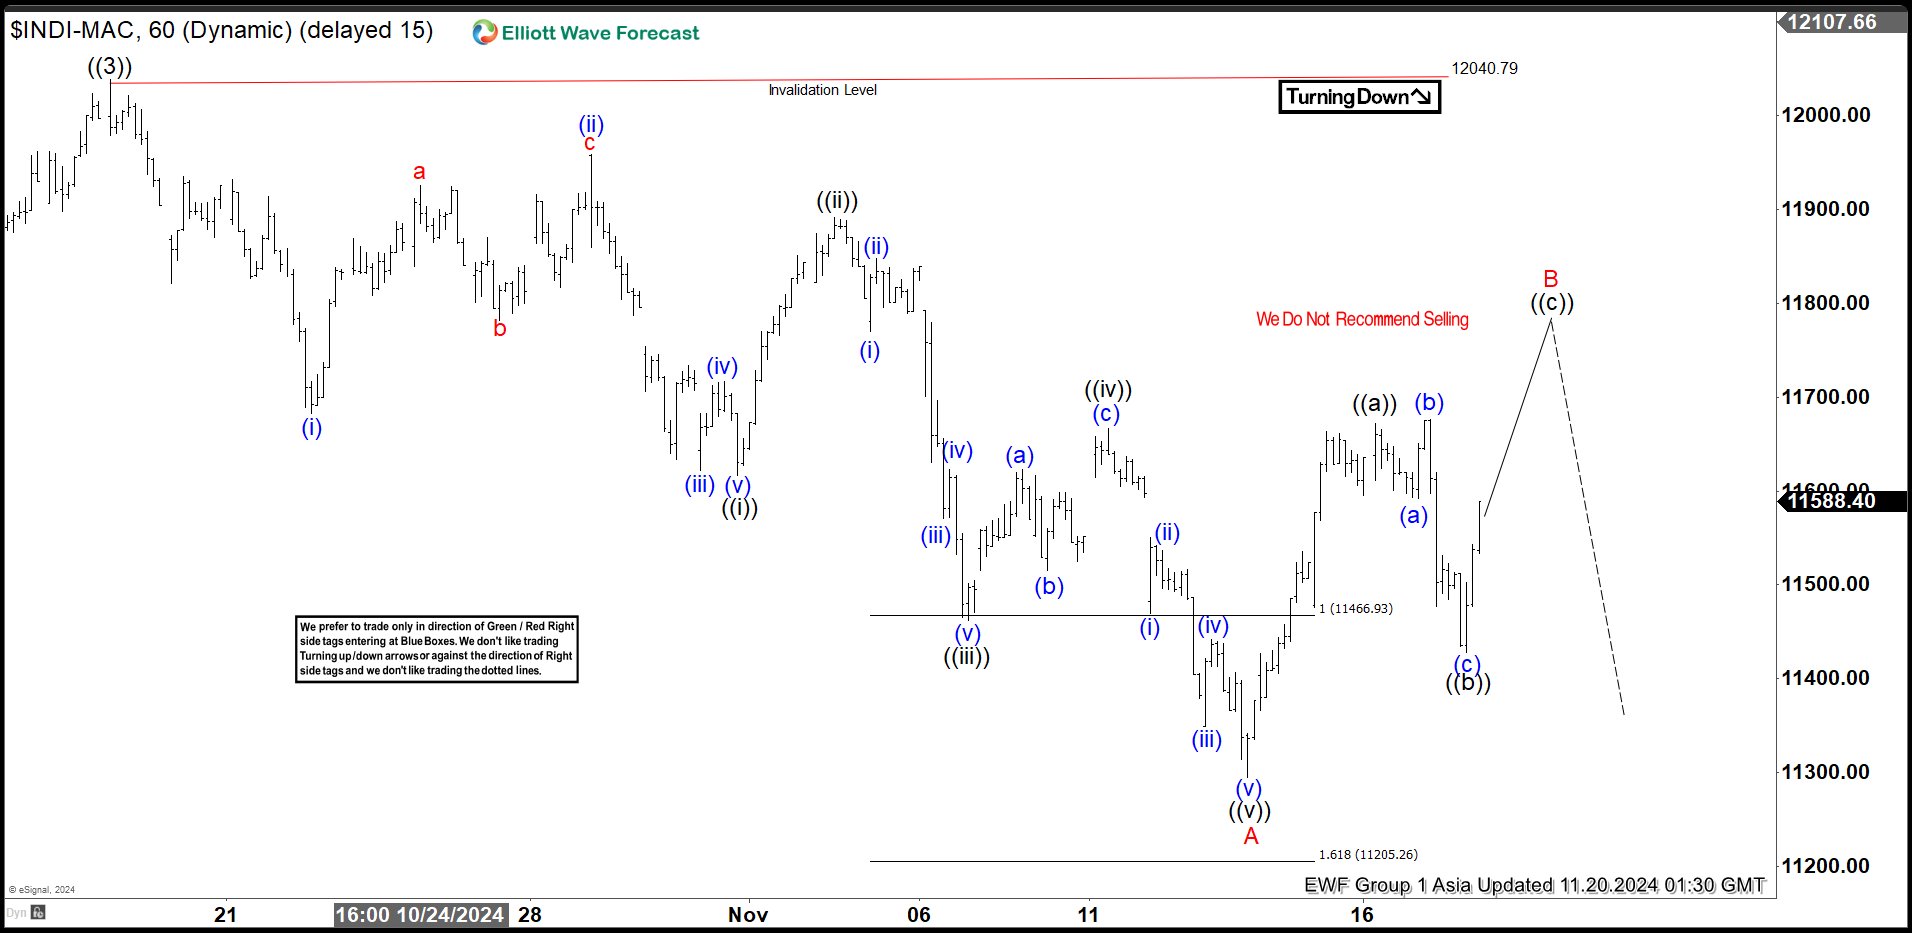
Elliott Wave View on IBEX Provides Warning that Indices can See More Downside
Read MoreIBEX shows 5 swing lower from 10.17.2024 high looking for more downside. This article and video look at the Elliott Wave path.
-
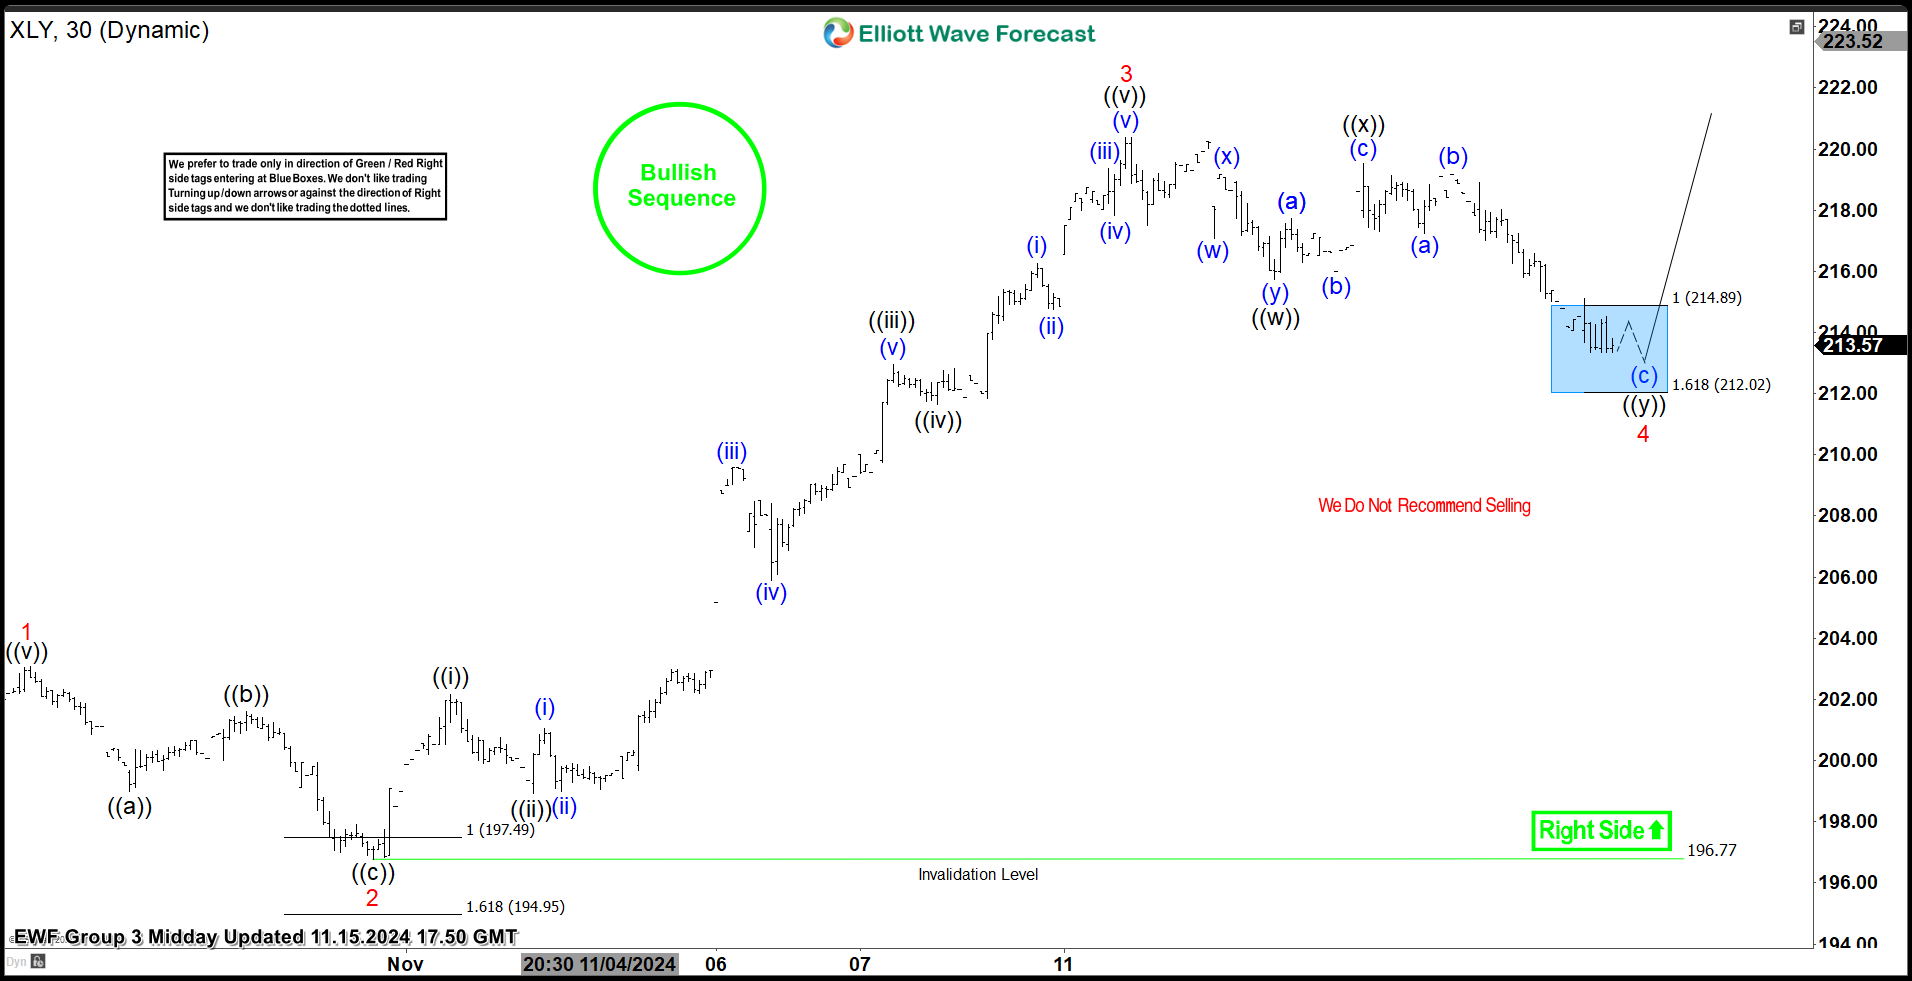
XLY Responding Higher From The Elliott Wave Blue Box Area
Read MoreIn this blog, we take a look at the past performance of XLY charts. The ETF is responding higher from the elliott wave blue box area.