
The Power of 3-7-11 and the Grand Super Cycle: How We Saw the Bullish Turn in April 2025 Back on April 9, 2025, while World Indices were dropping sharply and global sentiment had turned overwhelmingly bearish, we published an article that challenged the fear-driven narrative. We explained why selling was not the right approach and […]
-

Broadcom Inc (AVGO) Favors Rally Towards $275
Read MoreBroadcom Inc., (AVGO) designs, develops & supplies various semiconductor devices with focus on complex digital & mixed signal metal oxide semiconductor. The company operates in Semiconductor Solutions & Infrastructure Software. It comes under Technology Sector & trades as “AVGO” ticker at Nasdaq. AVGO reacted higher from the extreme areas after correction ended at $196.23 low. […]
-

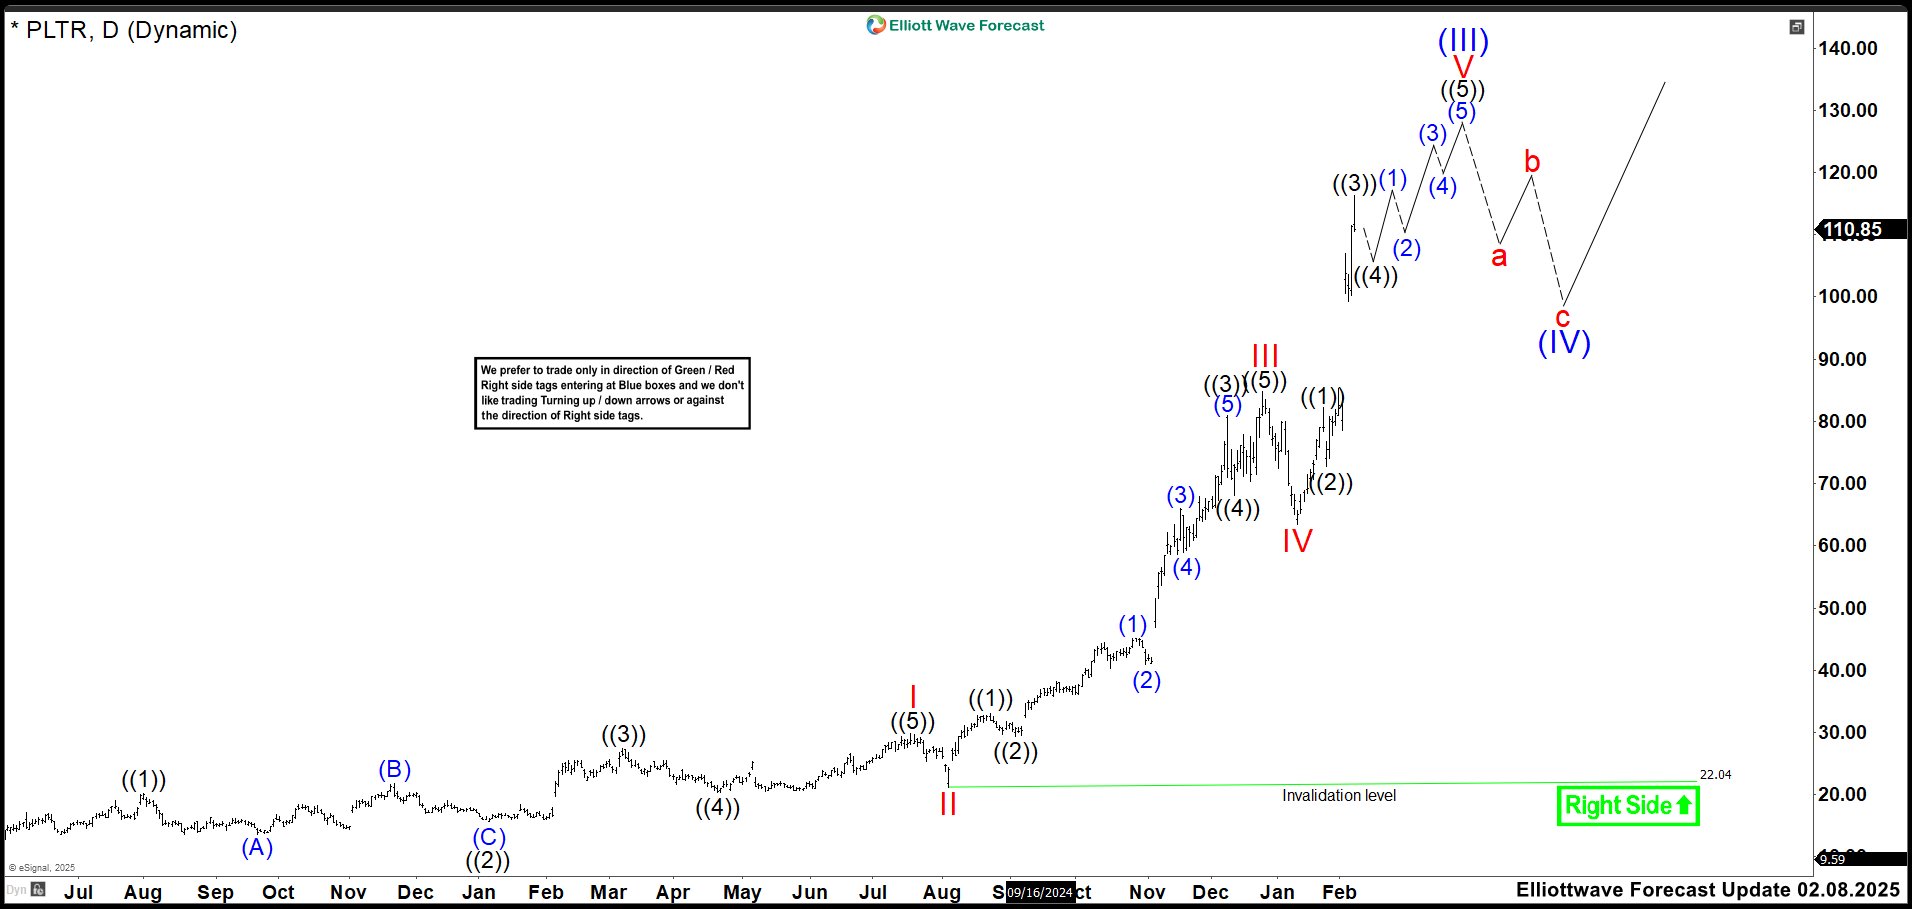
Palantir (PLTR) Stocks: Poised for Continued Growth Amidst Strong Earnings and AI Momentum
Read MorePalantir Technologies (PLTR), Inc. is a holding company, which engages in the development of data integration and software solutions. It operates through the Commercial and Government segments. The firm offers automotive, financial compliance, legal intelligence, mergers and acquisitions solutions. Palantir (PLTR) Weekly Technical Analysis – September 2024 Palantir (PLTR) Weekly Chart – Elliott Wave Forecast […]
-

Long Term Elliott Wave View on SMIC
Read MoreSemiconductor Manufacturing International Corporation (SMIC) is looking to extend higher as an impulse. This article looks at the Elliottwave path.
-

BlackRock (NYSE: BLK) Incomplete Bullish Sequence Support The Upside
Read MoreIn our previous article, we explained weekly breakout for BlackRock (NYSE: BLK) and presented the technical structure within its current cycle from 2022 low. Today, we’ll continue analysing the weekly aph based on the Elliott Wave Theory. BlackRock BLK rally into new all time highs in recent month created an incomplete bullish sequence from all time low […]
-

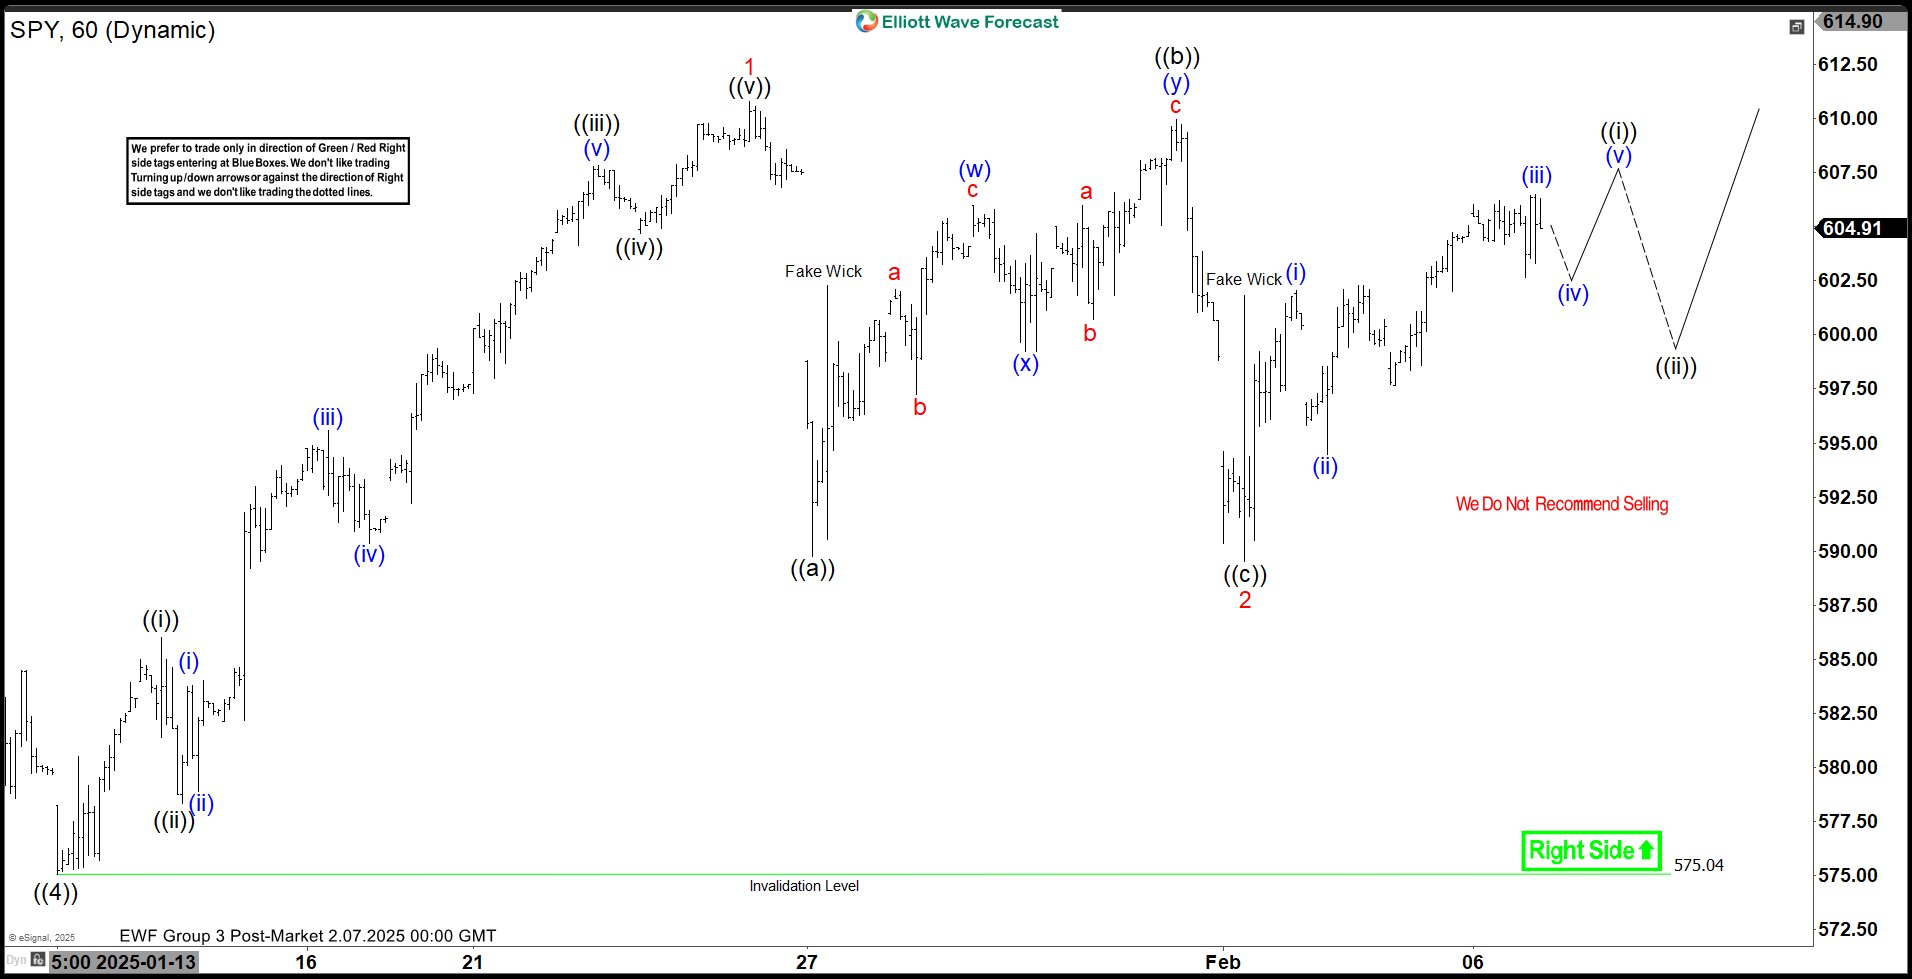
Elliott Wave View: SPY Looking to Resume Higher
Read MoreSPDR S&P 500 ETF (SPY) is looking to resume higher in impulsive structure. This article and video look at the Elliott Wave path.
-

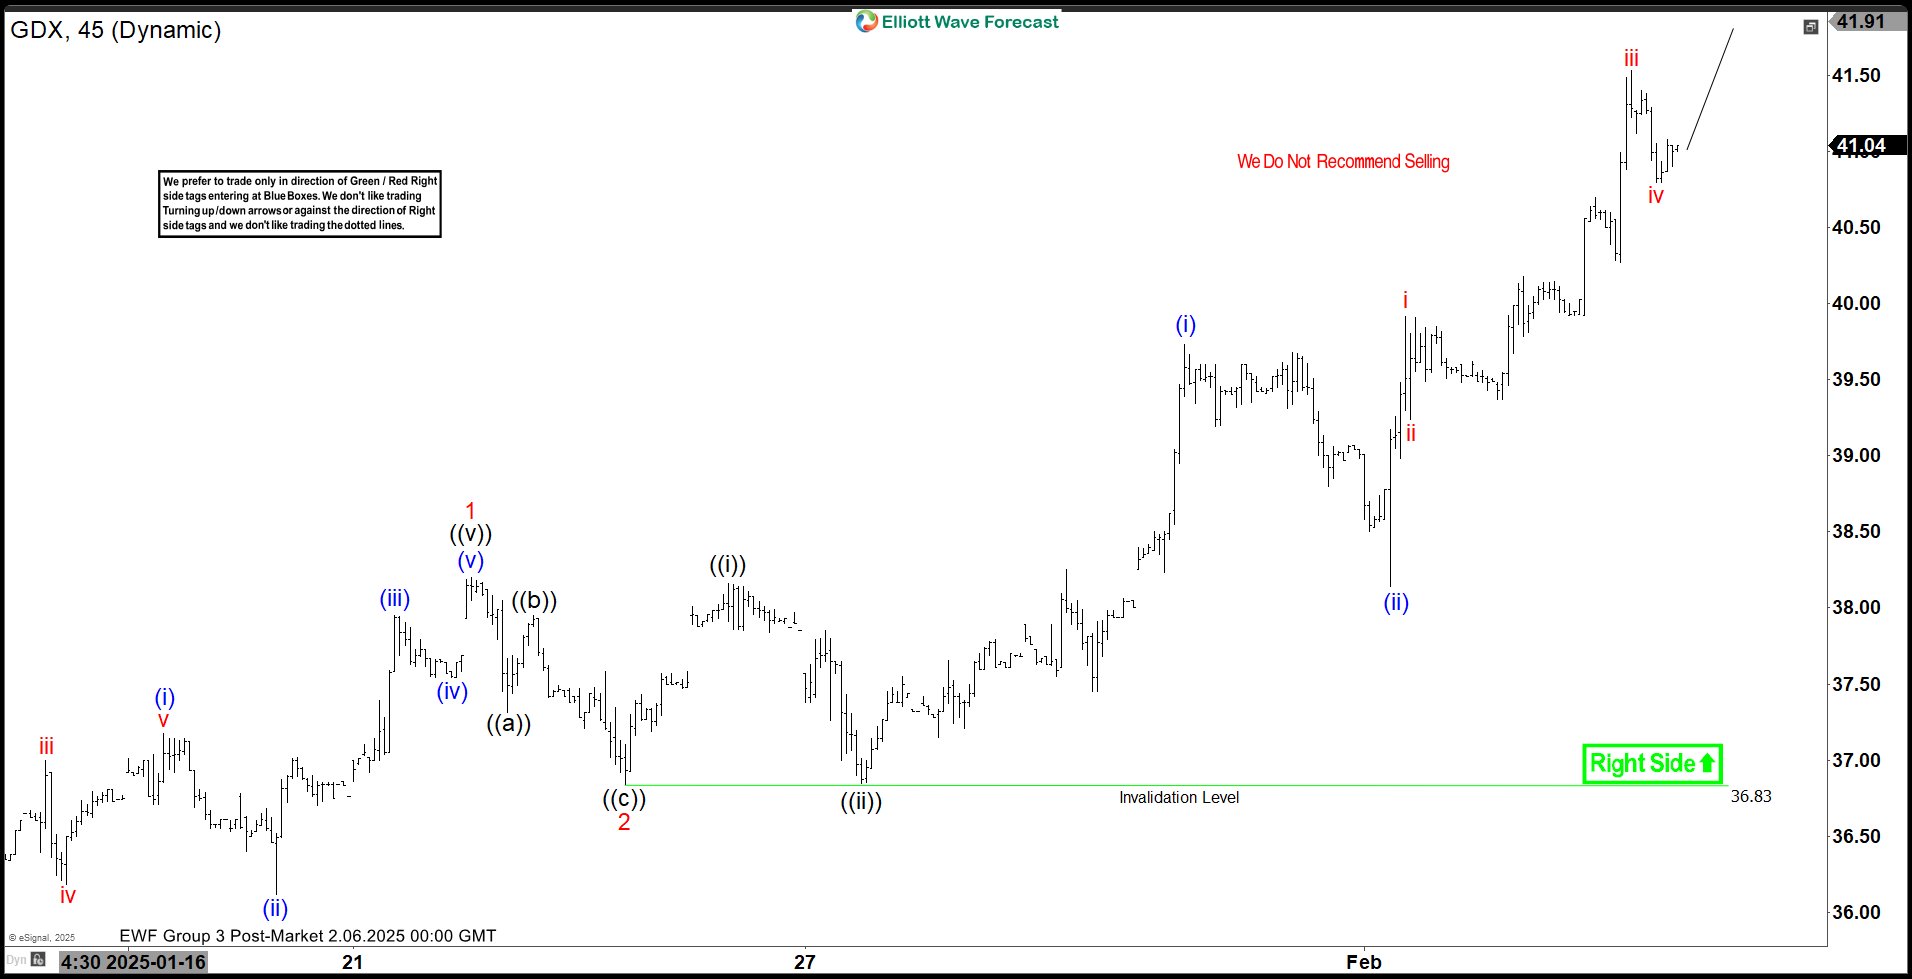
Elliott Wave View: Gold Miners ETF (GDX) Impulse Rally in Progress
Read MoreGold Miners ETF (GDX) looks for further upside in a nesting impulse and dips to find support. This article and video look at the Elliott Wave path.