

The Power of 3-7-11 and the Grand Super Cycle: How We Saw the Bullish Turn in April 2025 Back on April 9, 2025, while World Indices were dropping sharply and global sentiment had turned overwhelmingly bearish, we published an article that challenged the fear-driven narrative. We explained why selling was not the right approach and […]
-
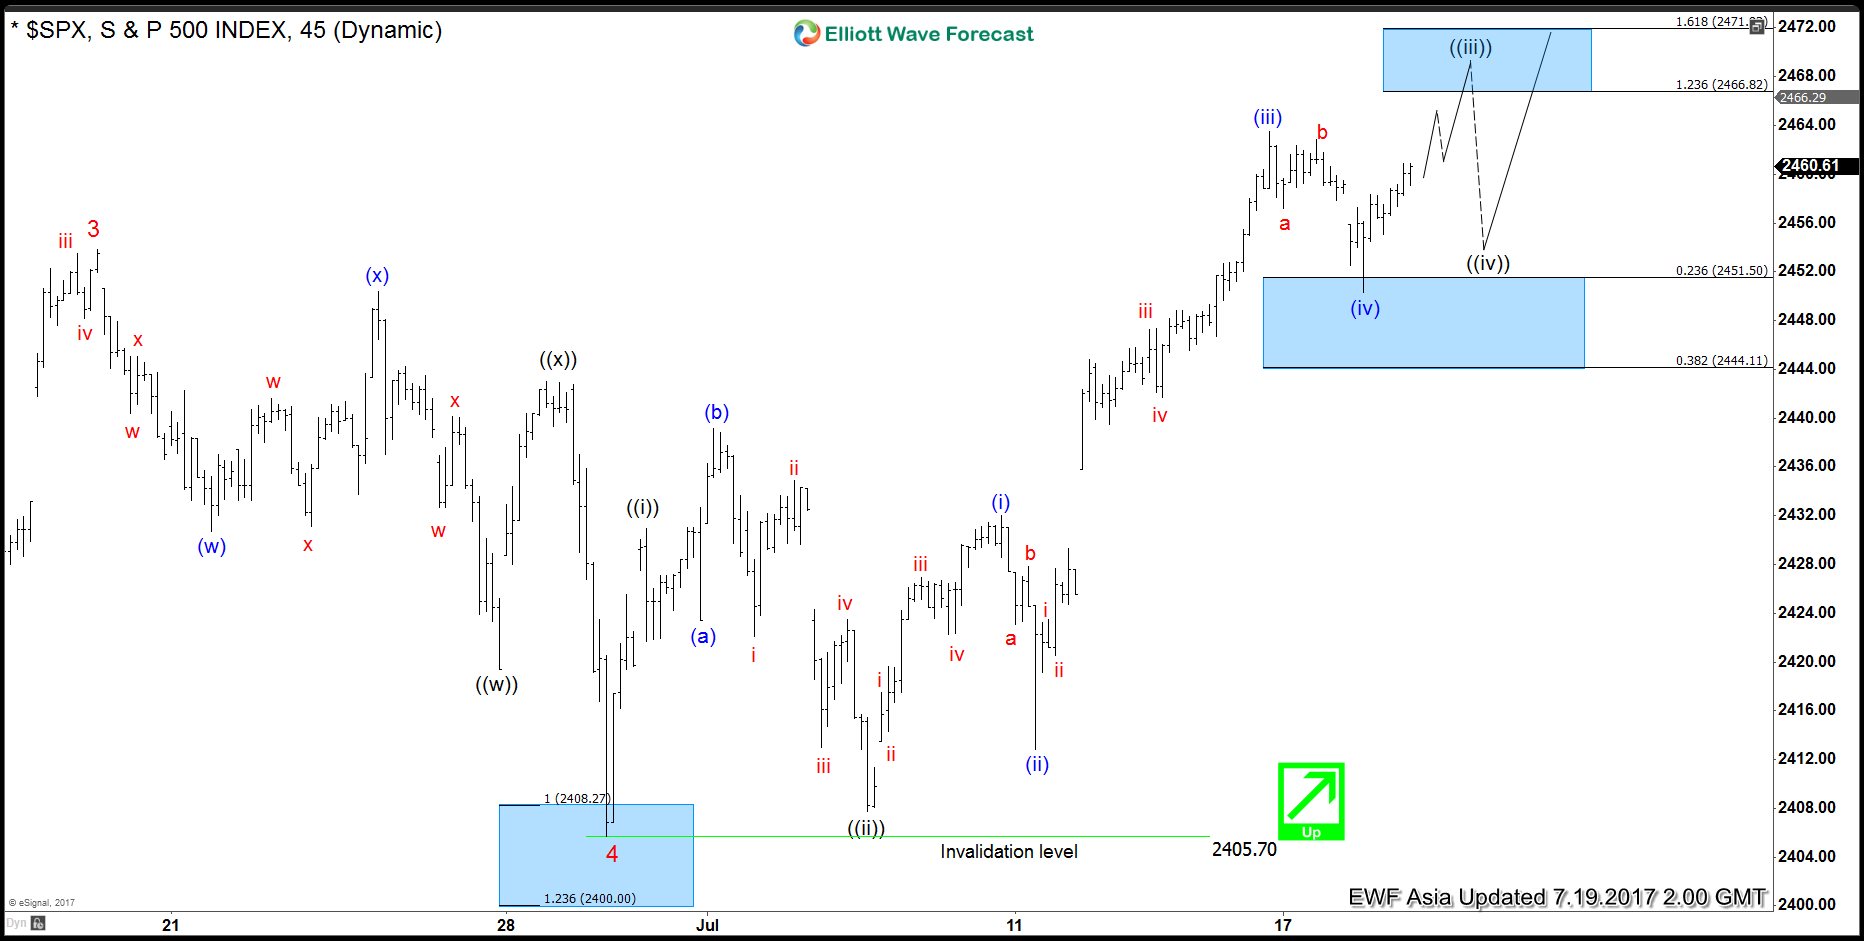
SPX Elliott wave view: Showing impulse
Read MoreShort term SPX Elliott Wave view suggests the rally from 5/18 low (2352.7) to 6/19 peak (2453.8) ended Minor wave 3. The pullback from 2453.8 to 2405.70 on 6/29 low ended Minor wave 4. Up from there, the rally is unfolding as an impulse Elliott Wave structure with extension. This 5 waves move could be Minute wave ((a)) of […]
-
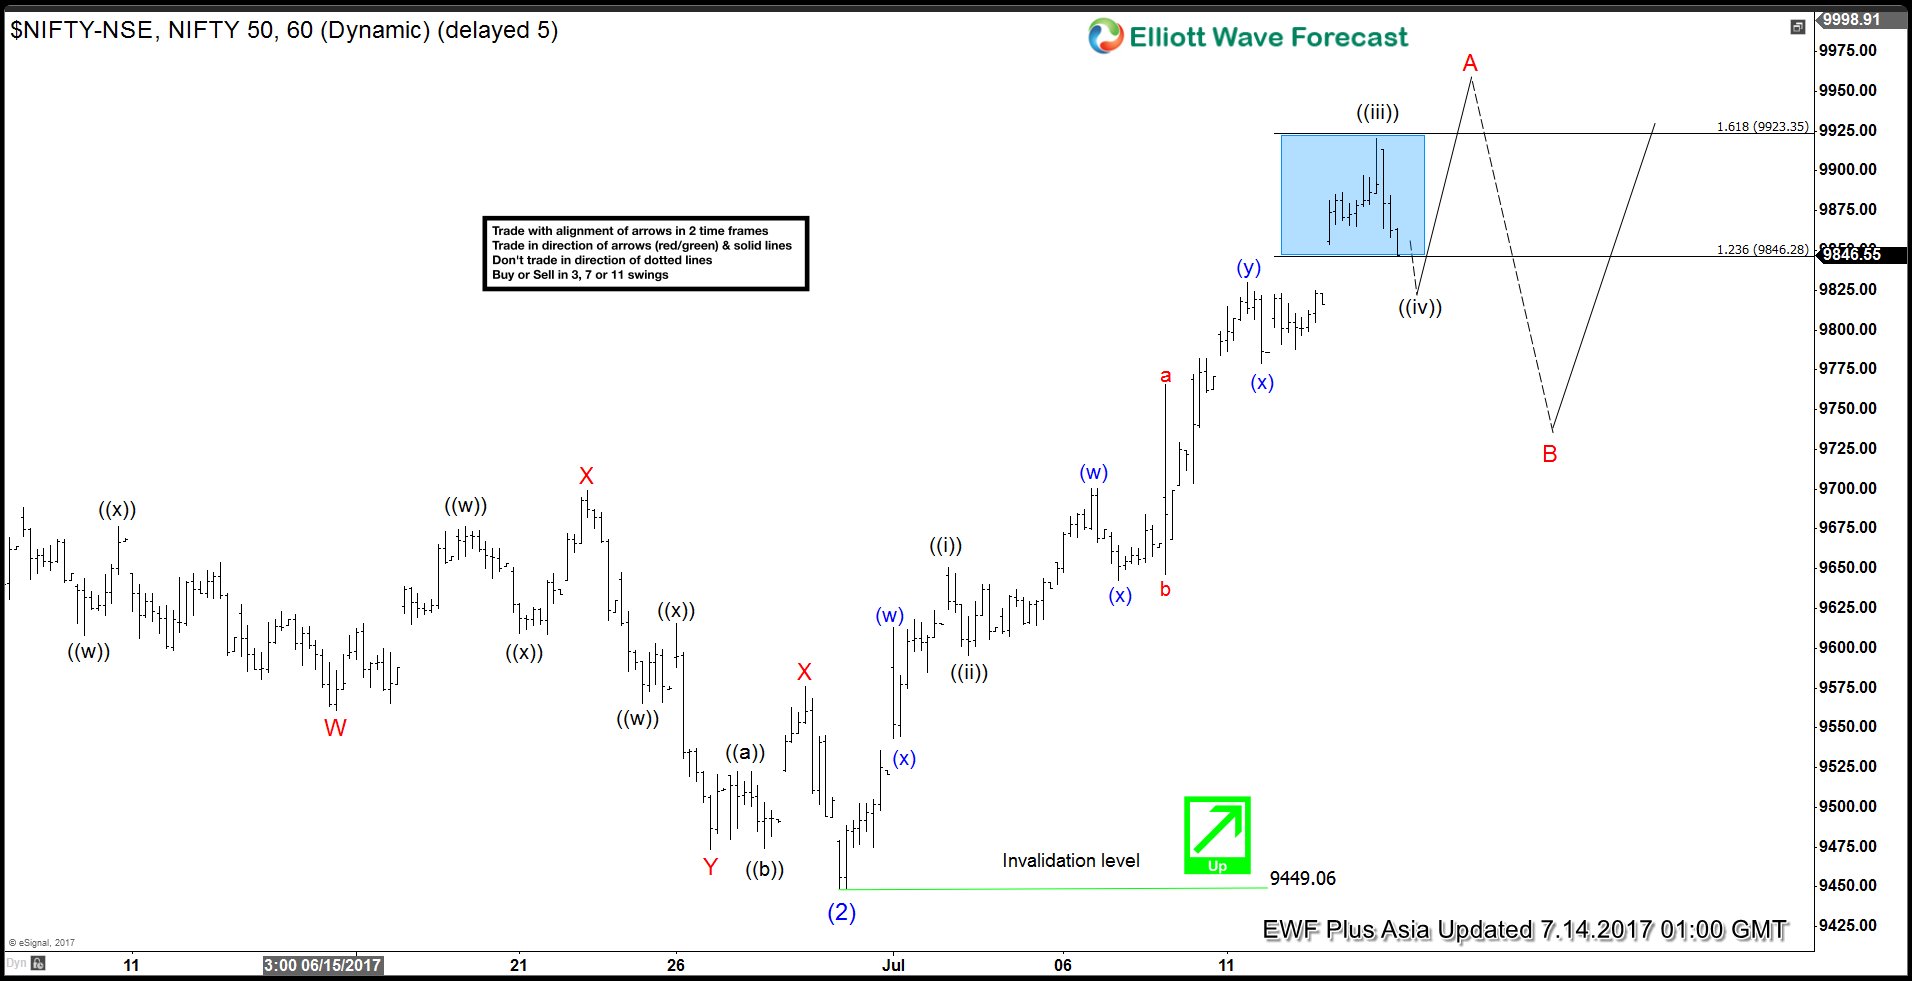
Nifty Elliott wave view 7.14.2017
Read MoreShort term NIFTY Elliott Wave view suggests the rally to 9709.3 ended Intermediate wave (1), and the pullback to 9449.06 low ended Intermediate wave (2). Rally from there could be unfolding as an Elliott wave Zigzag structure where Minor wave A is in progress as a Leading diagonal structure. Minute wave ((i)) ended as a double three Elliottwave structure at 9649.80 […]
-
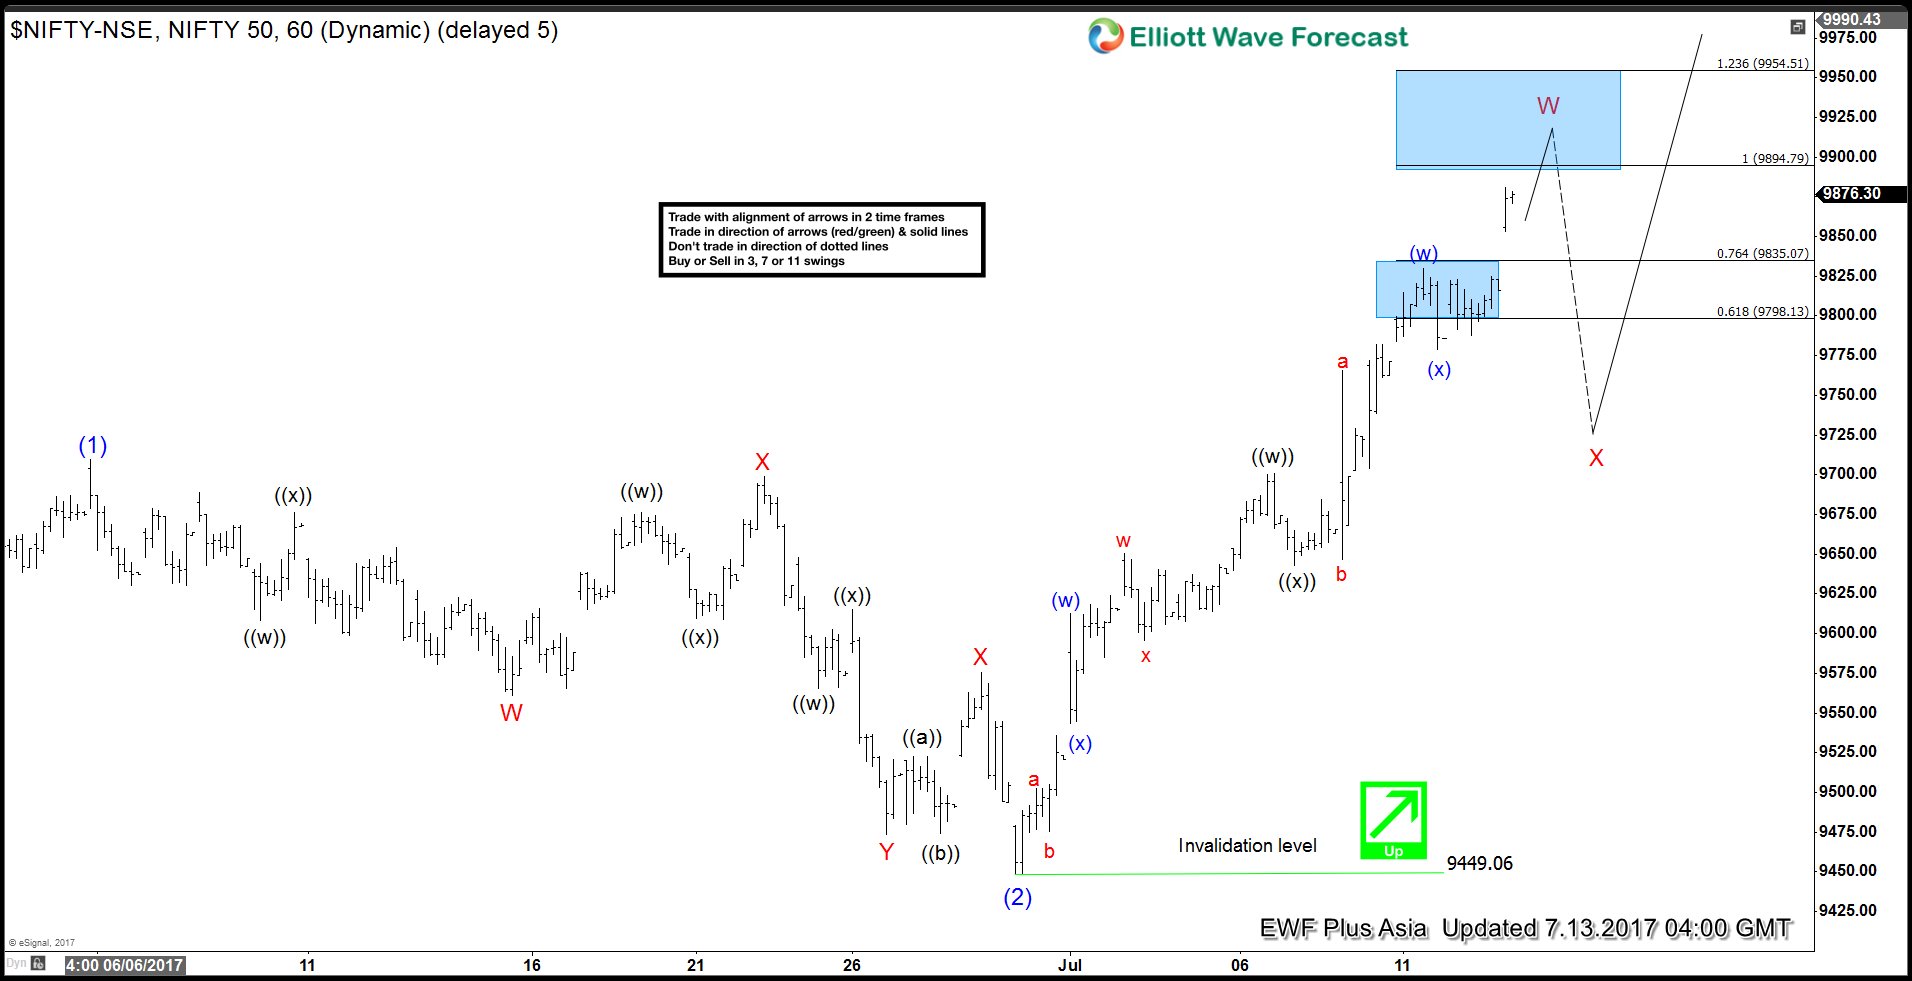
NIFTY Elliott Wave View: Resuming Higher
Read MoreShort term NIFTY Elliott Wave view suggests the rally to 9709.3 ended Intermediate wave (1), and the pullback to 9449.06 low ended Intermediate wave (2). Intermediate wave (3) is unfolding as an Elliott wave double three structure where Minor wave W of (3) is currently in progress towards 9894.8 – 9954.5. Up from 6/30 low at 9449.06, Minor […]
-
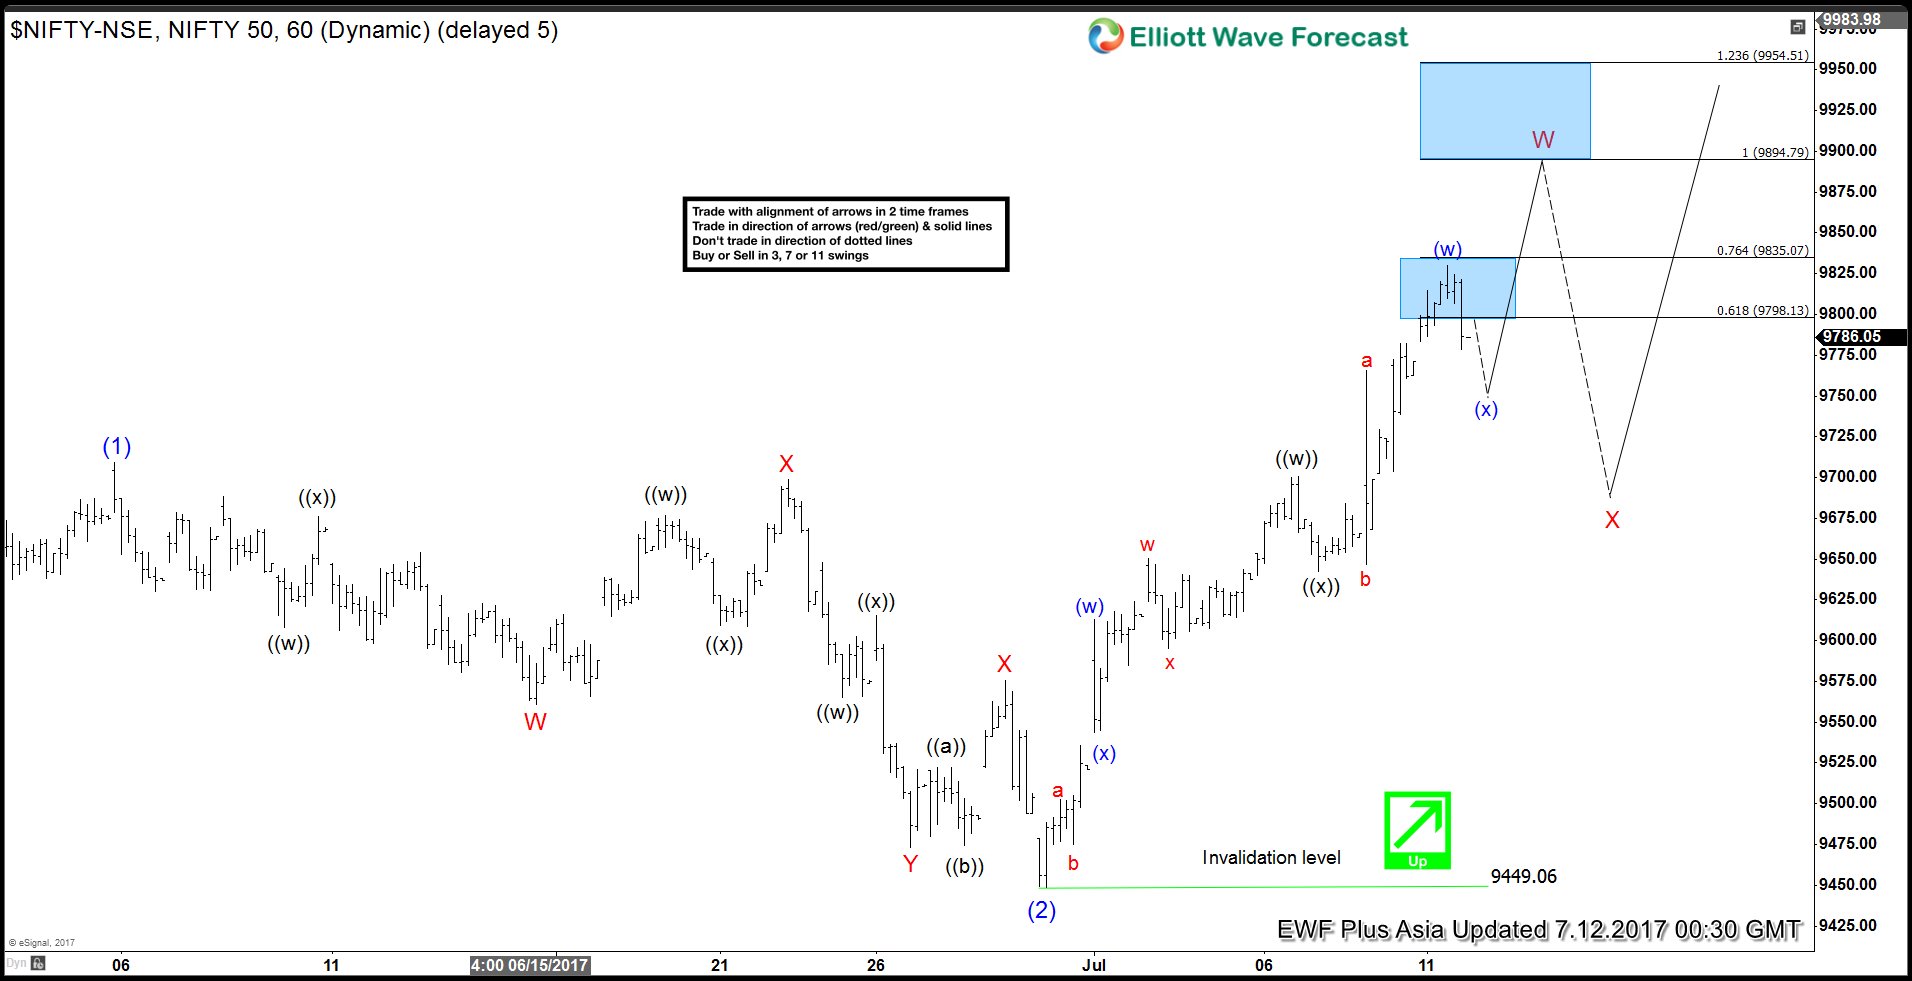
NIFTY Elliott Wave View: More Upside
Read MoreShort term NIFTY Elliott Wave view suggests the pullback to 9449.06 low on 6/30 ended Intermediate wave (2). Up from there, rally is unfolding as an Elliott wave double three structure where Minute wave ((w)) ended at 9700.7 and Minute wave ((x)) ended at 9642.65. Wave ((y)) is in progress also as a double three structure where Minutte wave (w) ended at […]
-
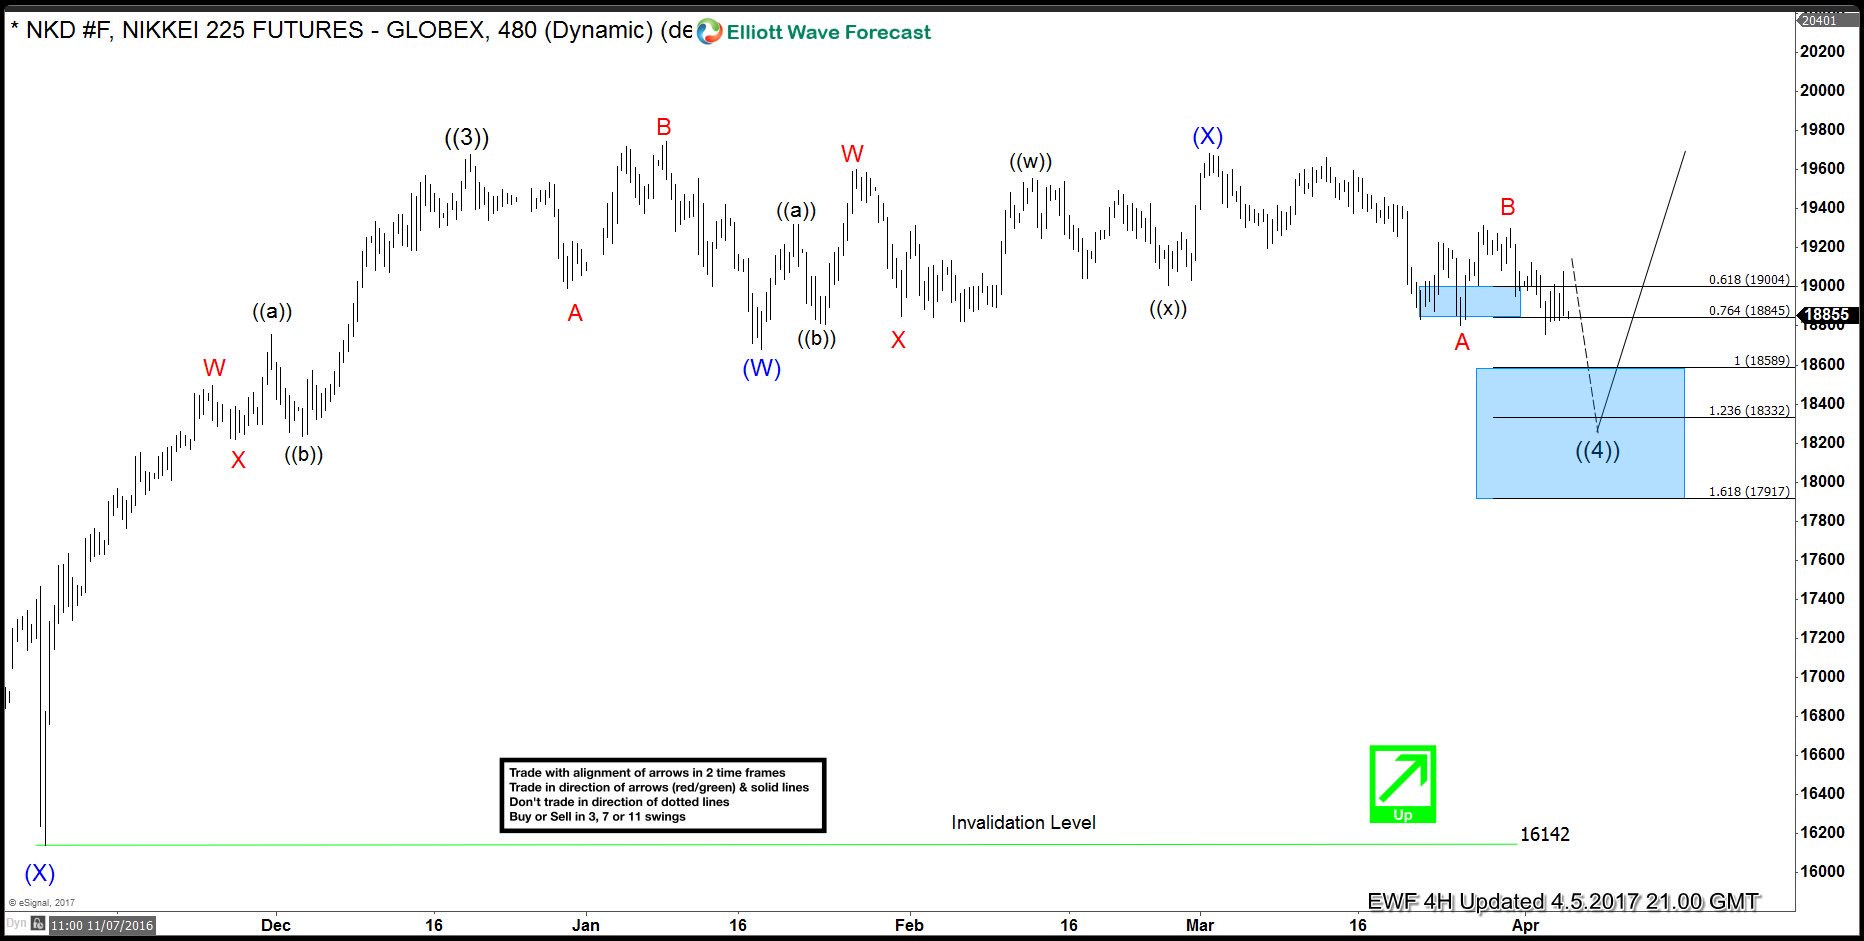
Nikkei (NKD #F) Forecasting the rally & buying the dips
Read MoreHello fellow traders. In this technical blog we’re going to take a quick look at the past Elliott Wave chart of Nikkei (NKD #F) published in members area of www.elliottwave-forecast.com. In further text we’re going to explain our view and the Elliott Wave count. Nikkei (NKD #F) Elliott Wave 4 Hour Chart 04.05.2017 As our members […]
-
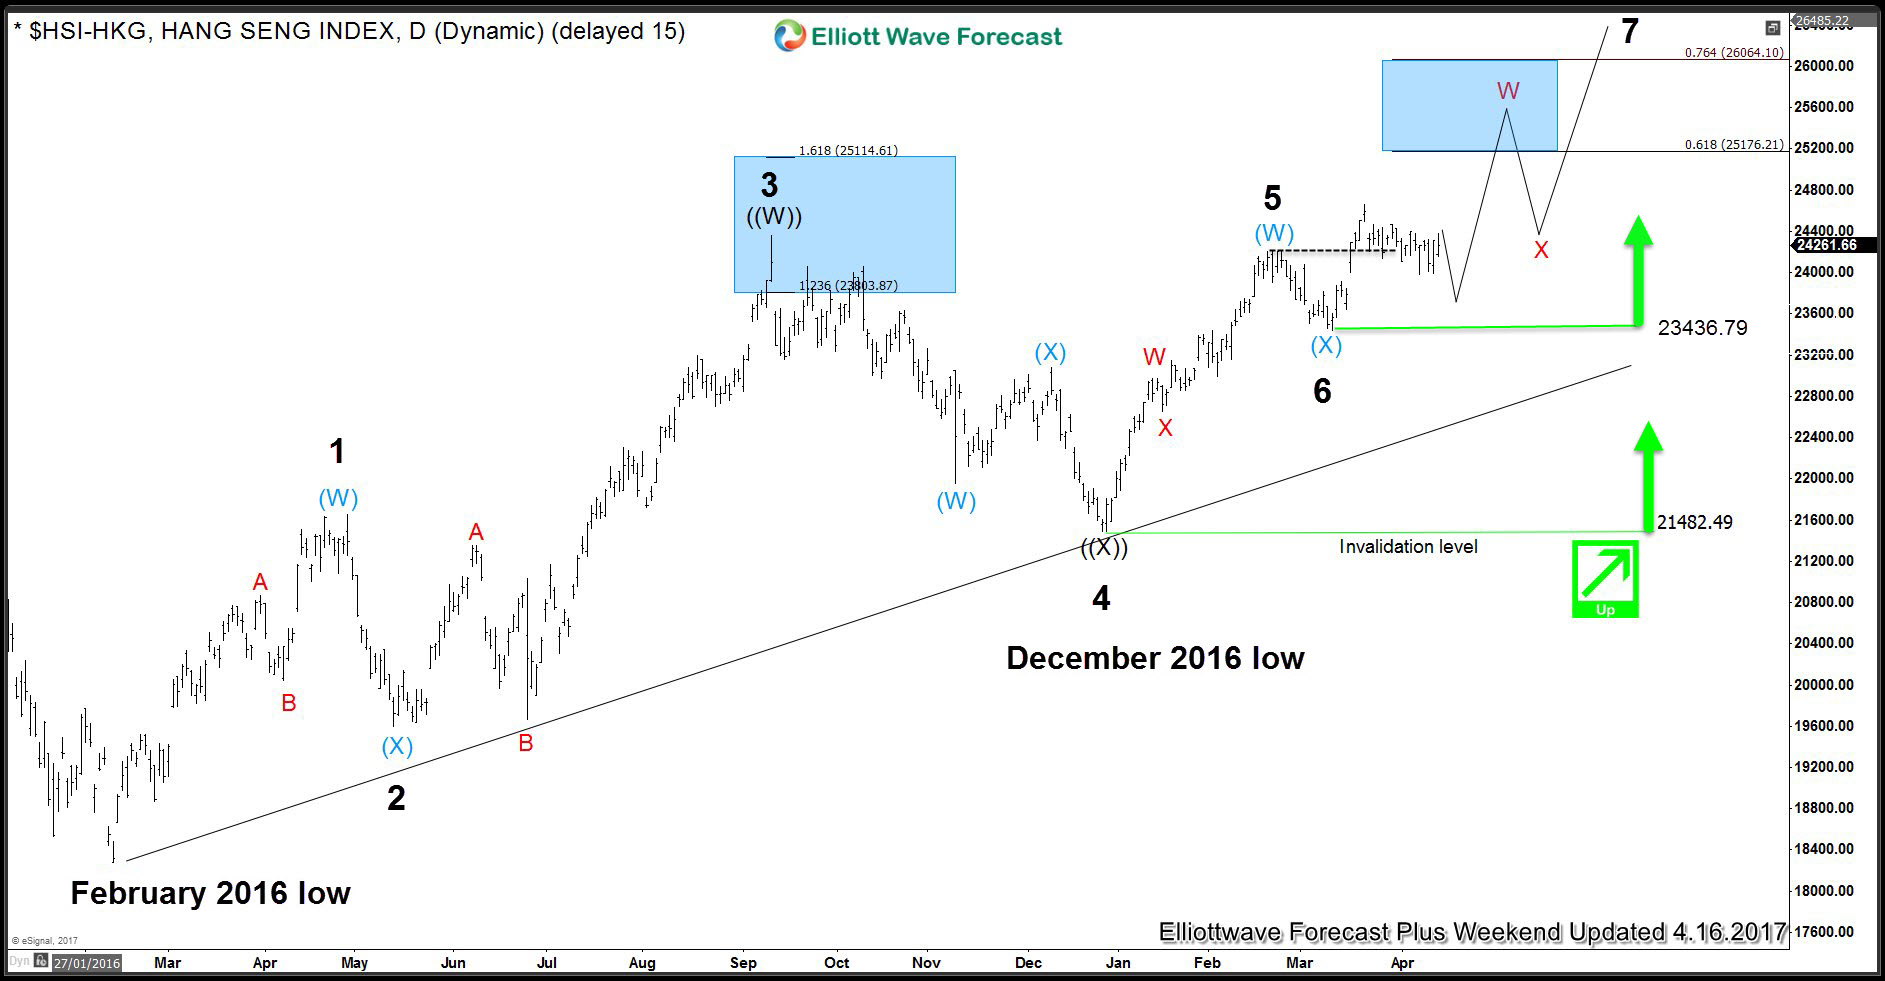
Hang Seng: Incomplete Elliott Wave Sequence
Read MoreHello fellow traders. In this technical blog we’re going to present the past Elliott Wave charts of Hang Seng ( $HSI-HKG ) published in members area of www.elliottwave-forecast.com . As our members know, we were pointing out that Hang Seng is having incomplete bullish swings sequences in the cycles from the February 12th and December […]