

The Power of 3-7-11 and the Grand Super Cycle: How We Saw the Bullish Turn in April 2025 Back on April 9, 2025, while World Indices were dropping sharply and global sentiment had turned overwhelmingly bearish, we published an article that challenged the fear-driven narrative. We explained why selling was not the right approach and […]
-
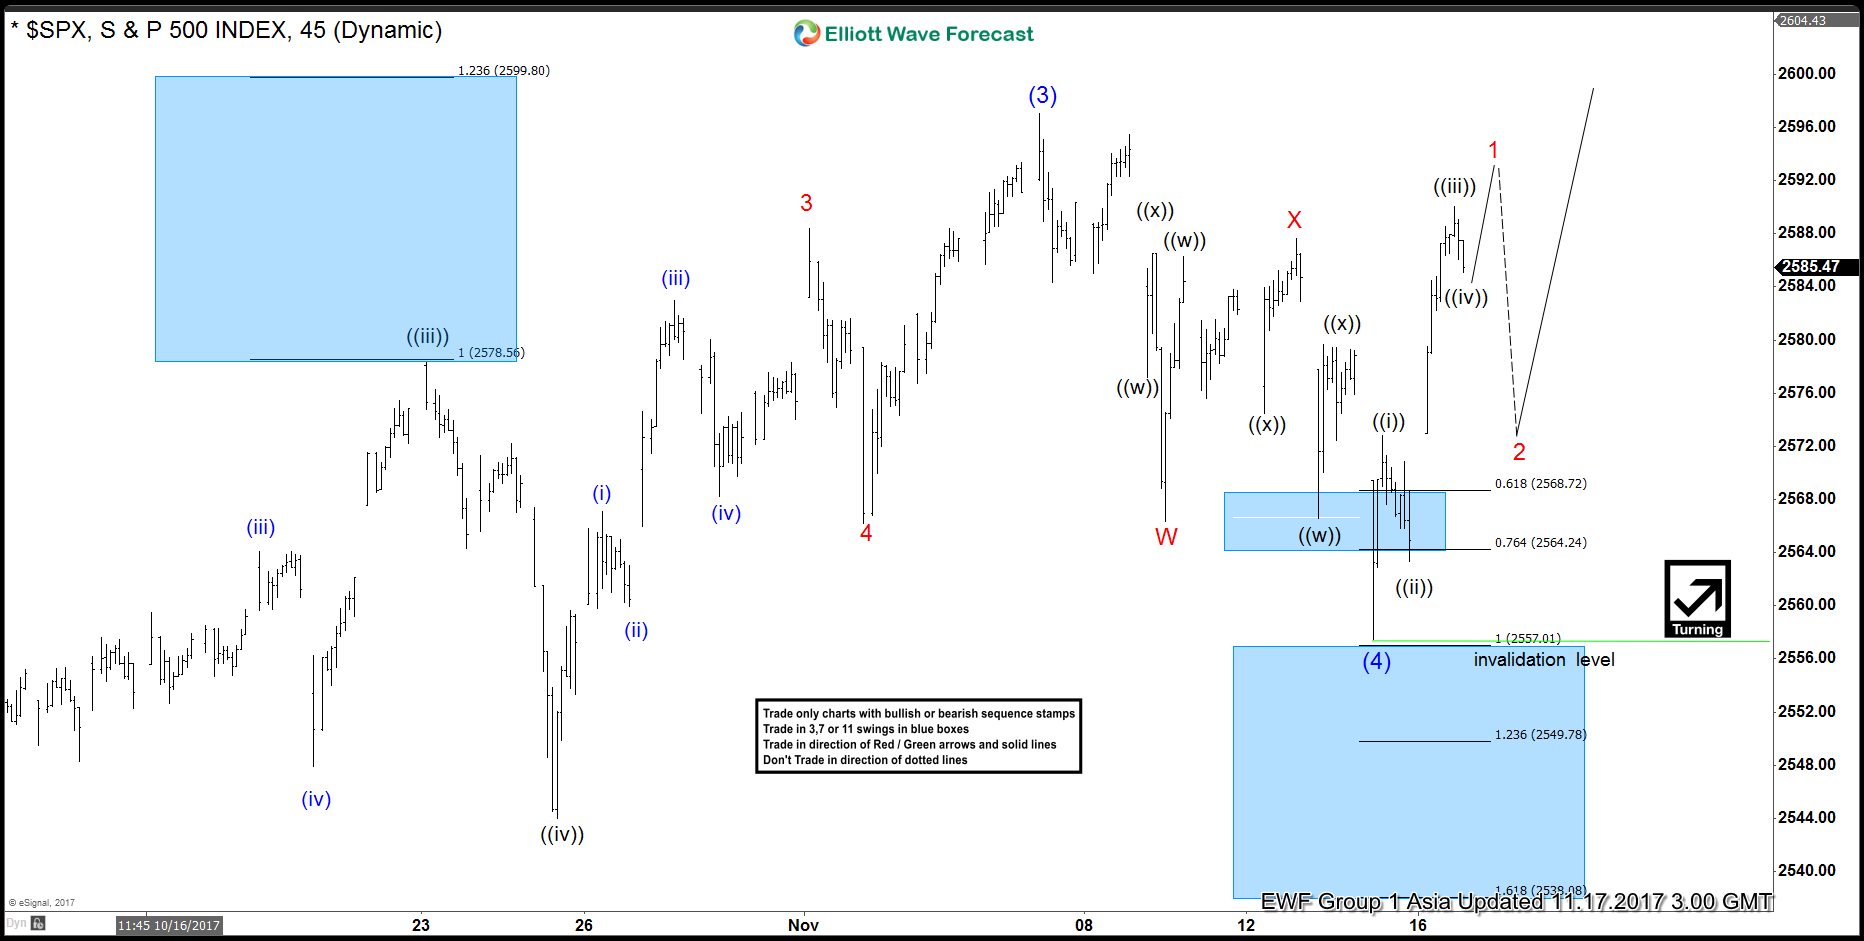
SPX Elliott Wave Analysis 11.17.2017
Read MoreSPX Short-Term Elliott Wave view suggests that the rally to 2597.02 ended Intermediate wave (3). Intermediate wave (4) pullback ended at 2557.45 as a double three Elliott Wave structure. Down from 2597.02, Minor wave W of (4) ended at 2566.33, Minor wave X of (4) ended at 2587.66, and Minor wave Y of (4) ended at […]
-
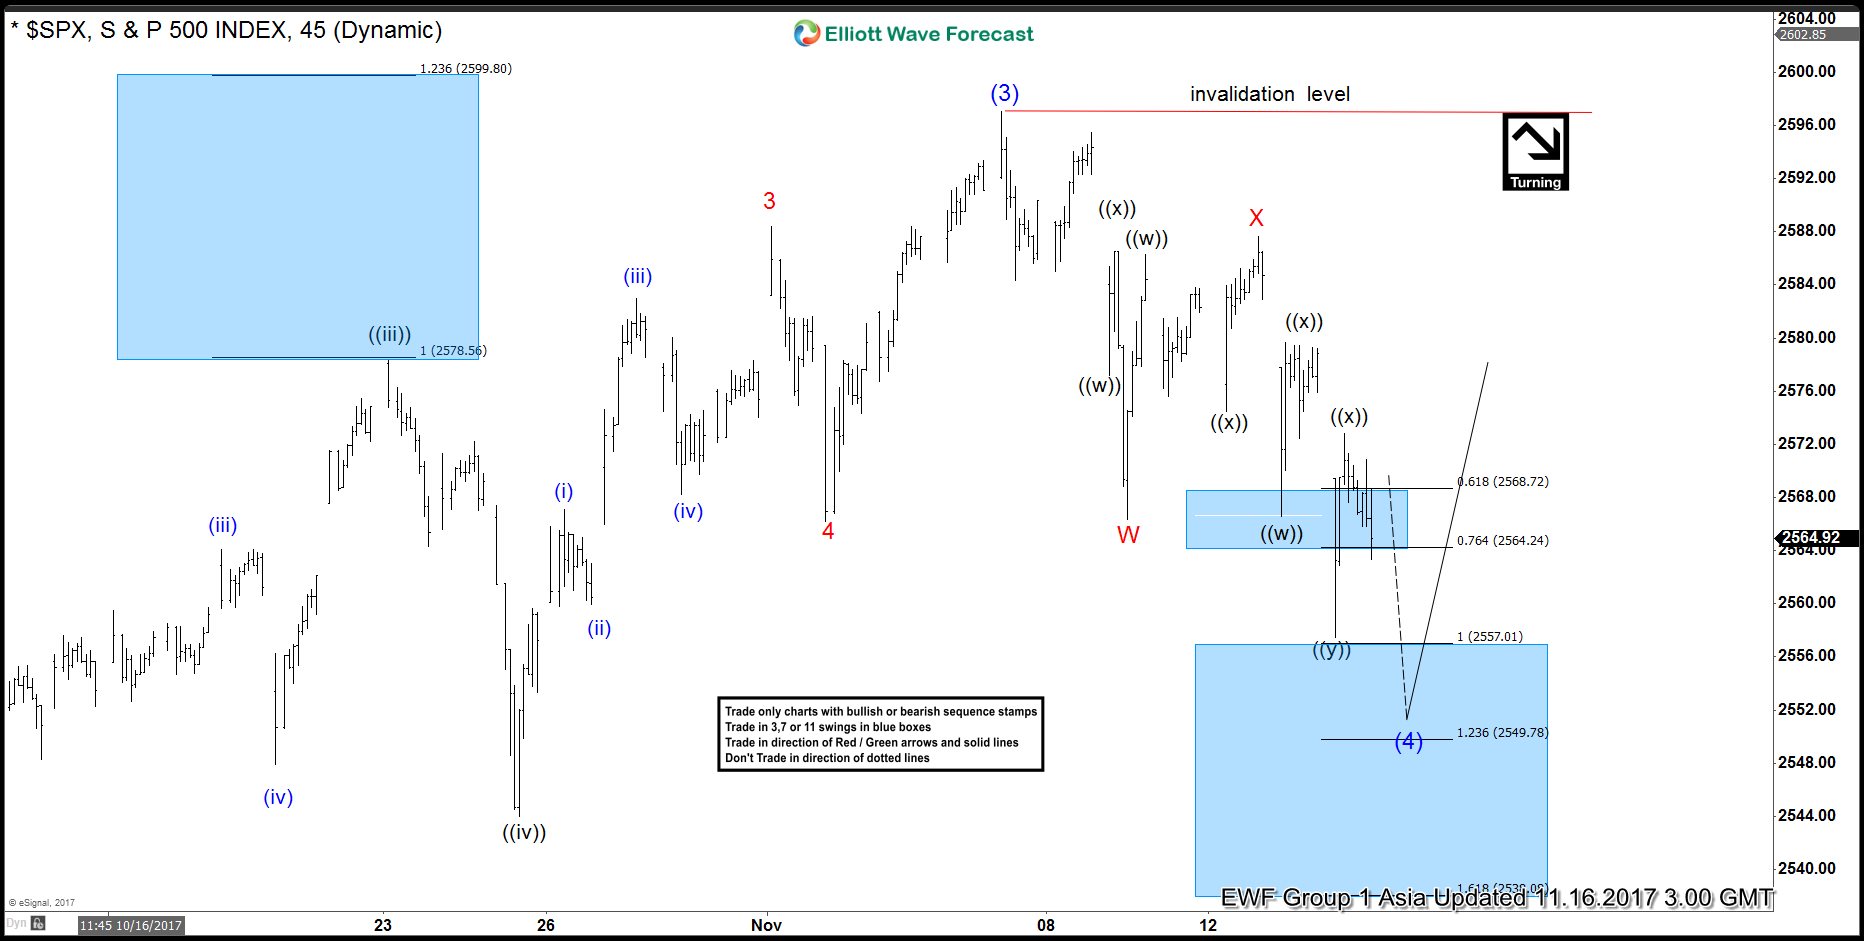
SPX Intra-Day Elliott Wave Analysis
Read MoreSPX Intra Day Elliott Wave view suggests that the rally to 2597.02 ended Intermediate wave (3). Intermediate wave (4) pullback is currently in progress as a double three Elliott Wave structure. Down from 2597.02, Minor wave W of (4) ended at 2566.33 and Minor wave X of (4) ended at 2587.66. While staying below 2597.02, expect […]
-
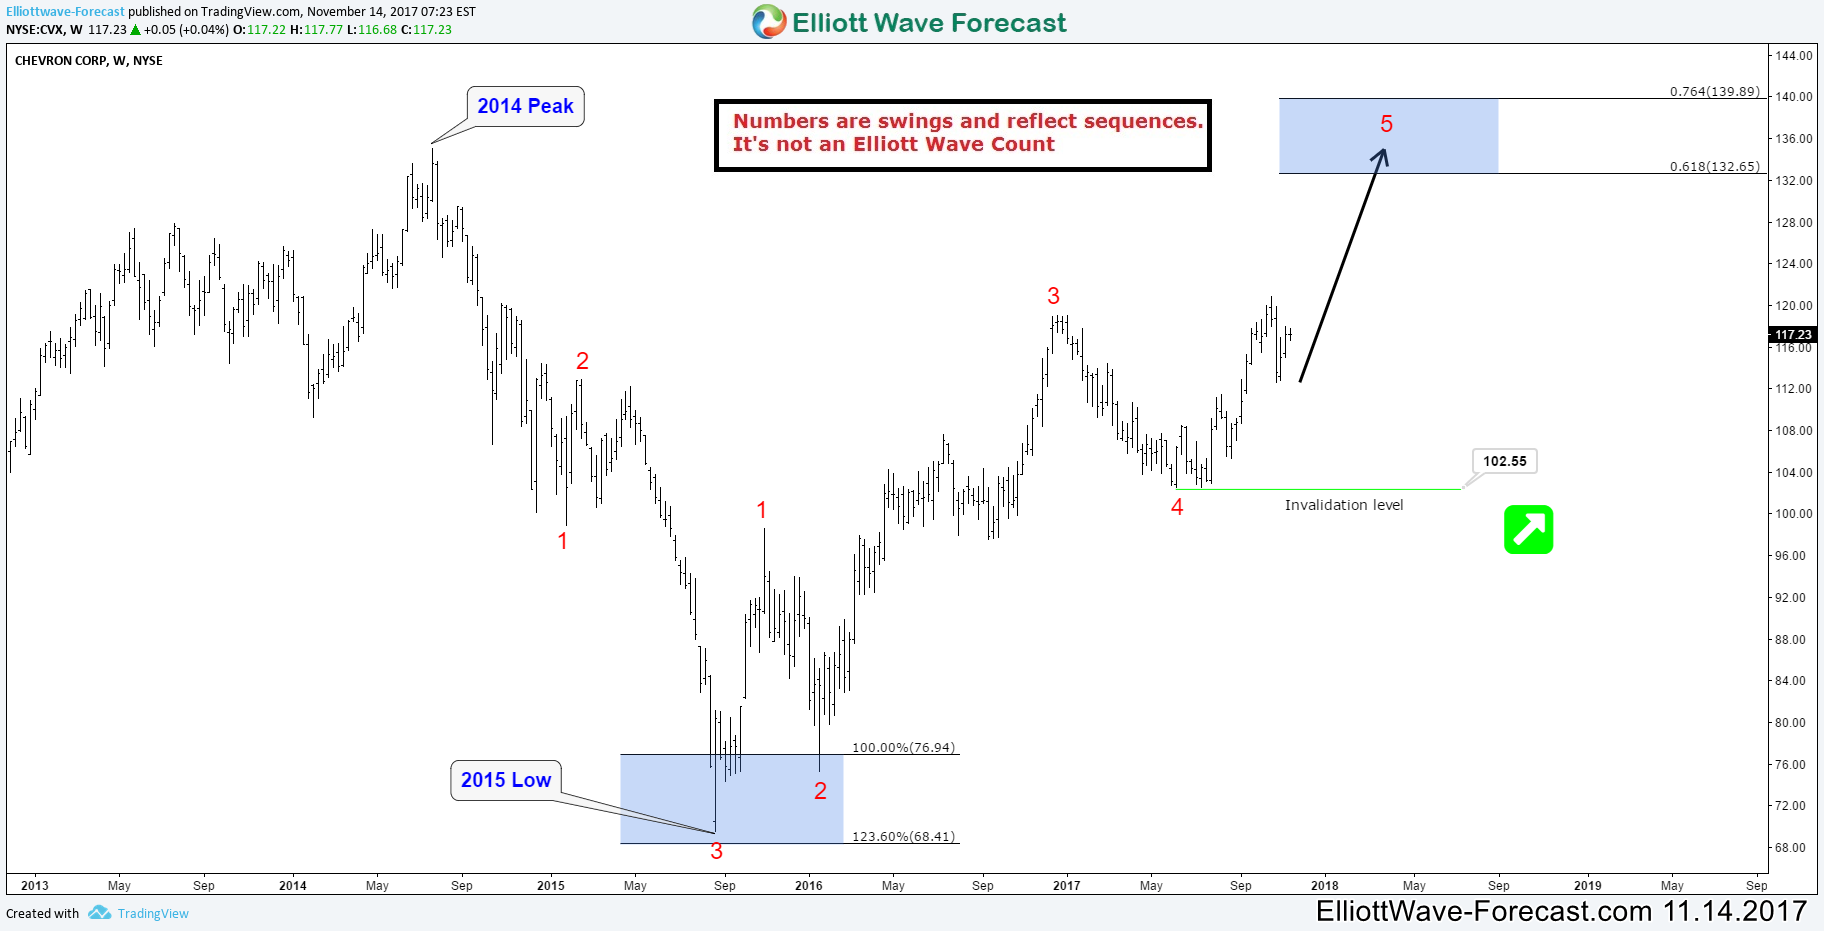
Chevron (CVX) Looking for New All Time Highs
Read MoreChevron Corporation (NYSE: CVX) is an American multinational energy corporation. It engages in integrated petroleum operations, chemicals operations, mining operations, power generation and energy services related to Oil and Natural Gas. Oil-company stocks tend to rise when oil prices goes higher, Chevron is no exception that’s why as Oil market is turning bullish after the recent break in price above […]
-
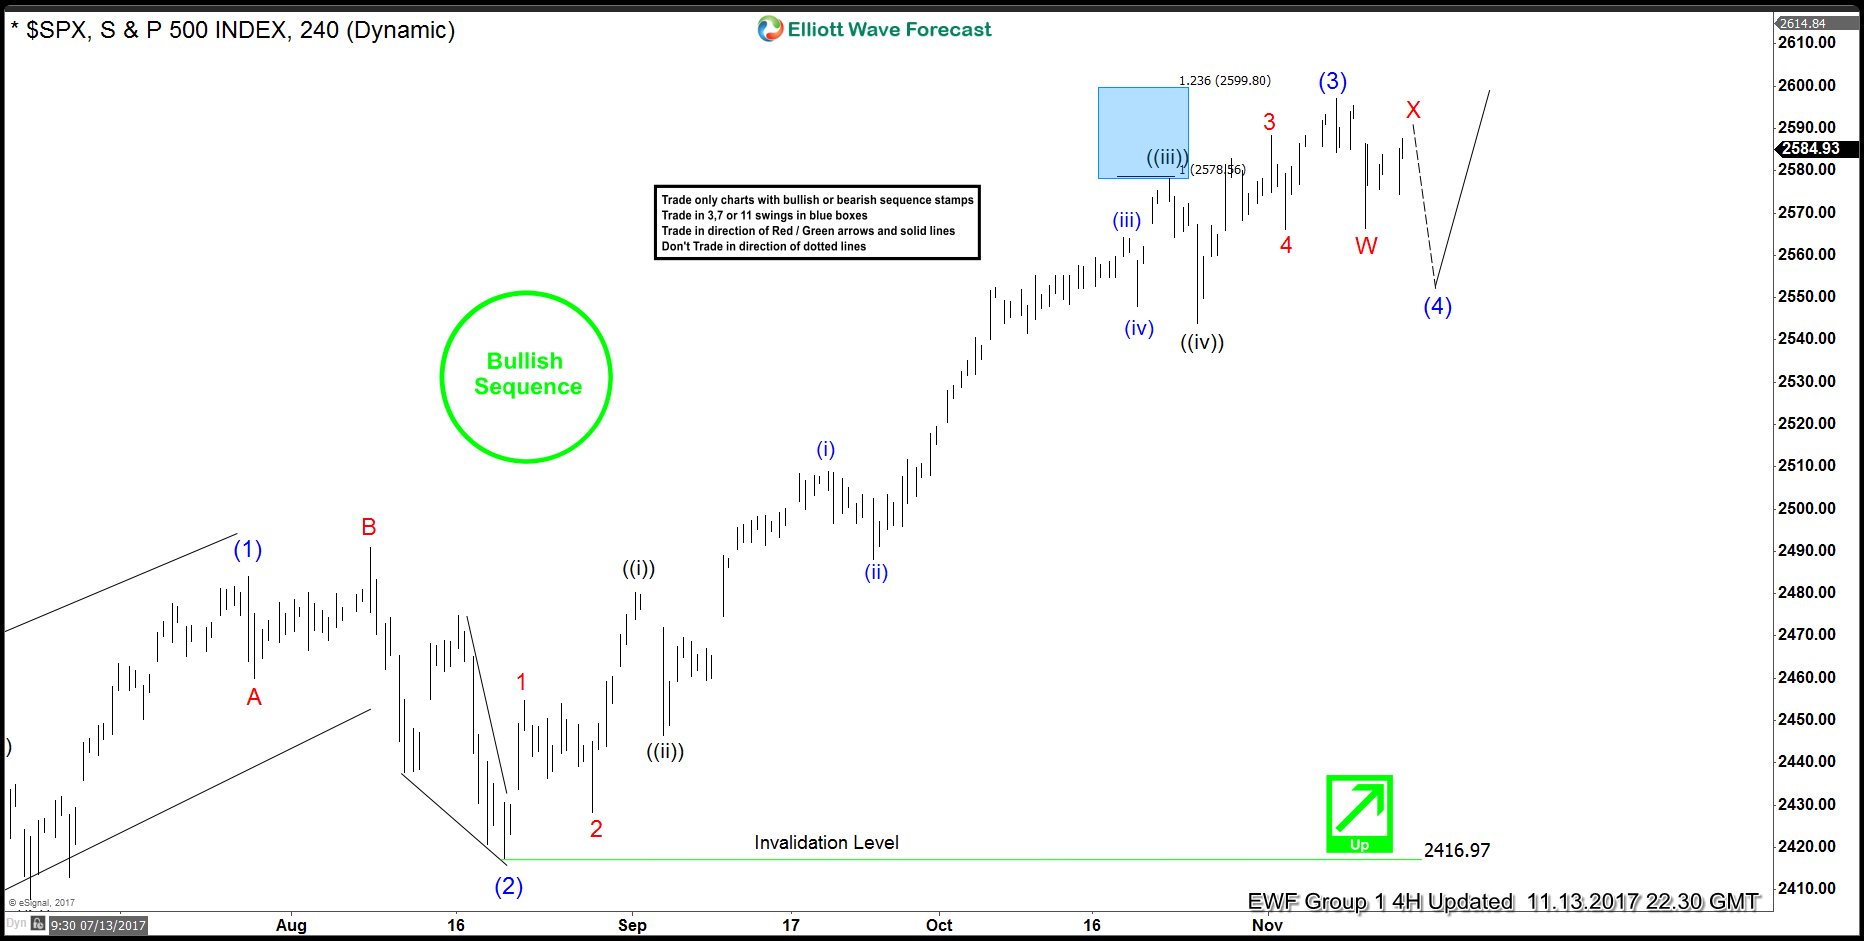
$SPX Bounce from the 8/21 lows is Impulsive
Read More$SPX Bounce from the 8/21 lows is Impulsive The $SPX Bounce from the 8/21 lows is impulsive and does display the usual characteristic traits of an Elliott Wave impulse. Looking back previously before this 8/21 date, the stock index is within an obvious uptrend in multiple degrees. In this we are mainly focused upon this particular time frame […]
-
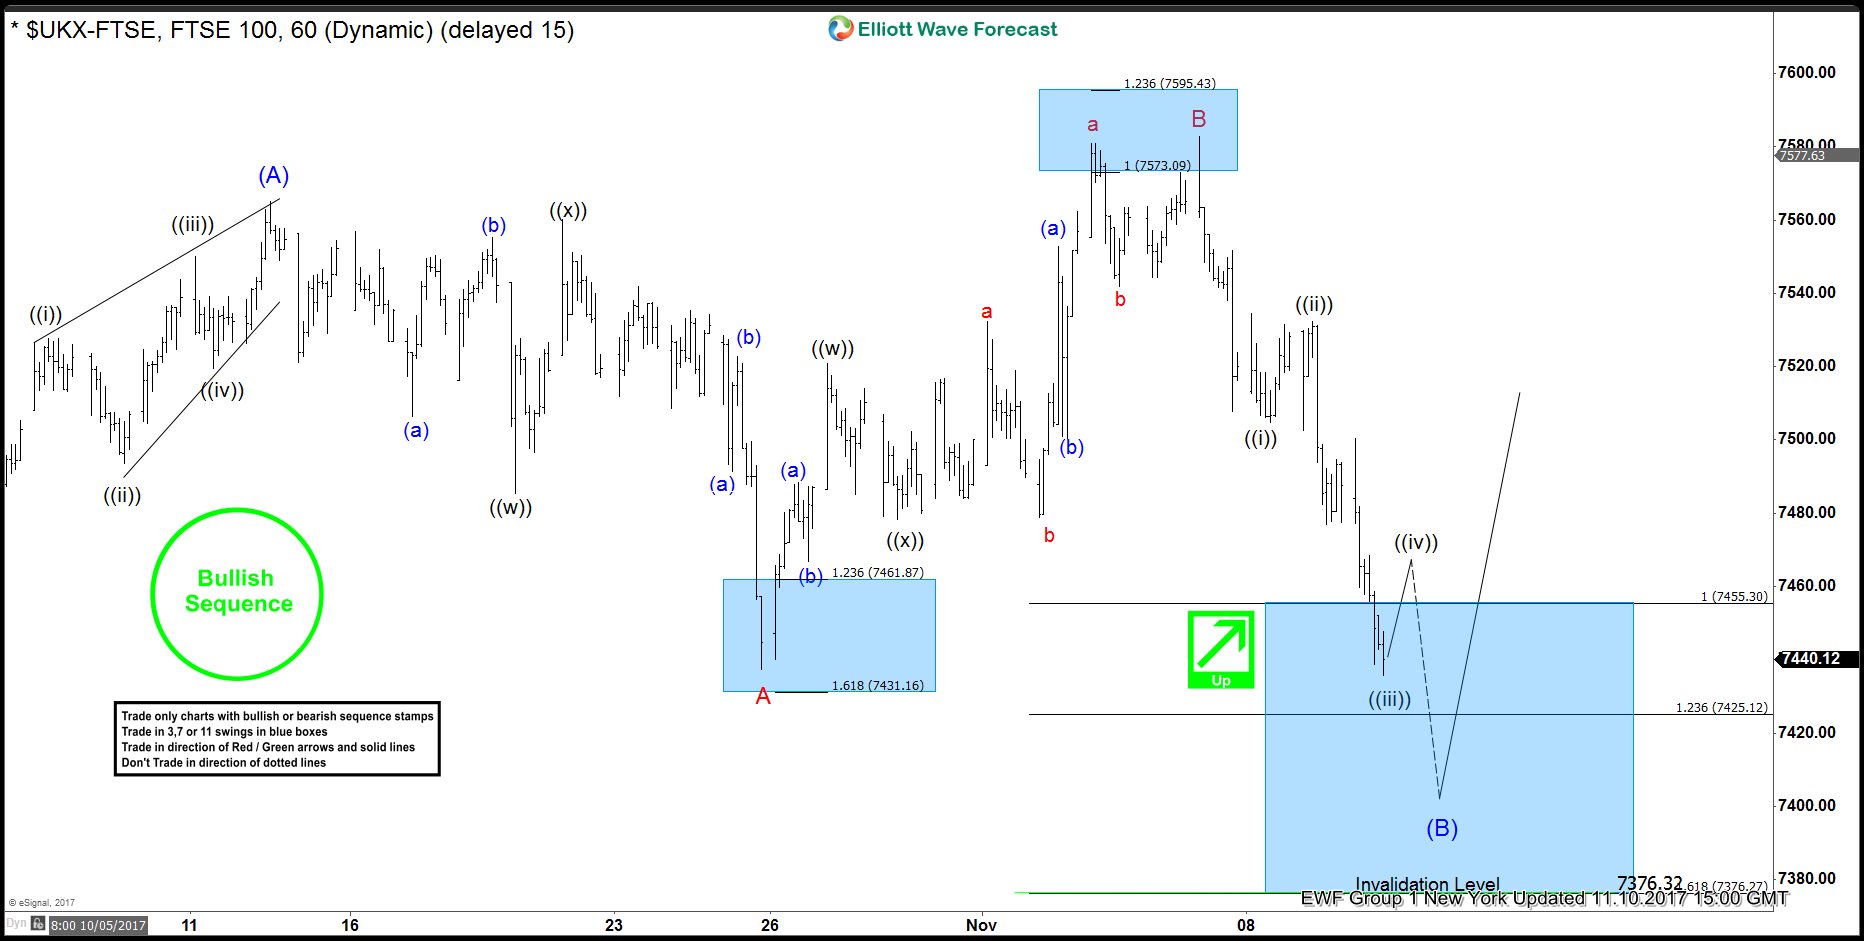
FTSE Elliott Wave Analysis 11.10.2017
Read MoreFTSE Elliott Wave view suggests that the decline to 7199.5 ended Primary wave ((4)). Up from there, the rally is unfolding as a zigzag Elliott Wave structure where Intermediate wave (A) ended at 7565.11 on 10/12 peak. A rally to intermediate wave (A) is subdivided as an impulse Elliott Wave structure. Minor wave 1 ended at […]
-
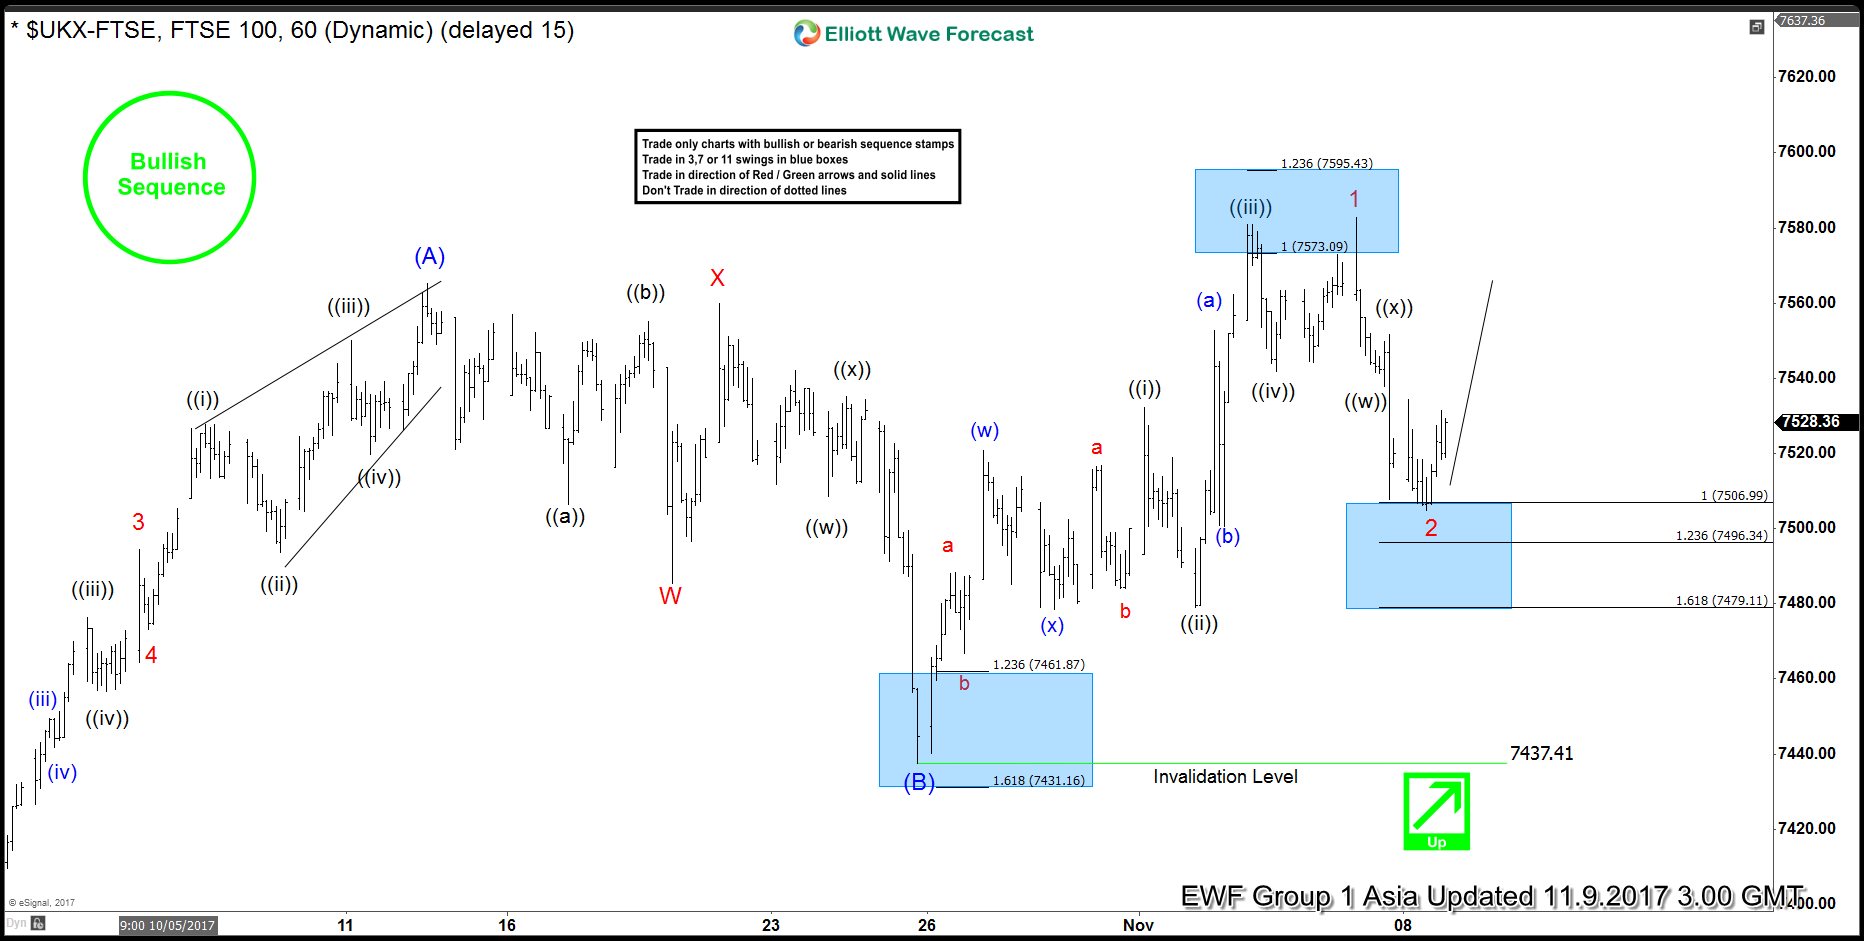
FTSE Intra-Day Elliott Wave Analysis
Read MoreShort term FTSE Elliott Wave view shows Primary wave ((4)) ended with the decline to 7199.5. The rally from there is unfolding as a zigzag Elliott Wave structure where Intermediate wave (A) ended at 7565.11 and Intermediate wave (B) ended at 7437.42. Intermediate wave (A) has an internal subdivision of an impulse Elliott Wave structure. Minor wave 1 […]