

The Power of 3-7-11 and the Grand Super Cycle: How We Saw the Bullish Turn in April 2025 Back on April 9, 2025, while World Indices were dropping sharply and global sentiment had turned overwhelmingly bearish, we published an article that challenged the fear-driven narrative. We explained why selling was not the right approach and […]
-
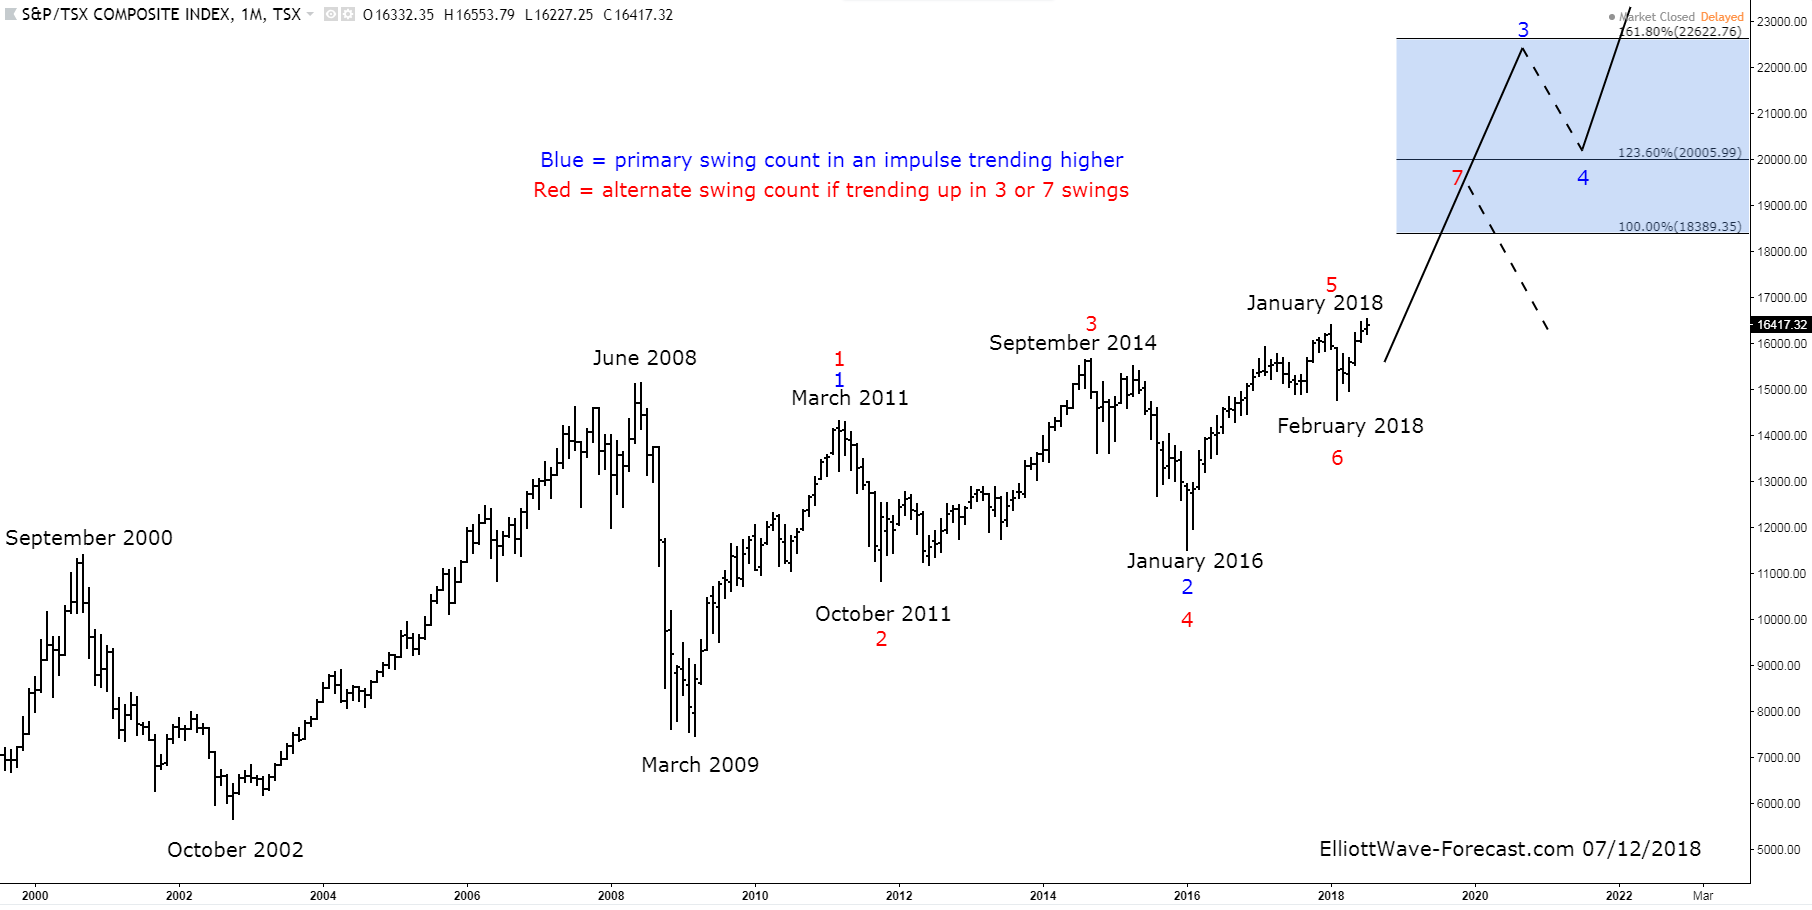
The S&P/TSX Composite Index Long Term Bullish Trend & Cycles
Read MoreThe S&P/TSX Composite Index Long Term Bullish Trend & Cycles The S&P/TSX Composite Index has been trending higher with other world indices. As far back as one can find data, the cycles have shown a bullish trend. From early years not seen on this chart it rallied with other world indices trending higher into the June 2008 […]
-
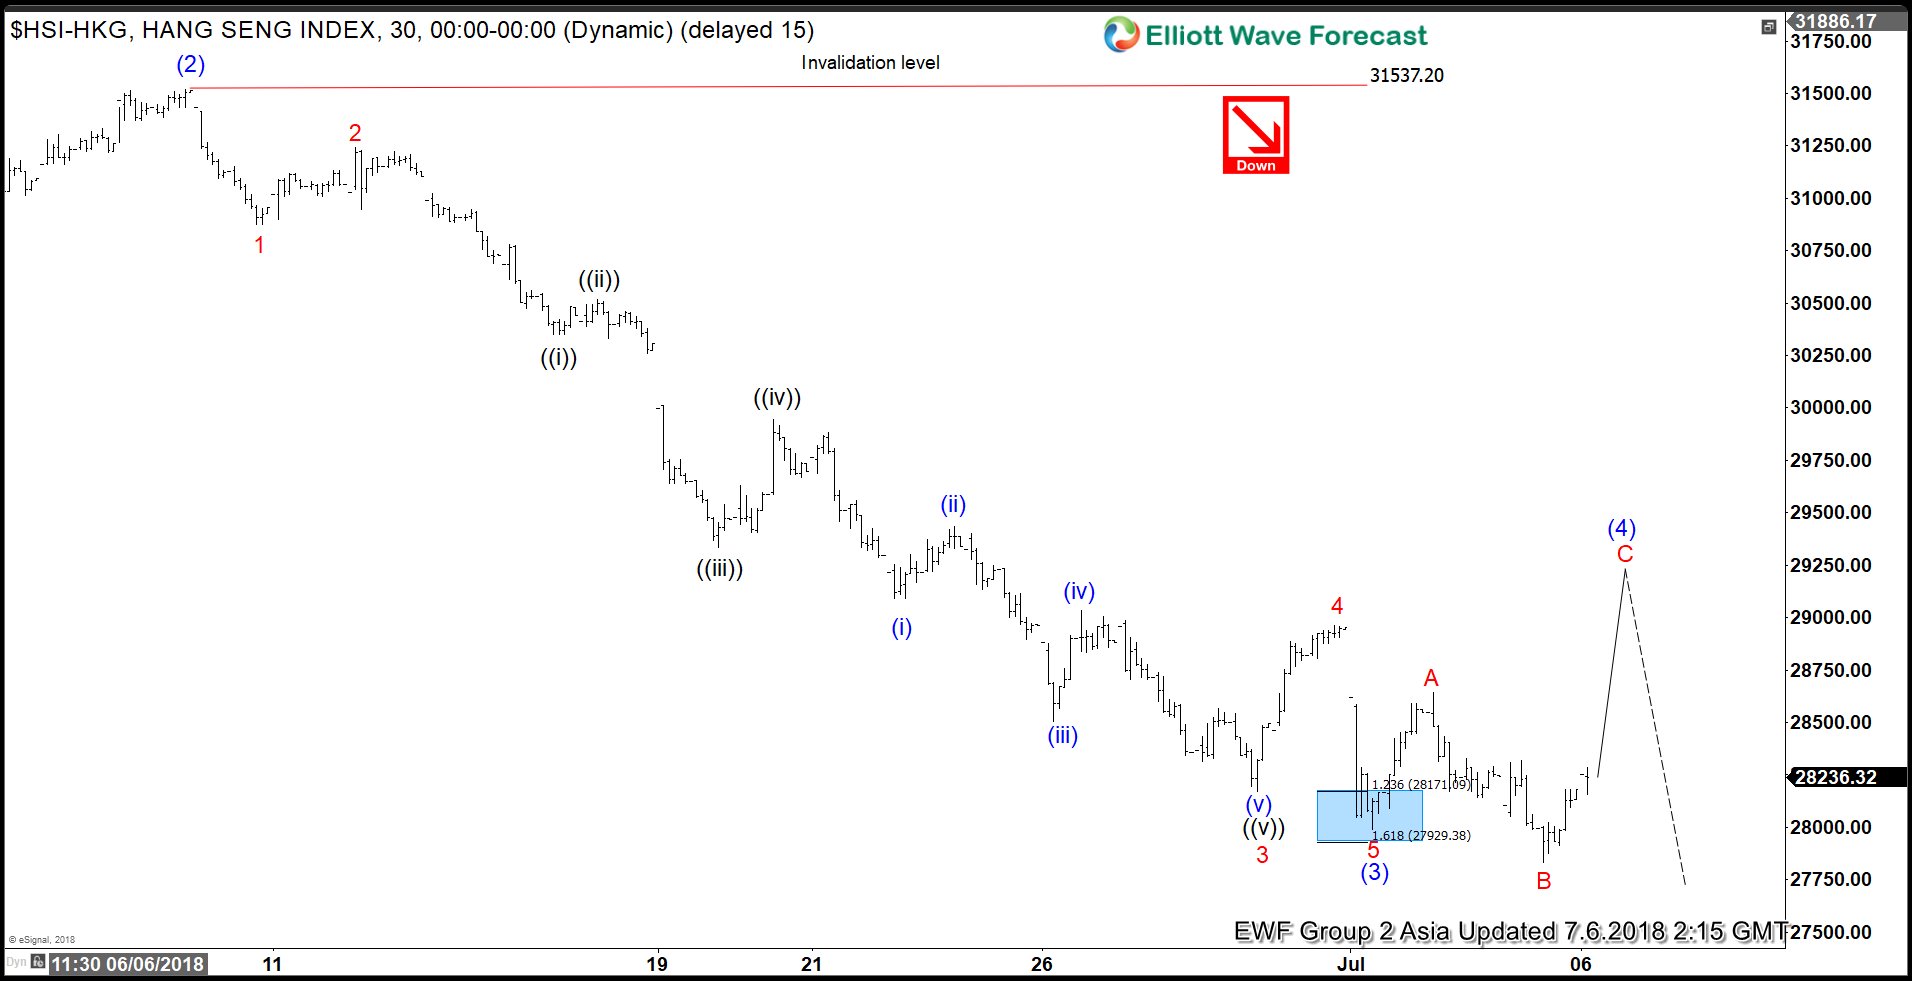
Hang Seng Elliott Wave Analysis: Correction Happening
Read MoreHang Seng short-term Elliott wave view suggests that the rally to 31521.13 high on 6/07/2018 peak ended Intermediate wave (2). Down from there, the decline to 27990.45 low is proposed to have completed Intermediate wave (3). The internals of Intermediate wave (3) unfolded as Elliott Wave Impulse structure with extension. This suggests the sub-division of […]
-
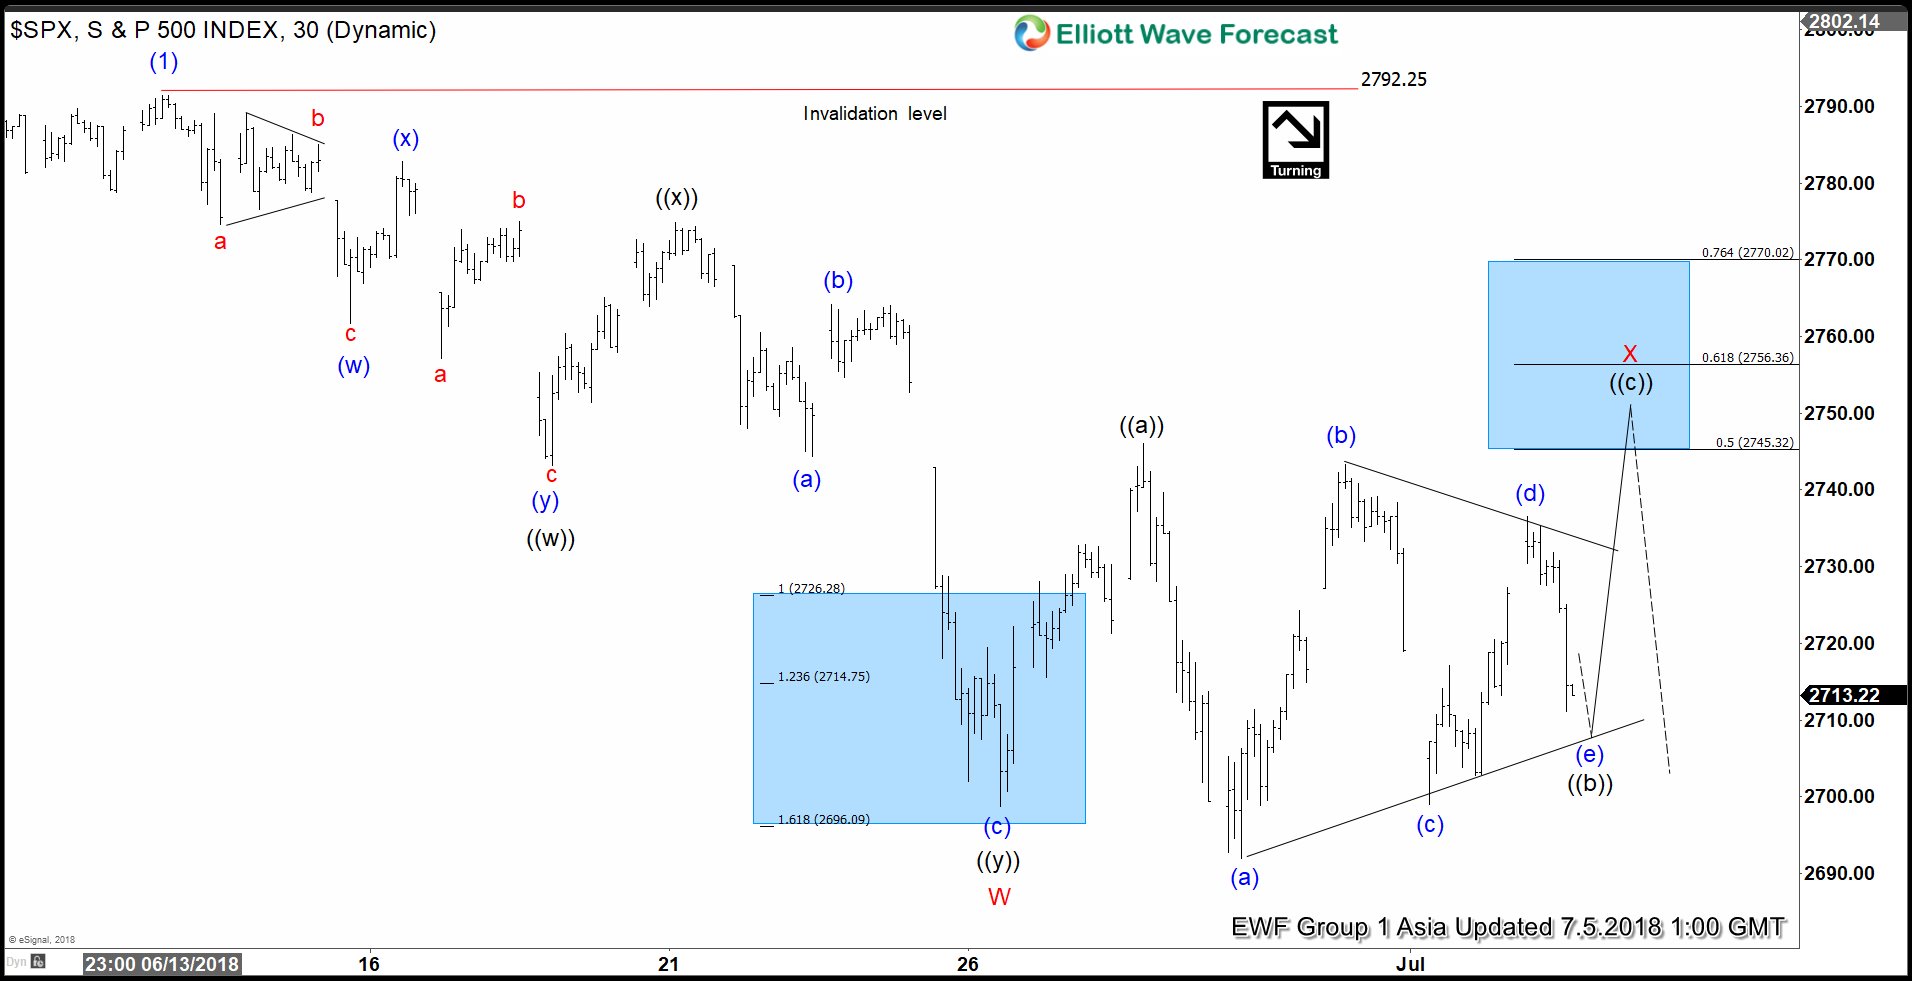
SPX Elliott Wave Analysis: Calling Correction Lower
Read MoreSPX short-term Elliott wave analysis suggests that the rally from 4/02/2018 low to $2792.25 ended the intermediate wave (1). Down from there, correction against that cycle remains in progress in 3, 7 or 11 swing structure. Also, it’s important to note here that the decline from $2792.25 peak shows an overlapping price action thus suggesting that […]
-
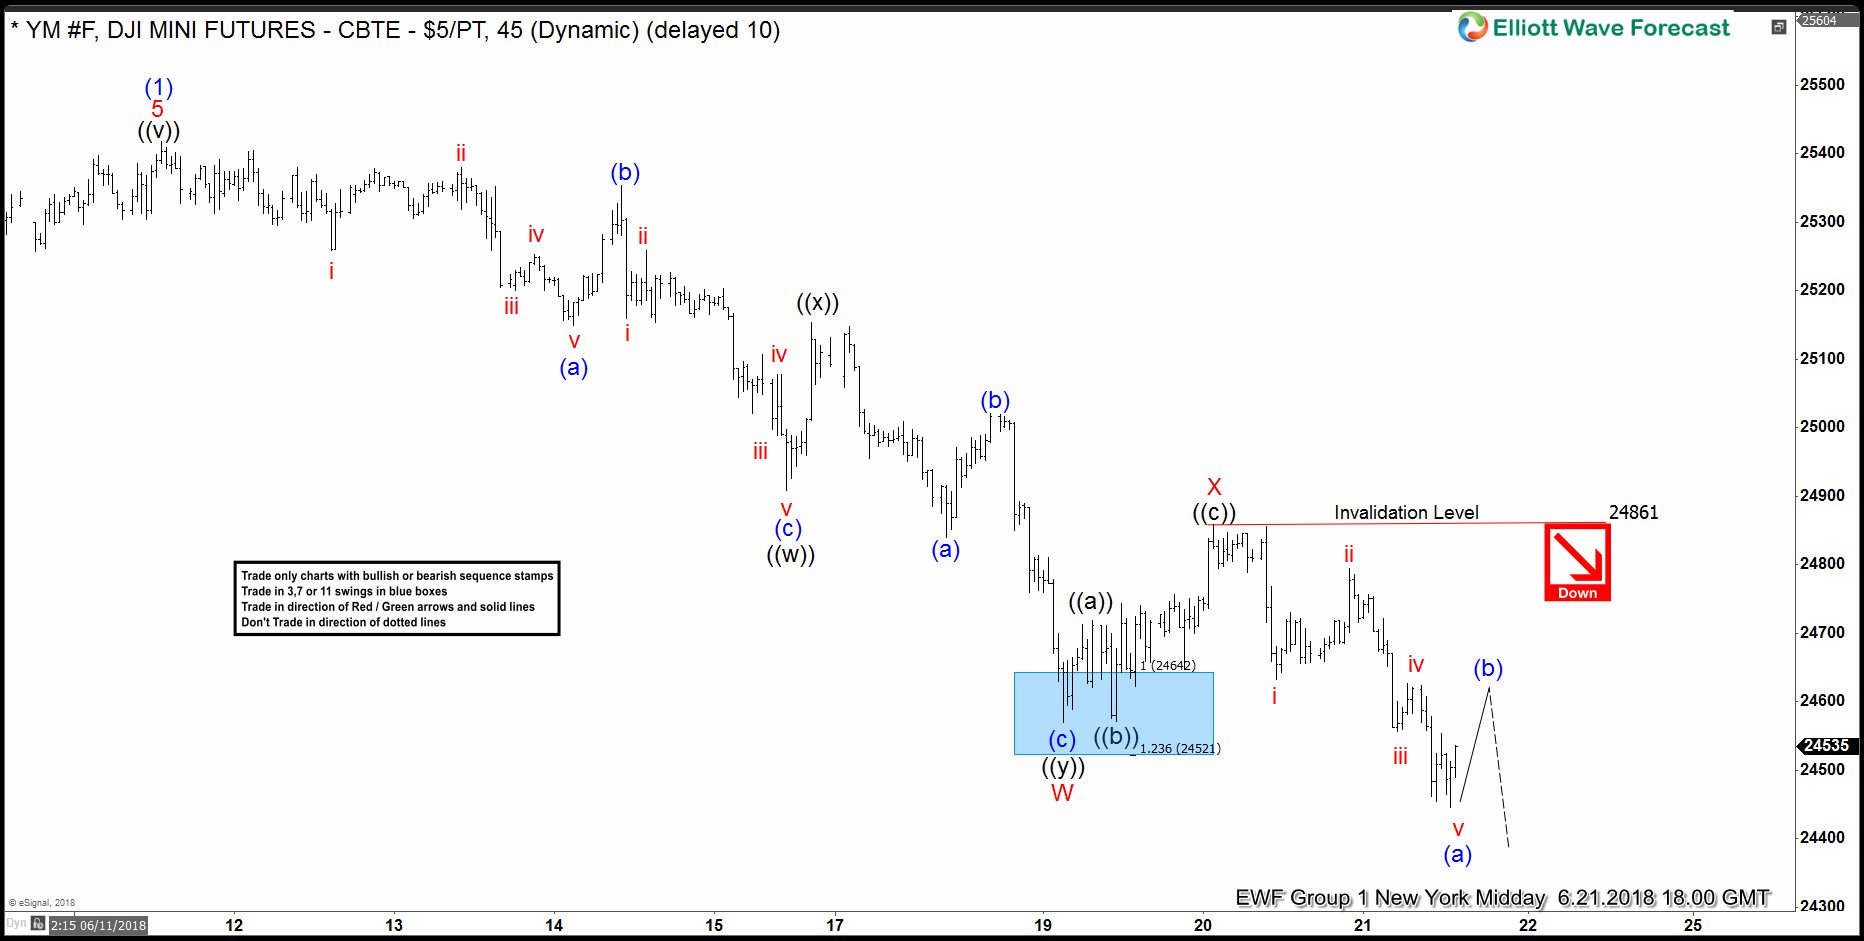
Dow Jones Elliott Wave Analysis: Tracking Recent Price Action
Read MoreToday, we will have a look at some Elliott Wave charts of the Dow Jones Futures which we presented to our members in the past. Below, you can find our 1-hour updated chart presented to our members on the 06/20/18 calling for more downside after a 3 waves correction in black wave ((a))-((b)). Dow Jones Future […]
-
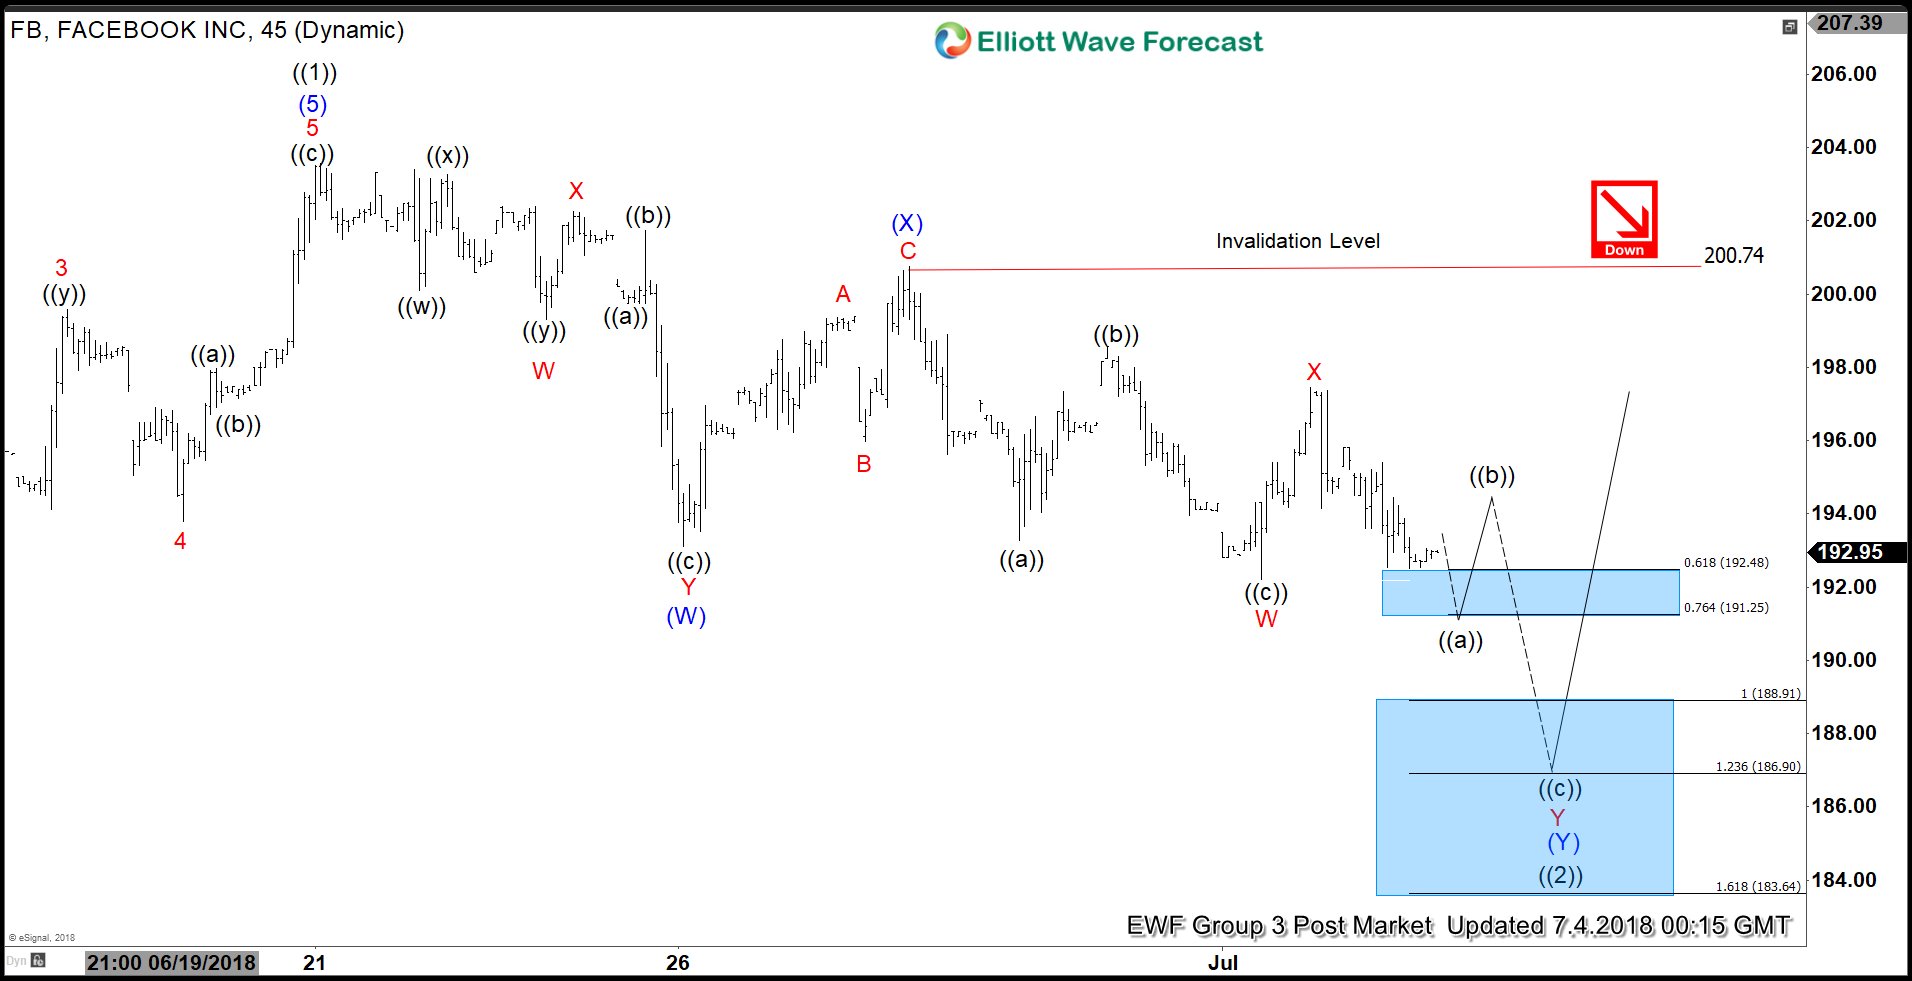
Facebook ($FB) Elliott Wave Analysis: Pullback Remains In-progress
Read MoreFacebook ticker symbol: $FB short-term Elliott wave analysis suggests that the rally to $203.55 ended primary wave ((1)). Down from there, the pullback in primary wave ((2)) remains in progress in 3, 7 or 11 swings to correct cycle from 3/26/2018 low. The internals of that pullback shows an overlapping structure thus suggesting that the […]
-
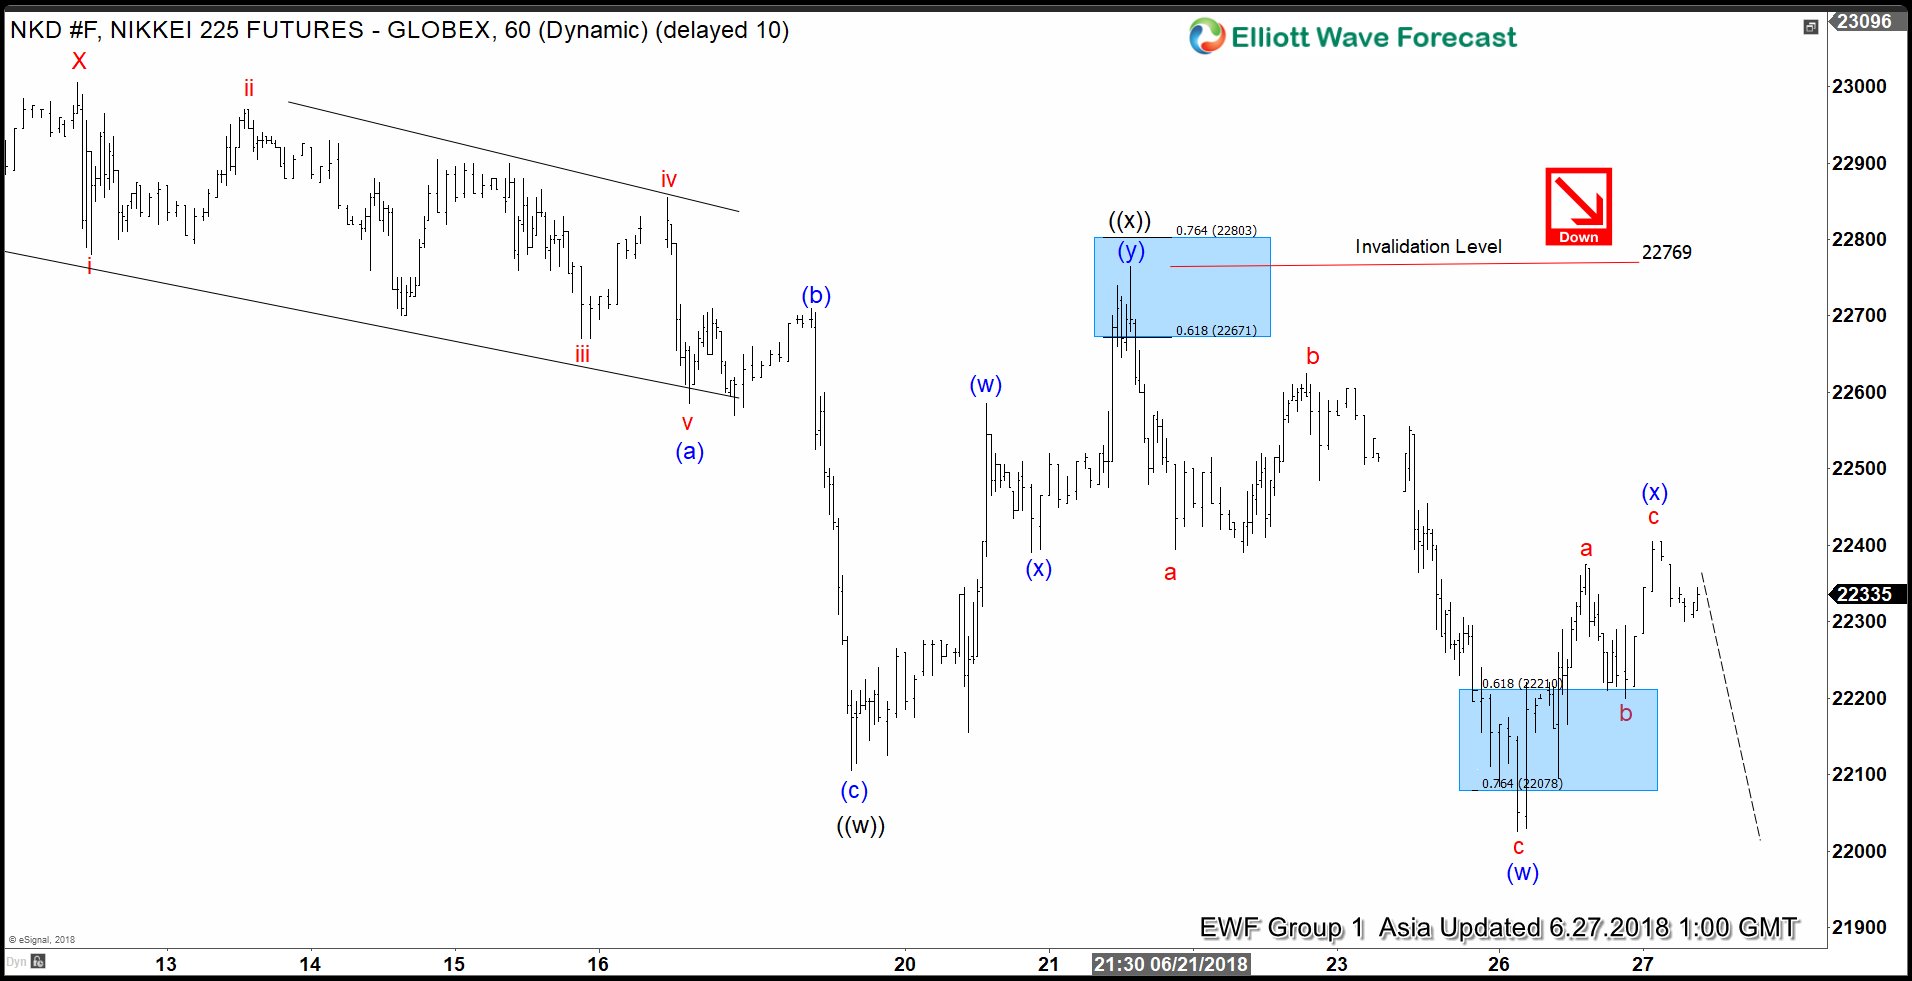
Nikkei How Far Elliott Wave Correction Can Take Place?
Read MoreNikkei short-term Elliott Wave view suggests that the index is correcting the cycle from 3/23/2018 low (20190) in 3, 7 or 11 swings. Rally to 23005 high ended Minor wave X of a possible double correction lower. Down from there, Minor wave Y remains in progress with lesser degree cycle showing another double correction structure. Below […]