

The Power of 3-7-11 and the Grand Super Cycle: How We Saw the Bullish Turn in April 2025 Back on April 9, 2025, while World Indices were dropping sharply and global sentiment had turned overwhelmingly bearish, we published an article that challenged the fear-driven narrative. We explained why selling was not the right approach and […]
-
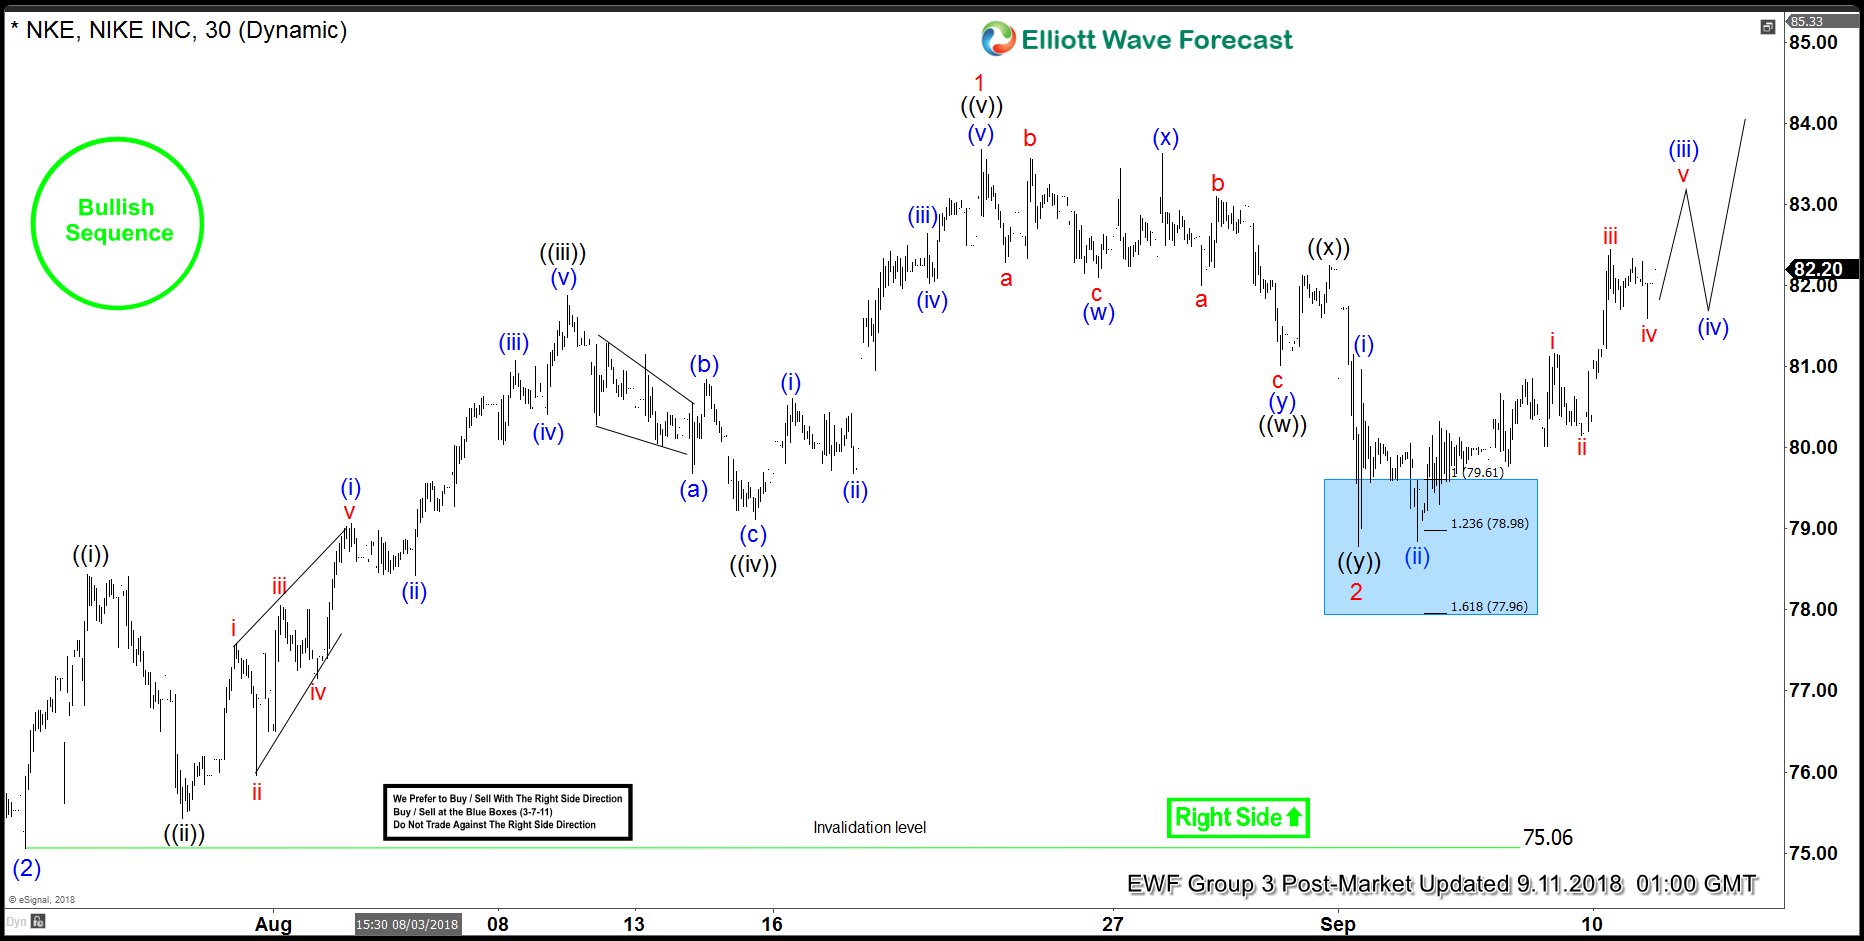
NKE Ready To Start The Next Leg Higher?
Read MoreNike Ticker symbol: NKE short-term Elliott wave view suggests that the pullback to $75.06 low ended intermediate wave (2). Above from there, the stock has rallied to new all-time highs confirming the next leg higher in intermediate wave (3). The internals of intermediate wave (3) higher is unfolding as Elliott wave impulse structure with the sub-division of […]
-
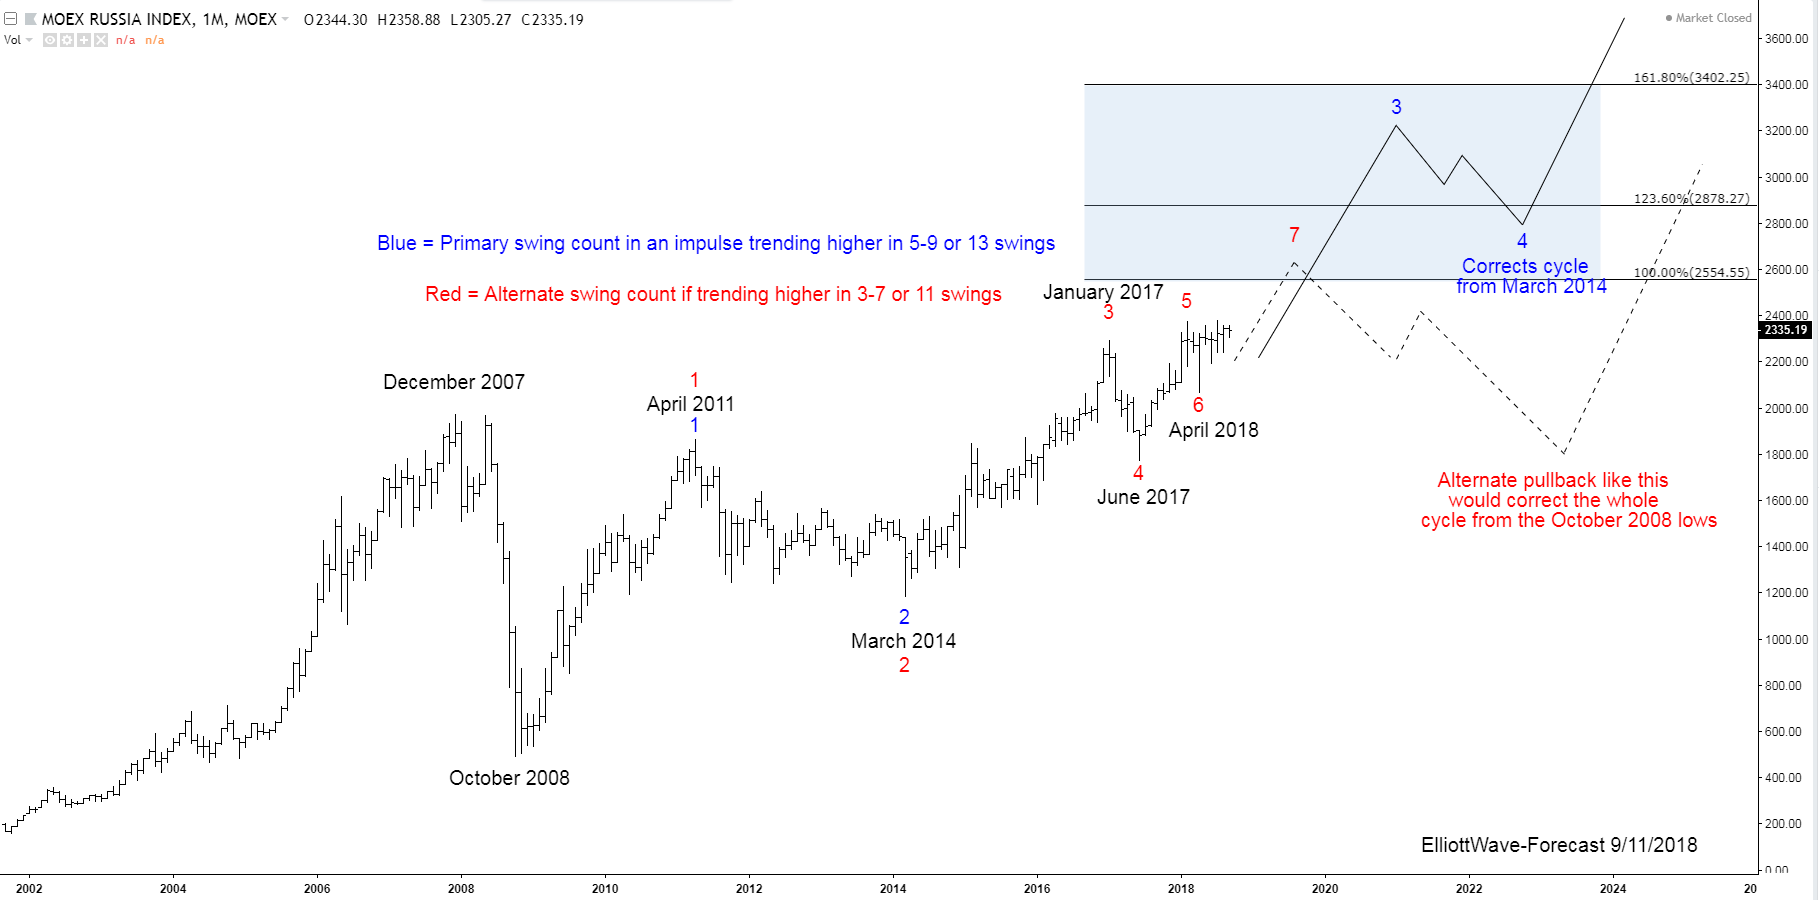
The Micex Index Long Term Bullish Trend and Cycles
Read MoreThe Micex Index Long Term Bullish Trend and Cycles The Micex index has trended higher with other world indices since inception. The index remained in a long term bullish trend cycle into the December 2007 highs. It made a sharp correction lower in 2008 that lasted until October 2008 similar to other world indices. That is […]
-

AAPL Elliott Wave View: Ready For Wave 5 Higher?
Read MoreAPPLE ticker symbol: AAPL short-term Elliott wave view suggests that the rally to $229.67 high ended intermediate wave 3 higher. The internals of that rally higher unfolded as impulse structure with the sub-division of 5 waves structure in it’s each leg higher. Down from $229.67 high, the instrument did a 7 swing pullback & completed […]
-
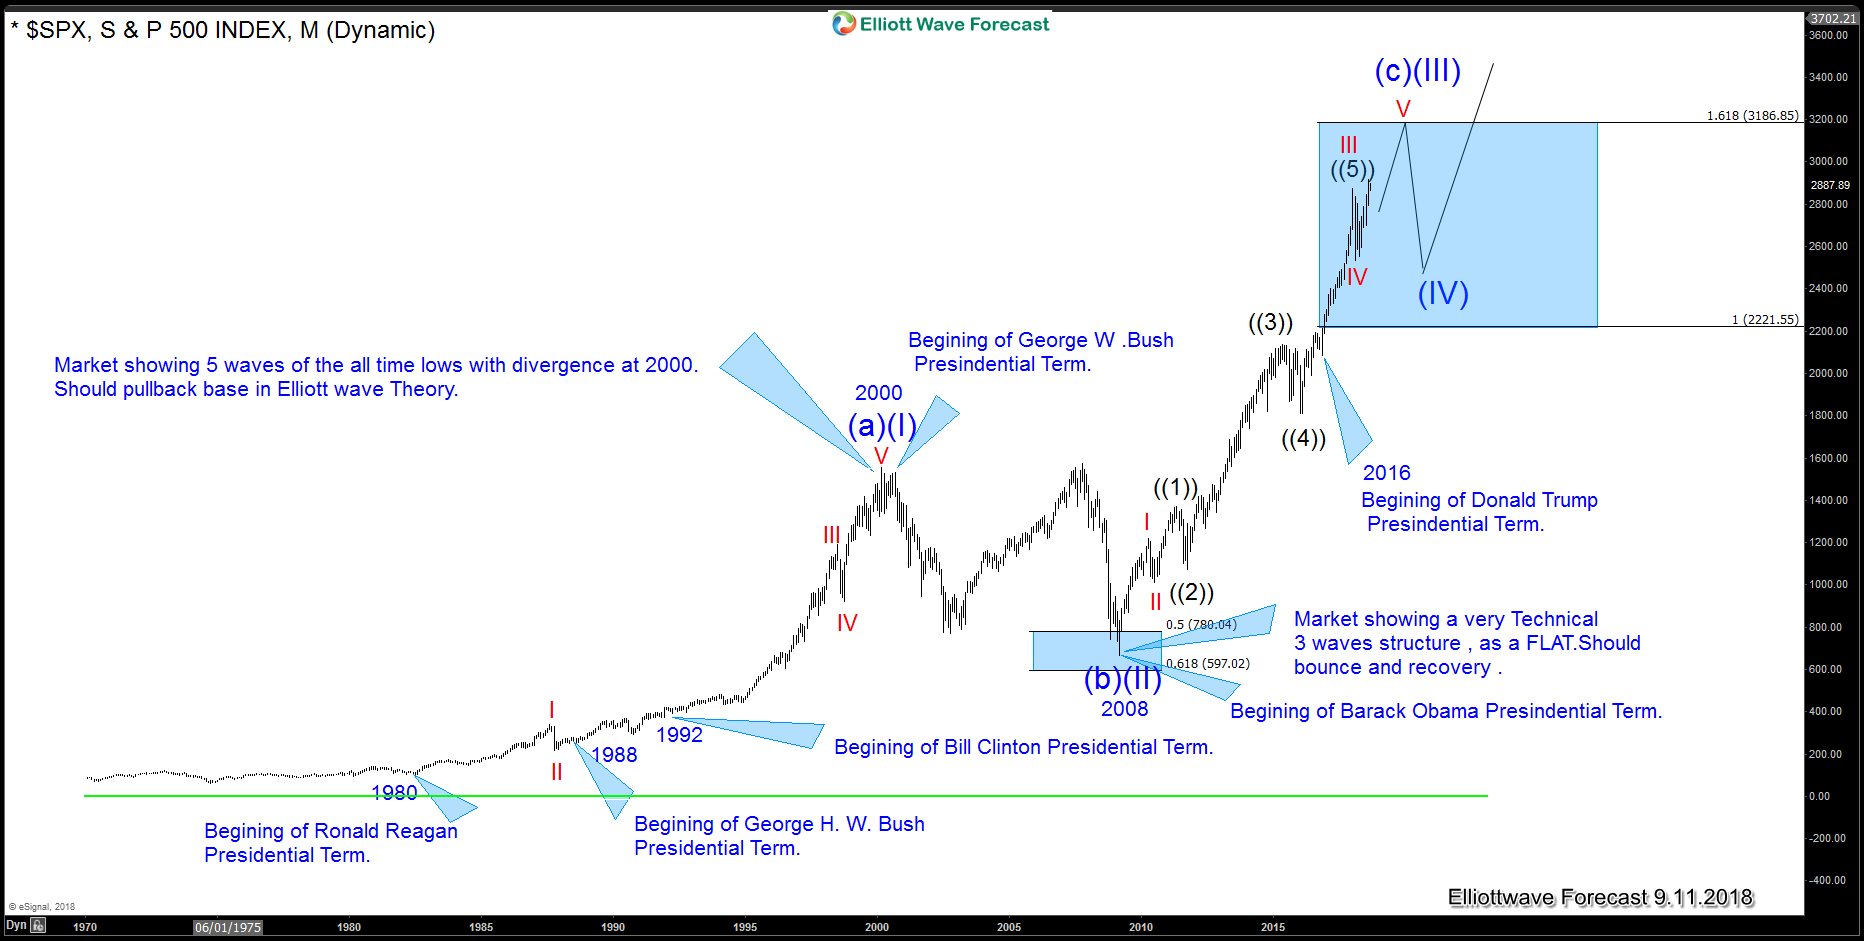
Is the $SPX rally really based on the Presidential Economic Agenda(s) or is the rally purely Technical?
Read MoreSince the latest major US elections, a lot of fuss (mainly via Twitter and various “MAGA” rallies) has been made over how President Trump’s economic agenda(s) produced the current leg of the rally in the American equity indices. And how the tax cuts have accelerated the current rally. We, at elliottwave-forecast.com, we disagree with the idea. […]
-
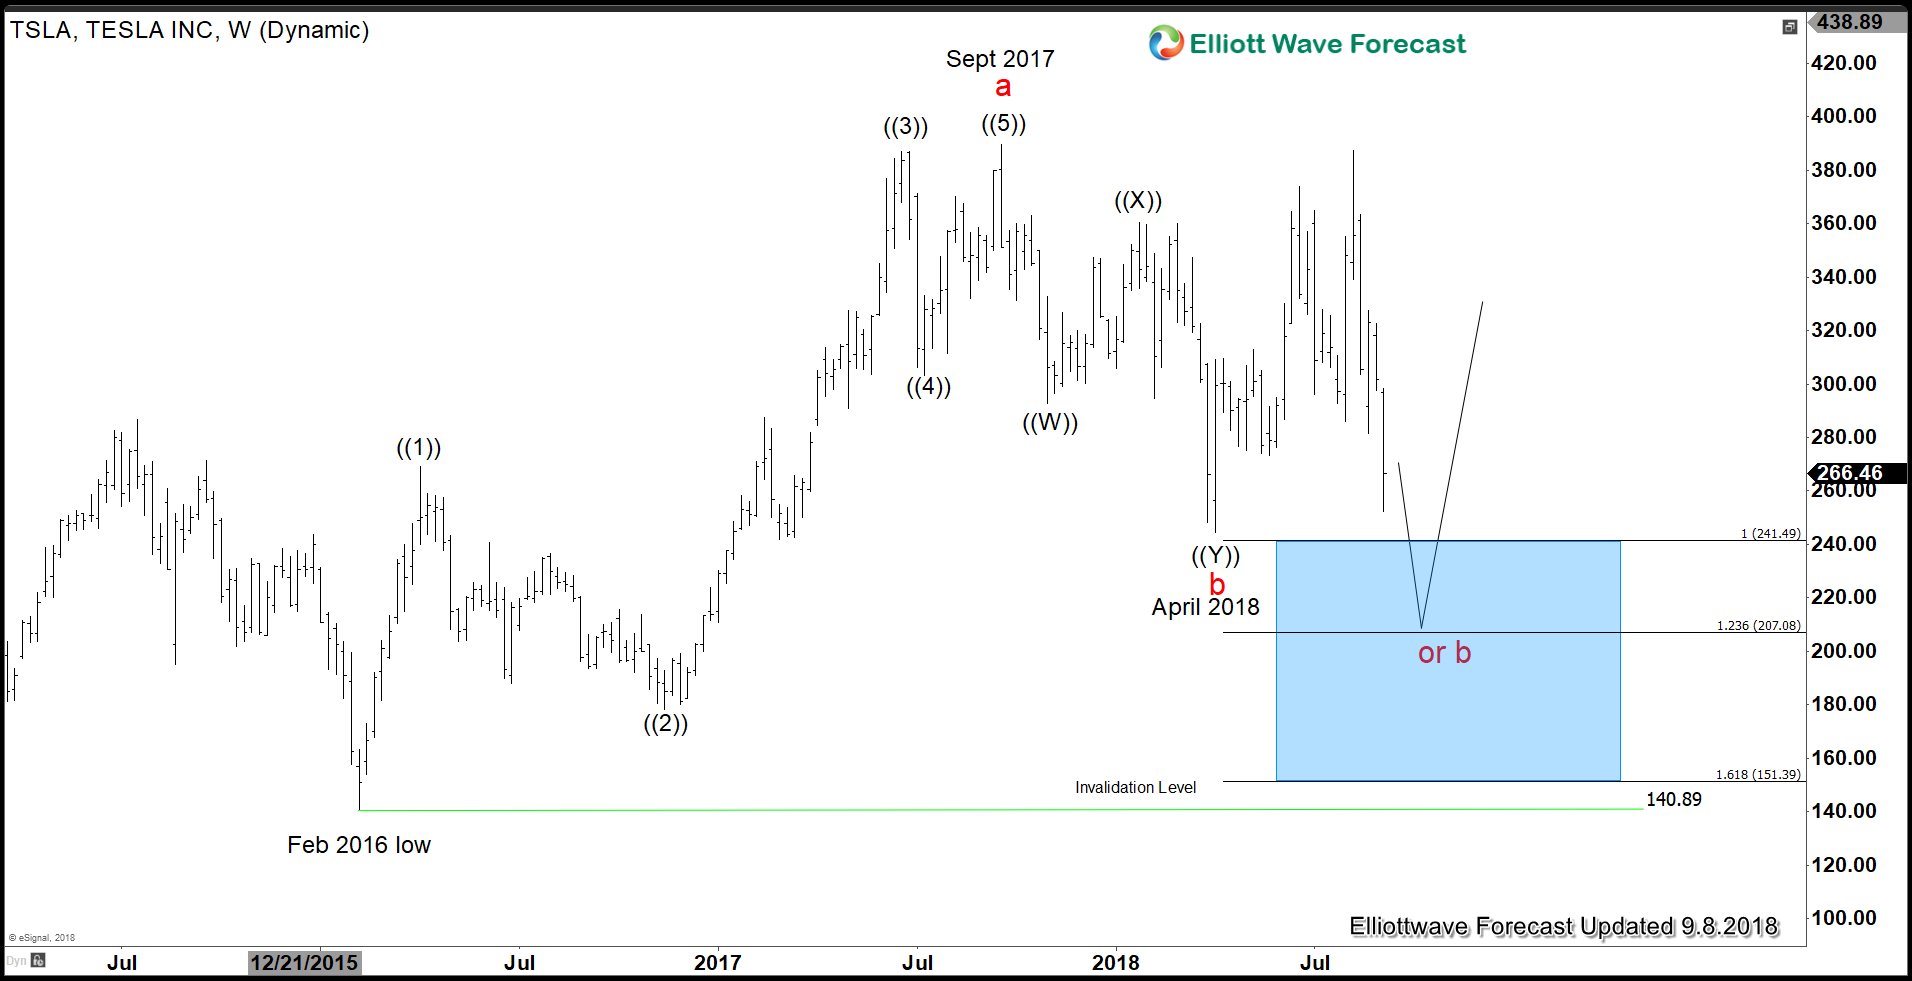
Tesla Shares Tumbled as Senior Executives Leave
Read MoreTesla shares (TSLA) dropped sharply to as much as 10% to $252.25 in New York after the company disclosed that its chief accounting officer is resigning after less than a month into the job. The head of HR, who is currently on leave, also said she won’t be rejoining the company. This is the steepest […]
-
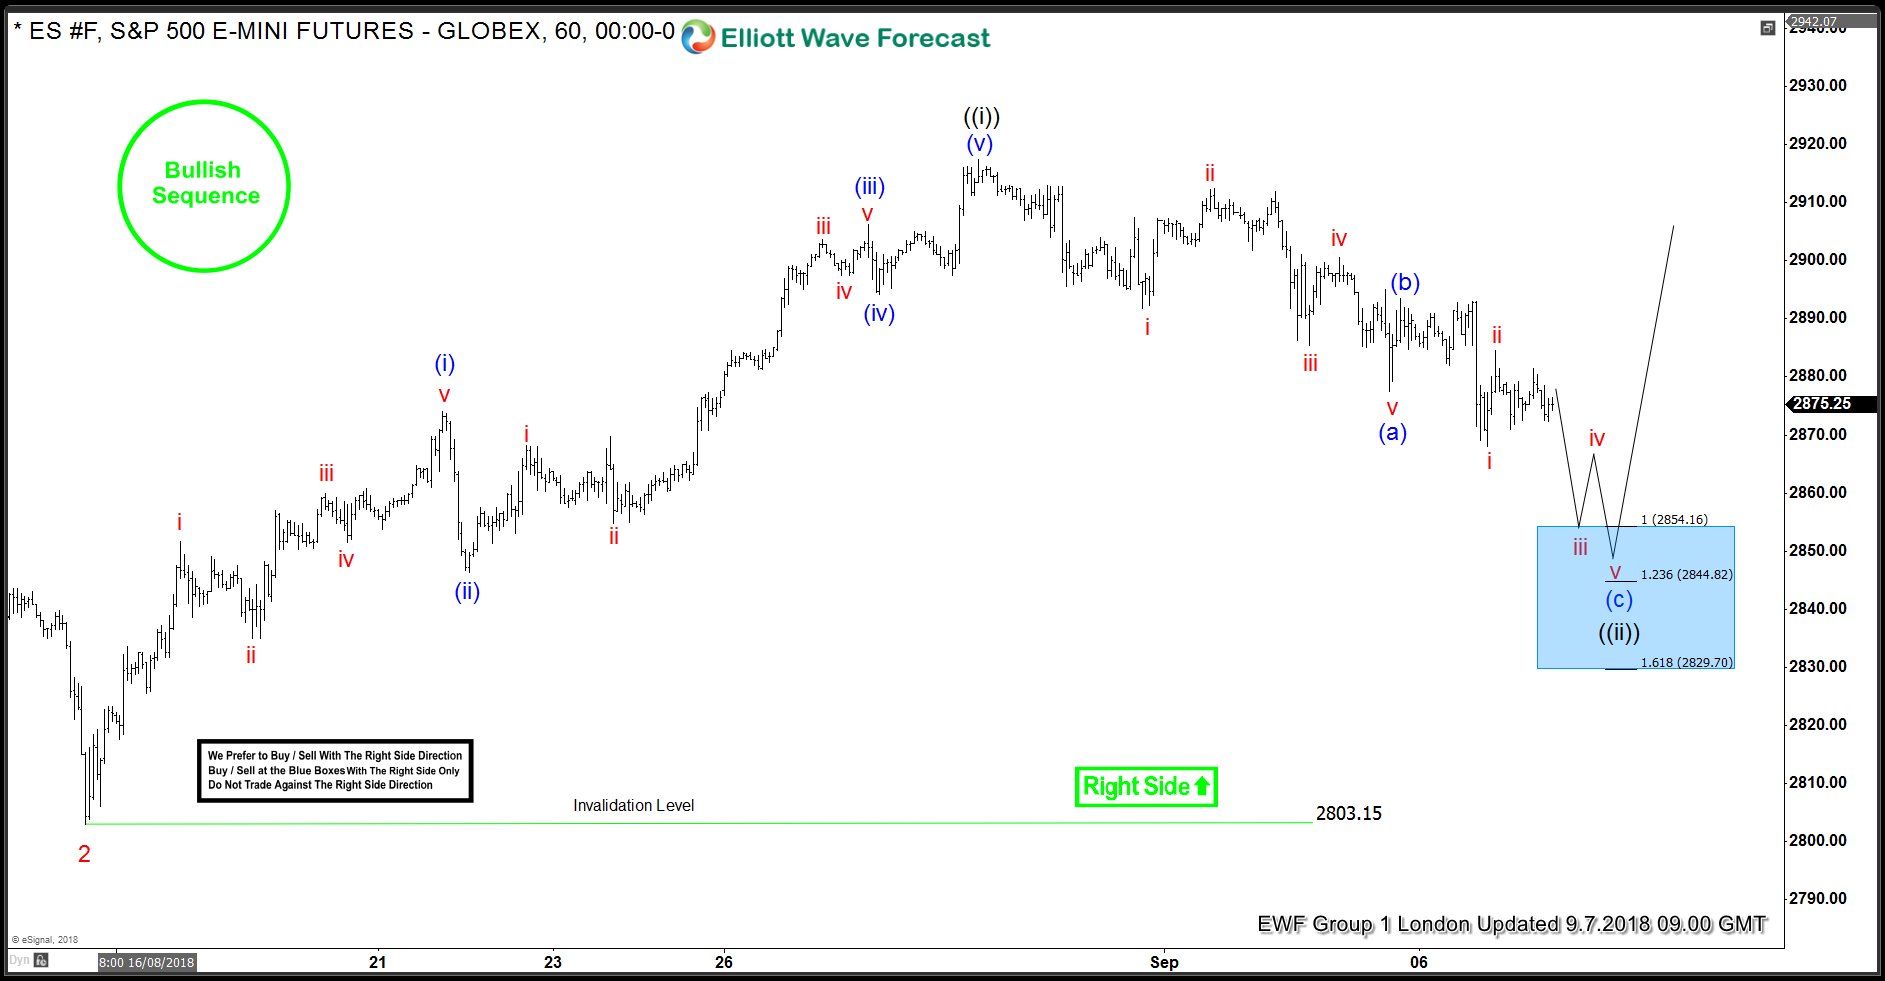
ES_F Elliott Wave Analysis: Correction Taking Place
Read MoreES_F Short-term Elliott wave analysis suggests that the pullback to $2803.15 ended Minor wave 2 pullback. Up from there, the index has rallied higher into new highs confirming that Minor wave 3 has started. The internals of that rally higher is unfolding as impulse structure with the sub-division of 5 waves structure in the lesser […]