
The Power of 3-7-11 and the Grand Super Cycle: How We Saw the Bullish Turn in April 2025 Back on April 9, 2025, while World Indices were dropping sharply and global sentiment had turned overwhelmingly bearish, we published an article that challenged the fear-driven narrative. We explained why selling was not the right approach and […]
-

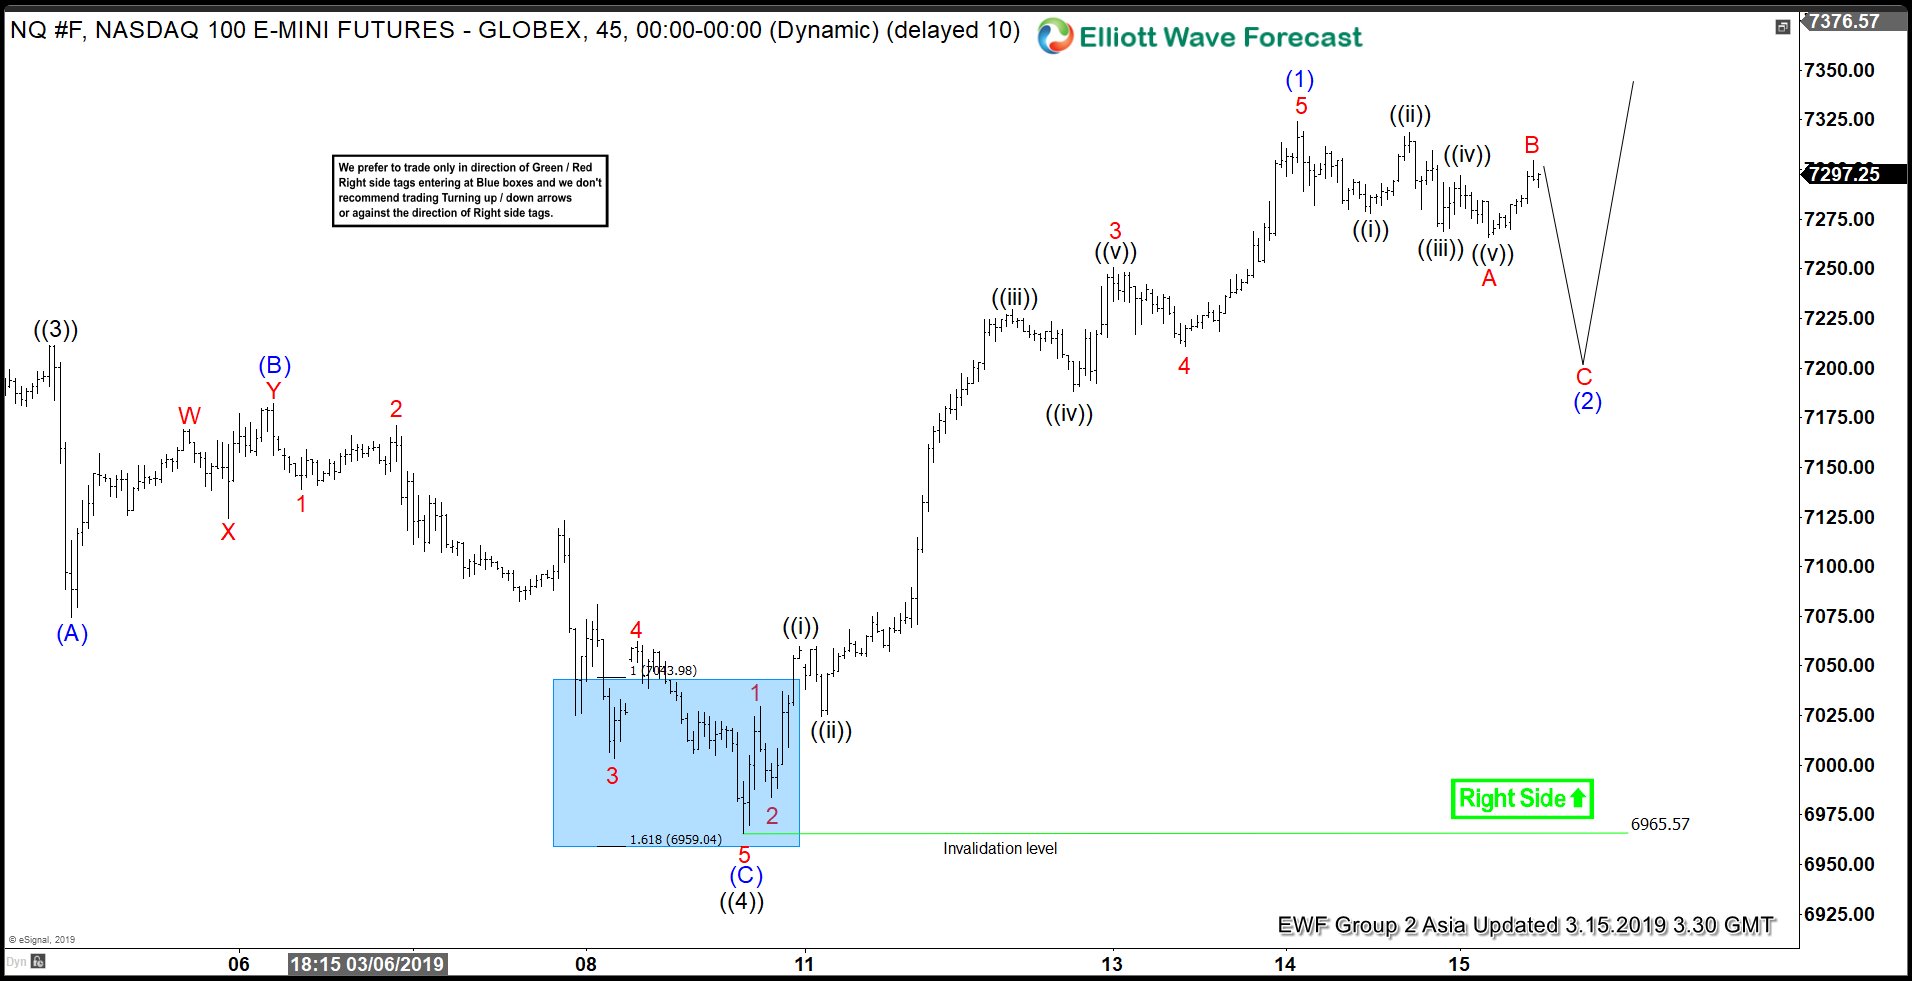
Elliott Wave View: Nasdaq Correction In Progress
Read MoreThis article and video explains the short term Elliott Wave path for Nasdaq. The Index is correcting cycle from March 8 low and more upside can be seen once the pullback is complete.
-

LMT Showing Elliott Wave Impulse Structure From All Time Lows
Read MoreLockheed Martin ticker symbol: LMT cycle from all-time lows is unfolding as Elliott wave impulse structure calling for more upside.
-

Wave Structure Suggests Green Shoots Appearing in SNAP
Read MoreIs There a Bottom for SNAP ? On March 3, 2017 shares of Snap Inc ( NYSE: SNAP ) printed a now all-time high of $29.44. Ever since then the social media/ camera company has seen very little positive sentiment. Just a couple of short months ago now SNAP hit its lowest price since its […]
-

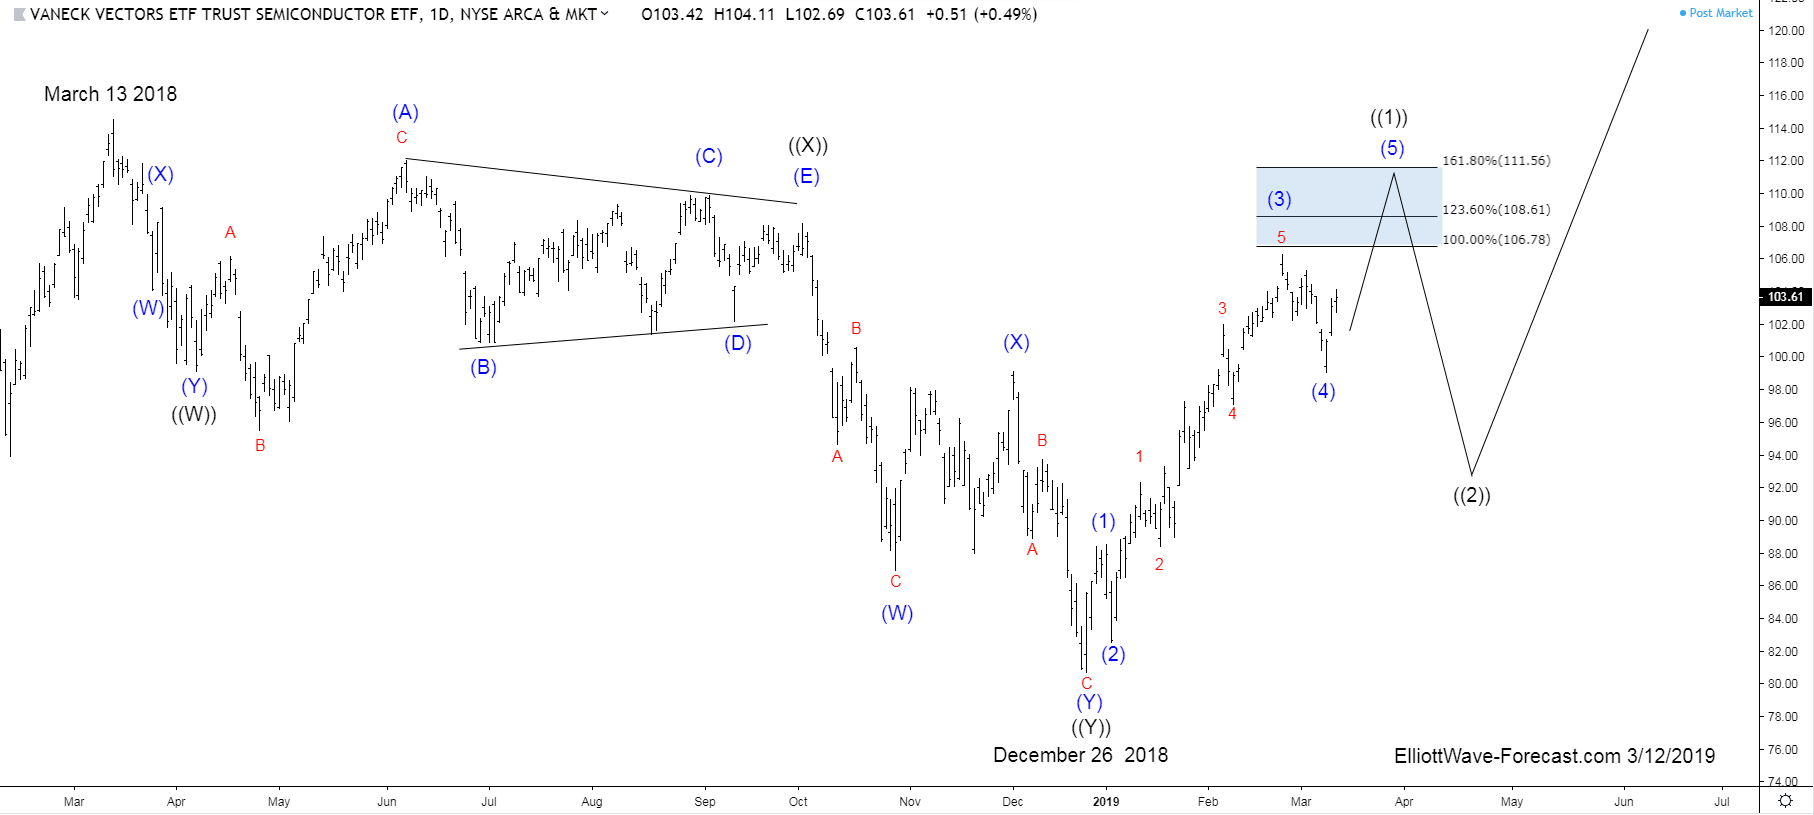
$SMH Longer Term Bullish Cycles & Elliott Wave
Read More$SMH Longer Term Bullish Cycles & Elliott Wave Firstly as seen on the monthly chart shown below. There is data back to May 2000 in the ETF fund. Data suggests the fund made a low in November 2008 that has not been taken out in price. There is no Elliott Wave count on the monthly […]
-

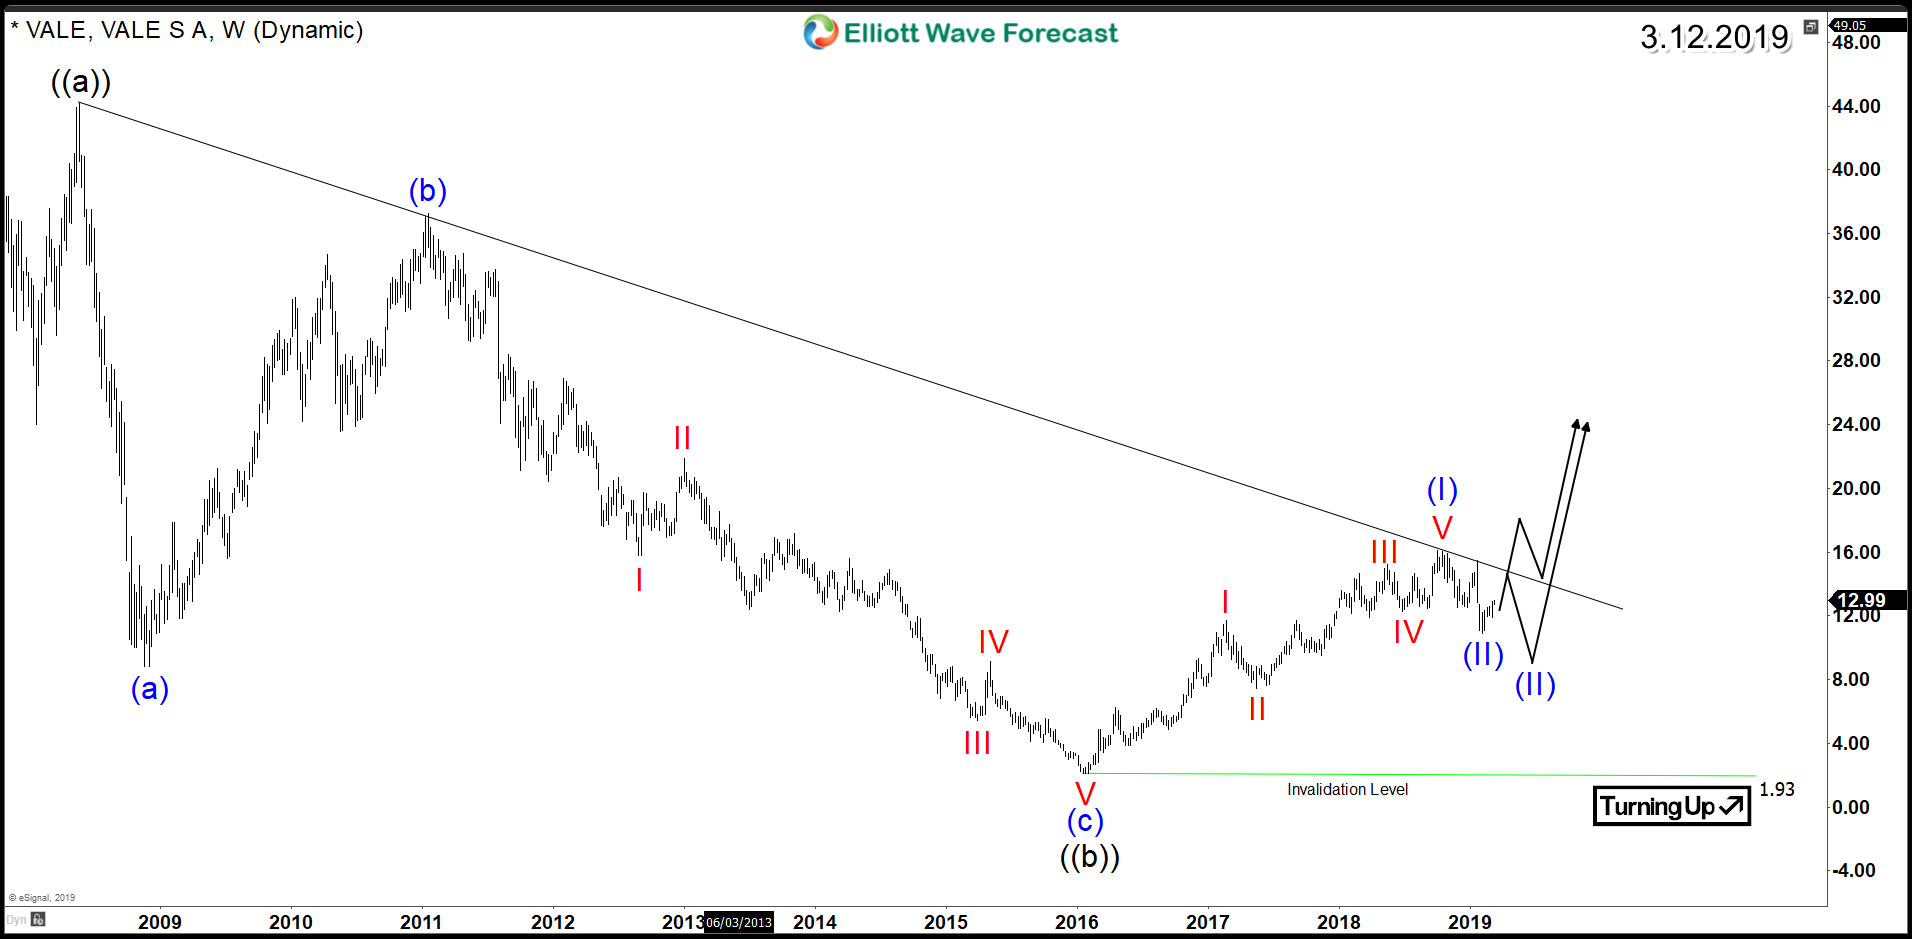
Vale Aiming to Break Above 2008 Bearish Trend-Line
Read MoreVale is a Brazilian multinational mining corporation and also is the largest producer of iron ore and nickel in the world. In 2016, many commodities saw significant moves to the upside with the rise of Oil and Gold prices. The move helped metal & mining sector to recover after 5 years of decline and many stocks started a new […]
-

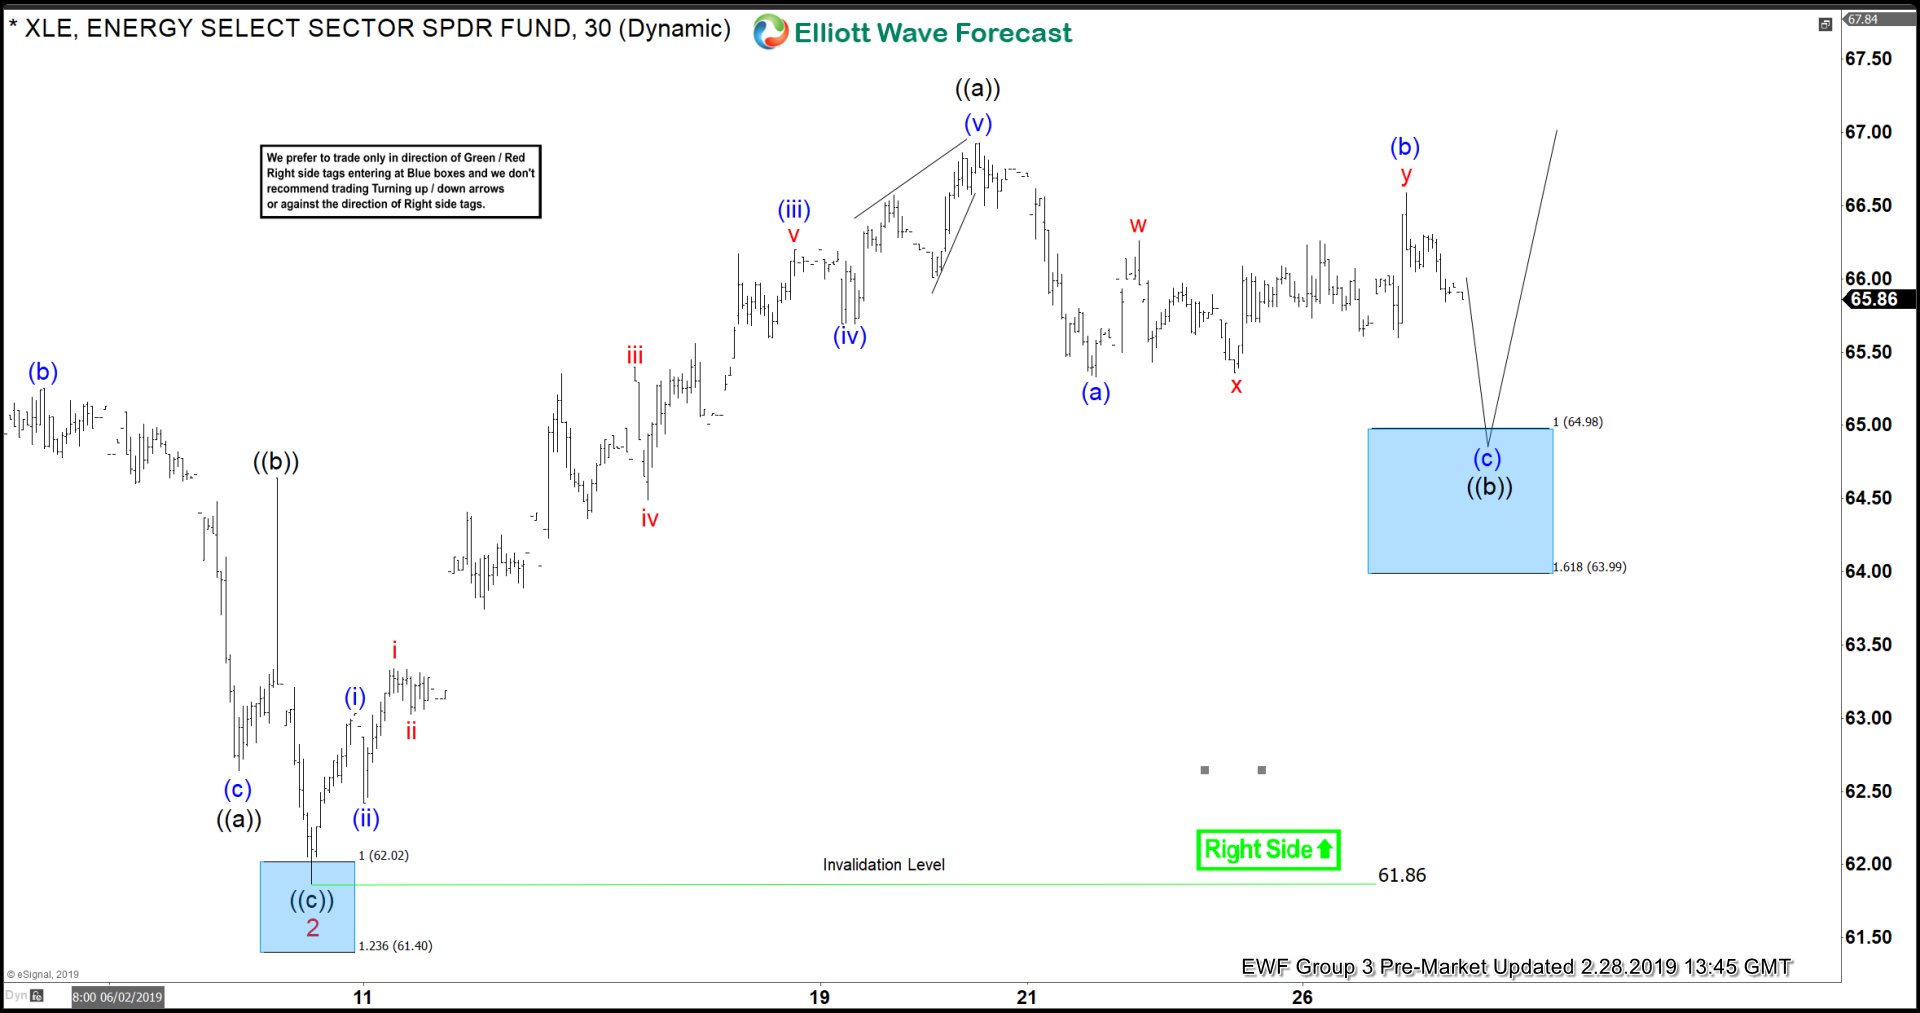
XLE Buying The Elliott Wave Dips
Read MoreIn this technical blog, we will be going to take a look at some Elliott Wave charts of XLE which we presented to our members recently.