

The Power of 3-7-11 and the Grand Super Cycle: How We Saw the Bullish Turn in April 2025 Back on April 9, 2025, while World Indices were dropping sharply and global sentiment had turned overwhelmingly bearish, we published an article that challenged the fear-driven narrative. We explained why selling was not the right approach and […]
-
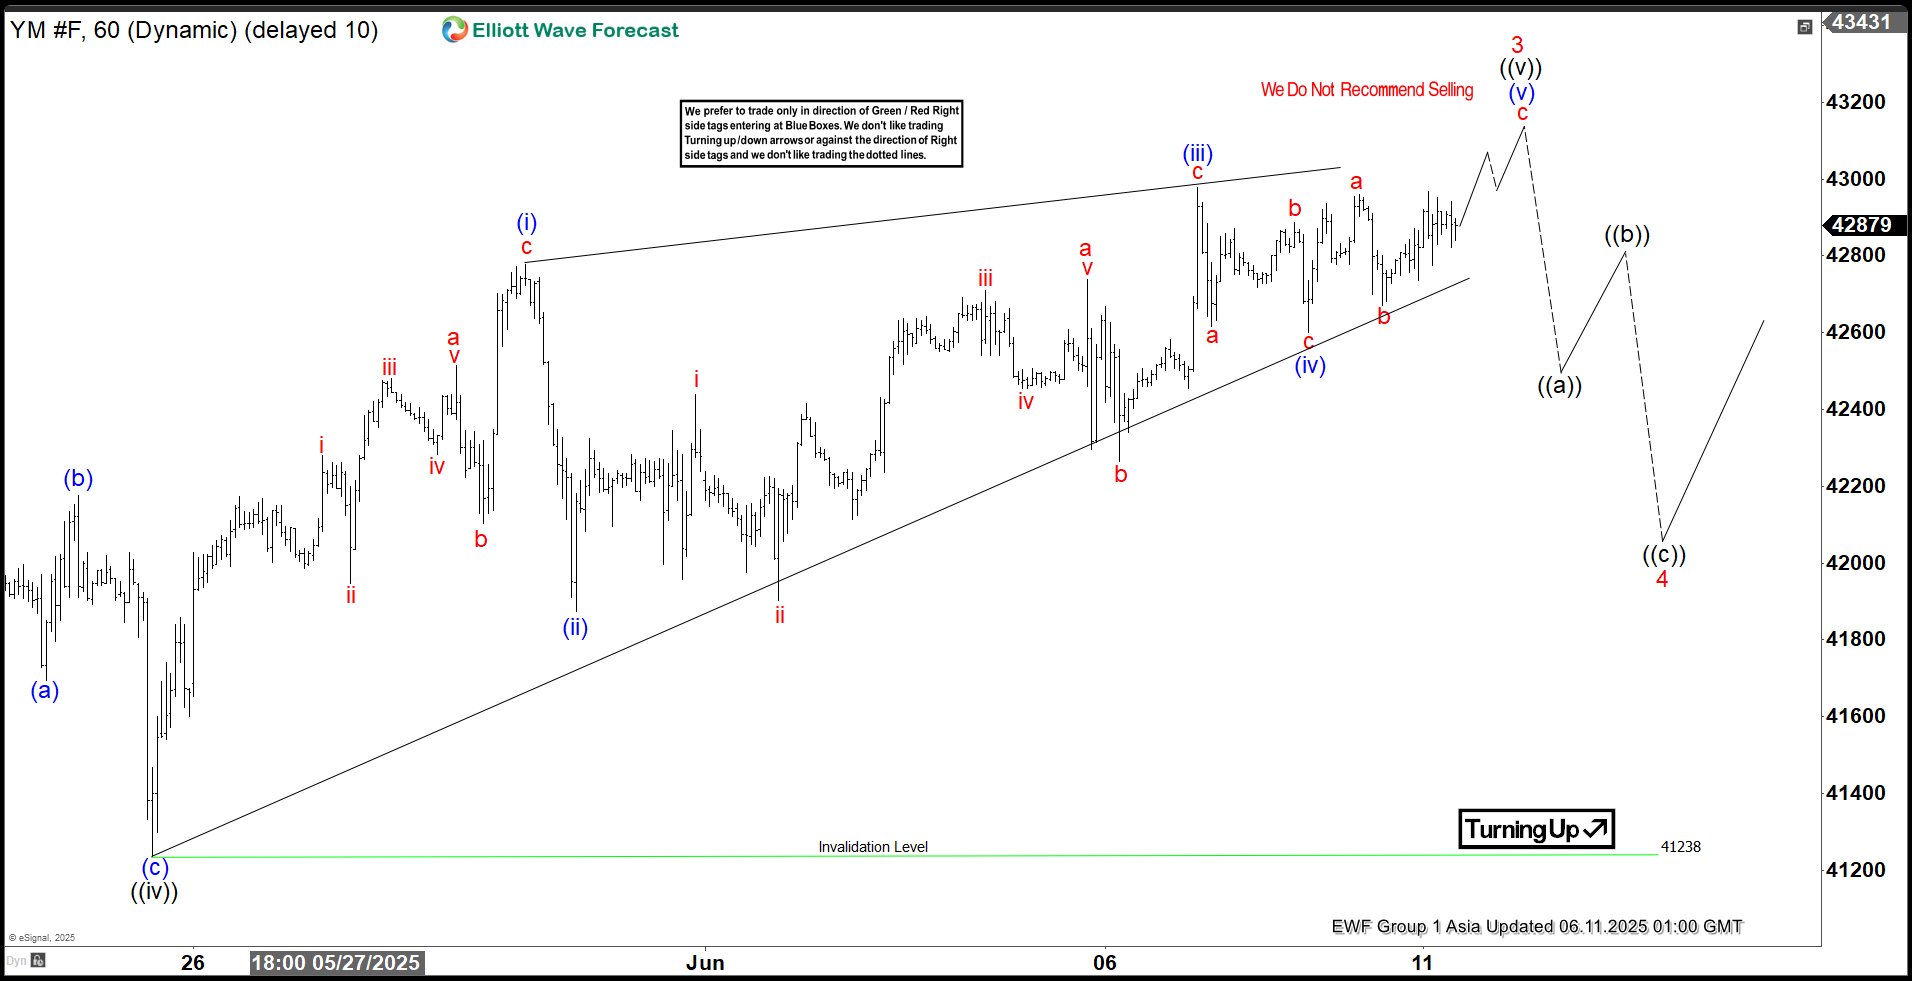
Elliott Wave Insight: Dow Futures (YM) Set to Wrap Up Wave 3 Soon
Read MoreDow Futures (YM) will soon end wave 3 and see a larger pullback within wave 4. This article and video look at the Elliott Wave path.
-
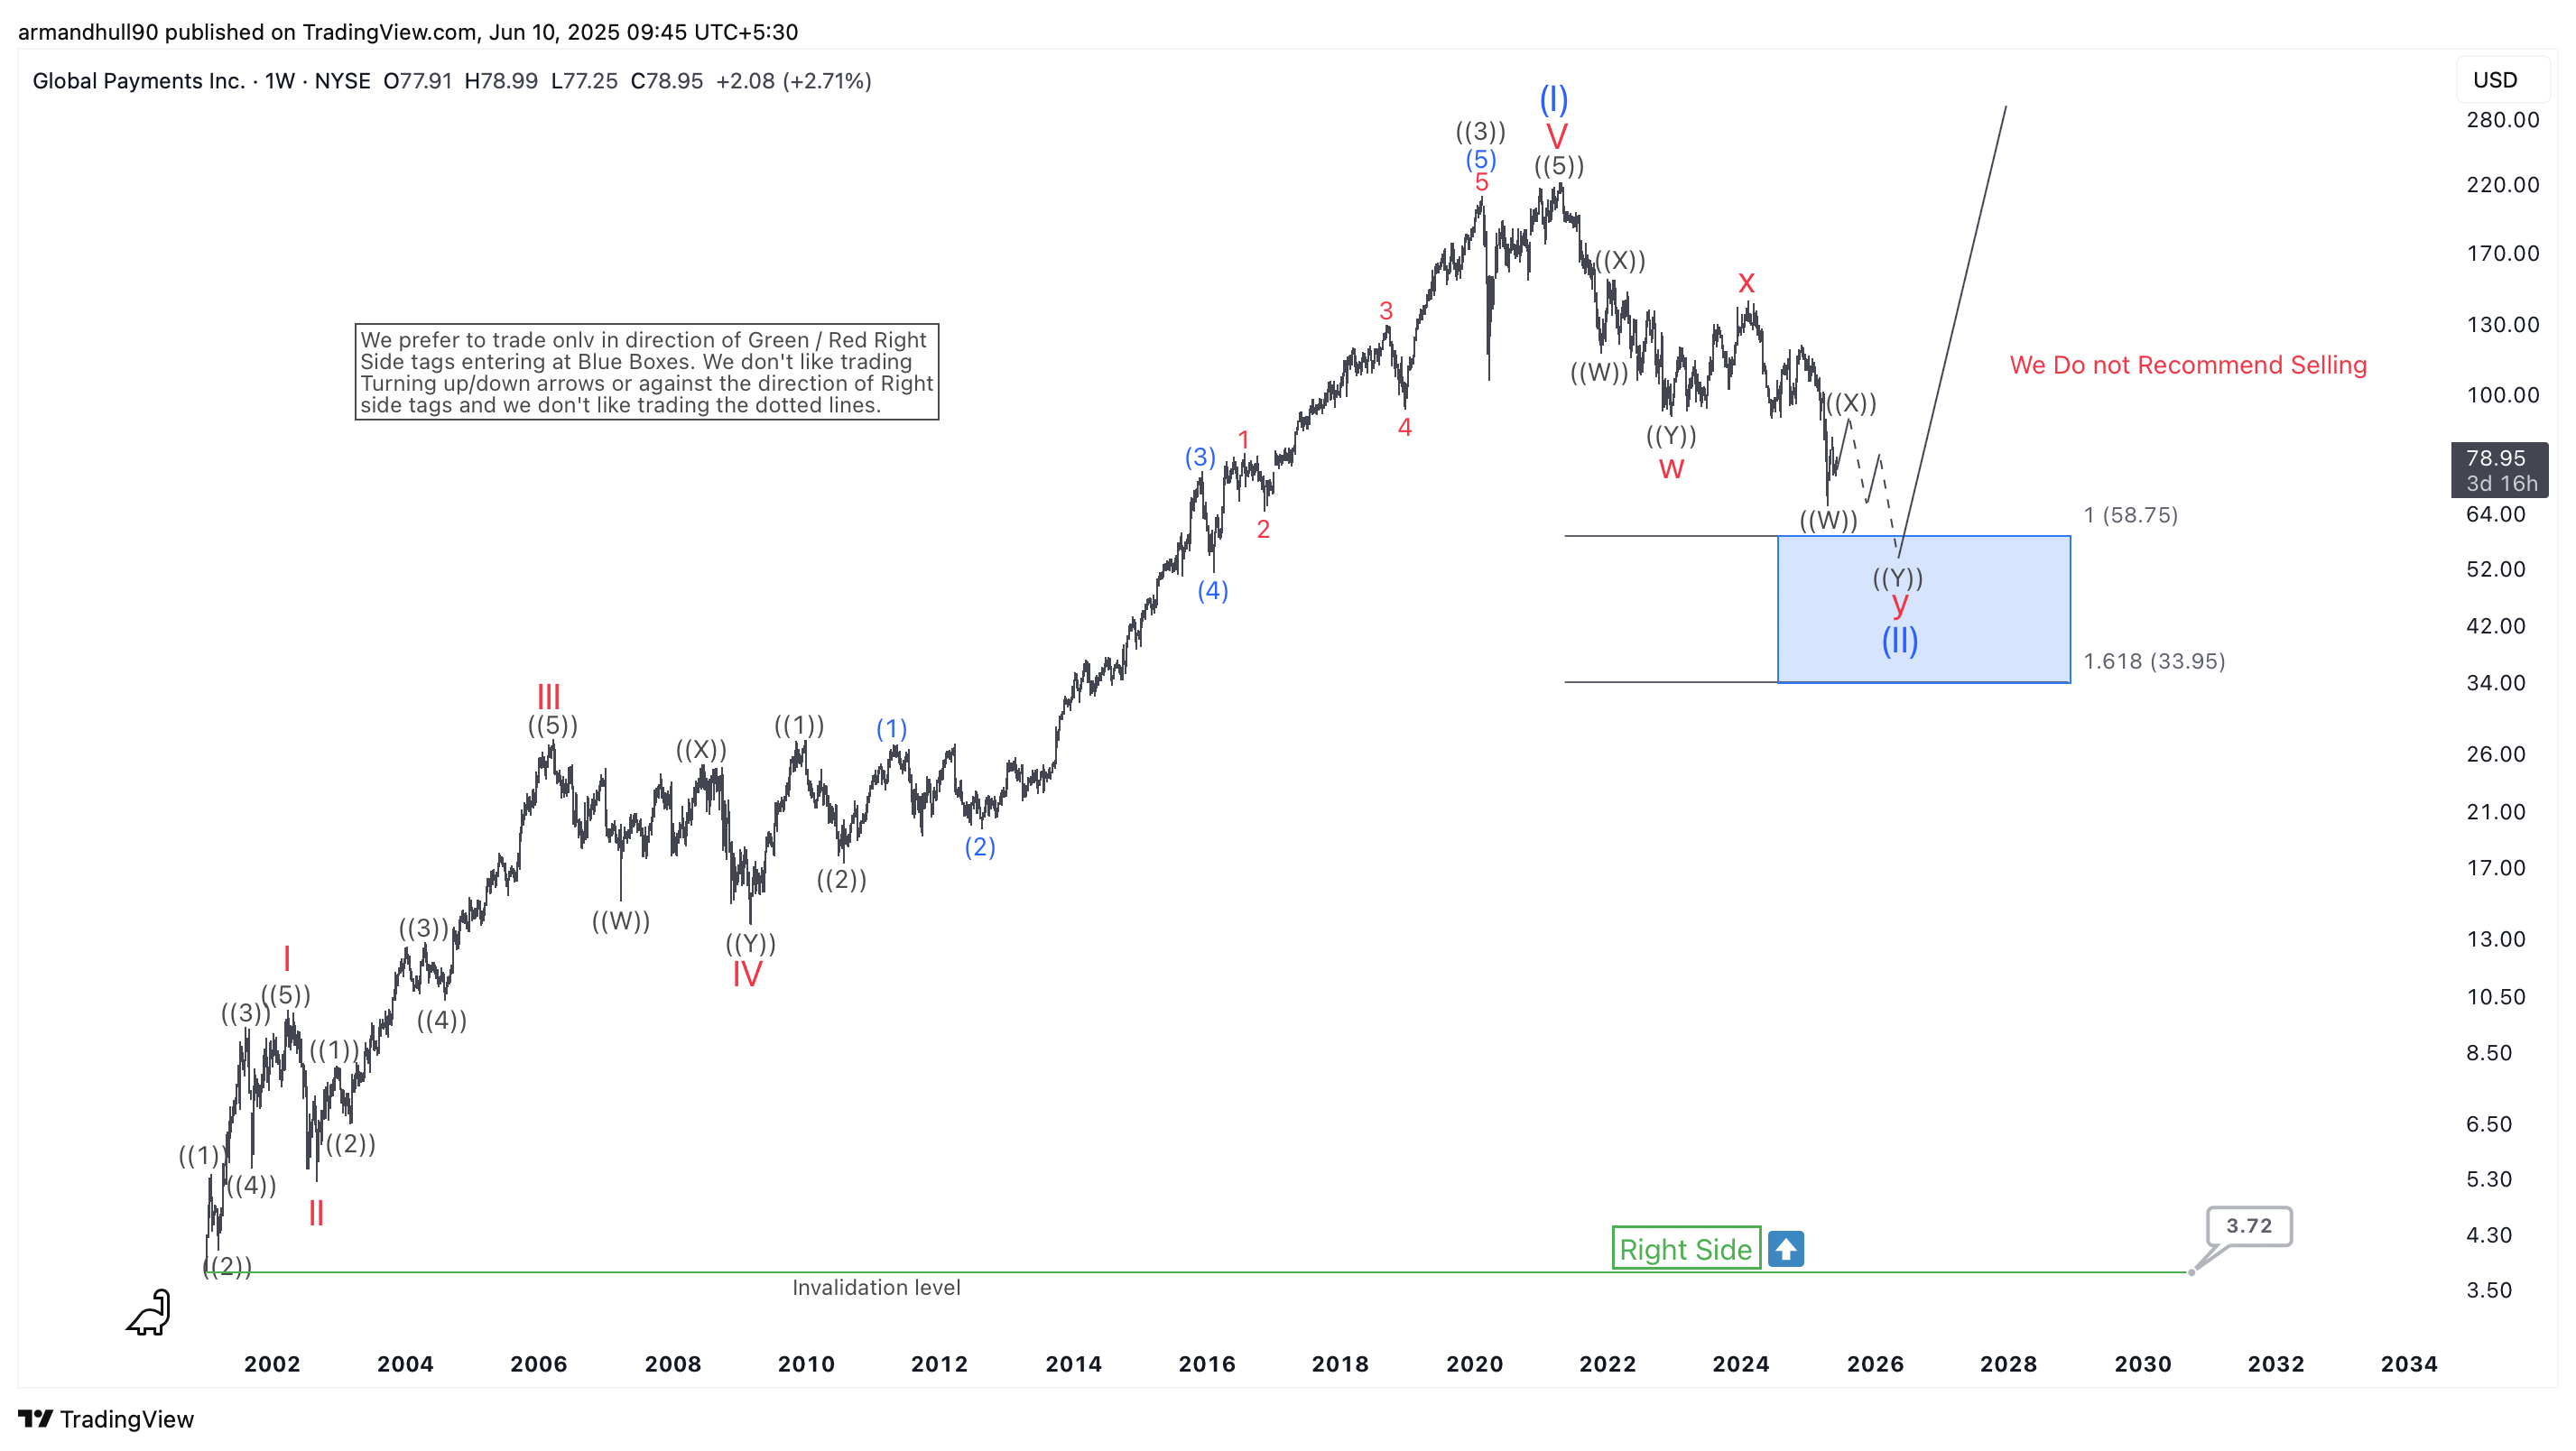
Global Payments Inc. (GPN) Weekly Elliott Wave Analysis
Read MoreGPN is approaching a key Fibonacci support zone, signaling the potential end of a multi-year correction and the start of a new bullish cycle. Global Payments Inc. (NYSE: GPN) is nearing the end of a long-term correction. According to the weekly Elliott Wave chart, GPN is completing a complex W-X-Y corrective structure in wave ((II)). […]
-
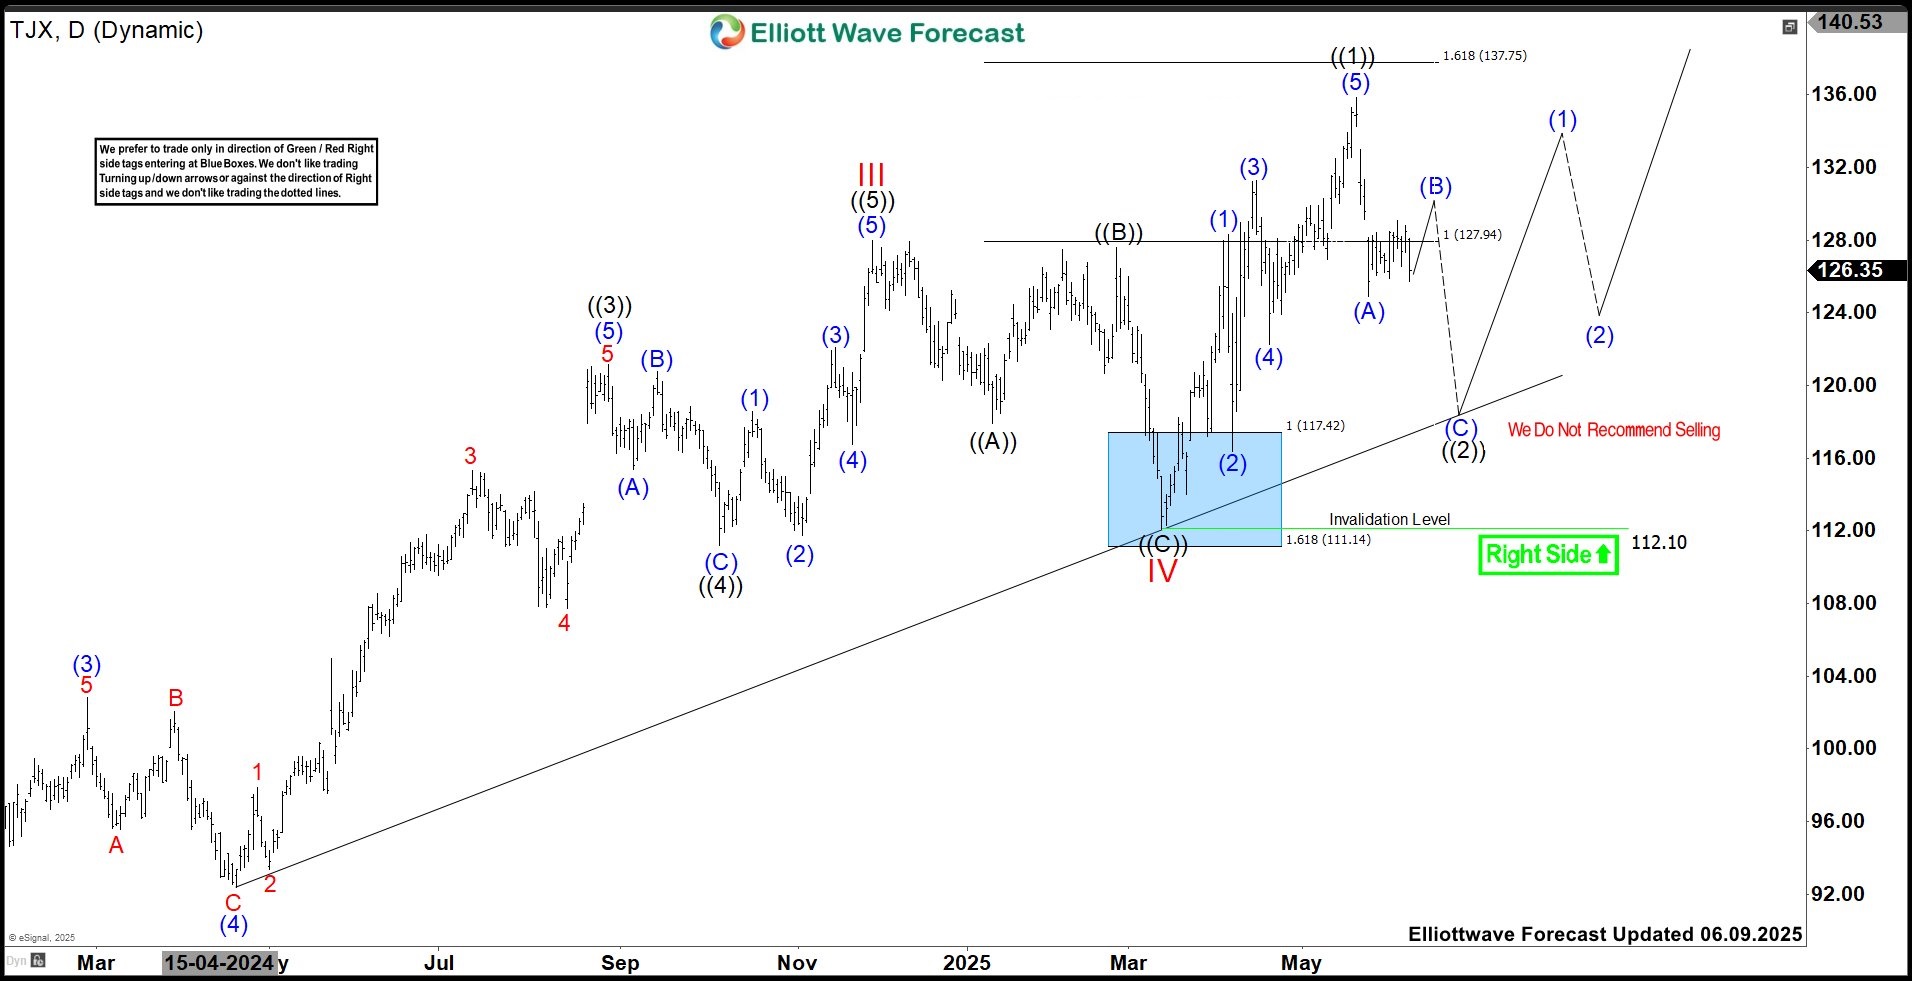
TJX Companies (TJX): Is Bigger Rally Ahead After This Pullback?
Read MoreTJX Companies, Inc., (TJX) operates as an off-price apparel & home fashions retailer in Unites States, Canada, Europe & Australia. It operates through four segments: Marmaxx, HomeGoods, TJX Canada & TJX International. It comes under Consumer Cyclical sector & trades as “TJX” ticker at NYSE. As discussed in the last article, TJX made a new […]
-
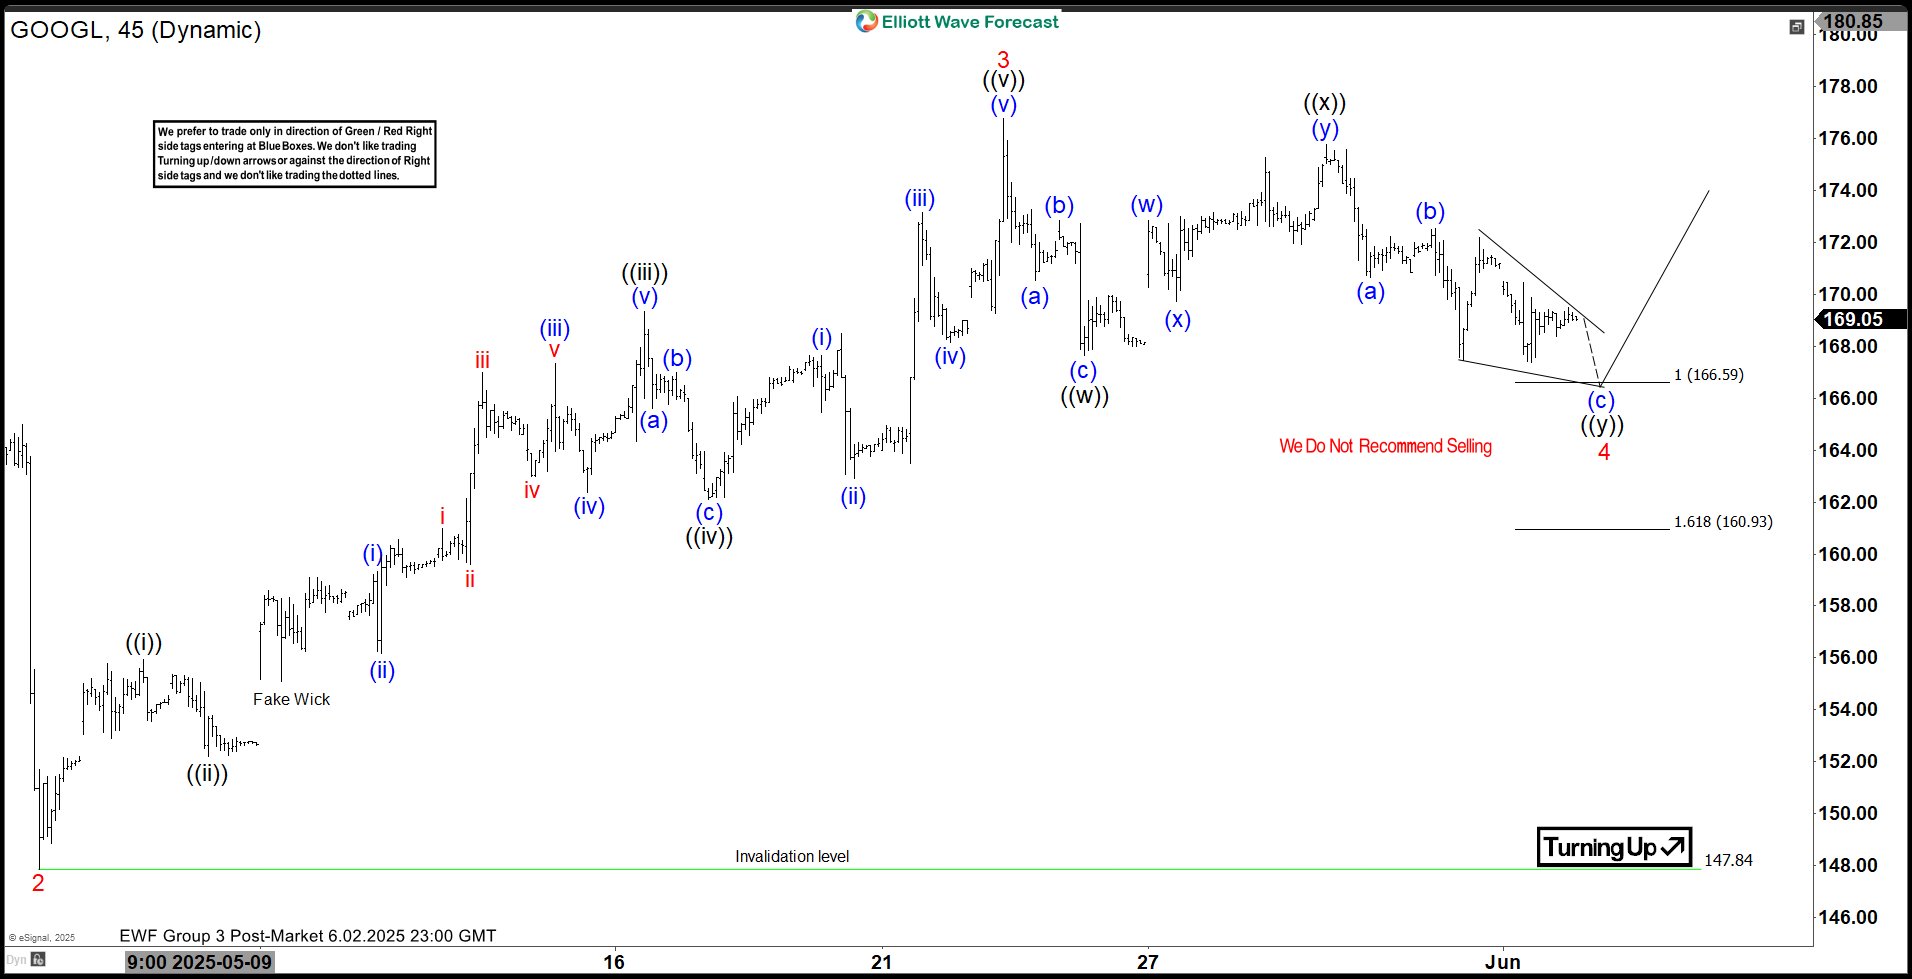
Alphabet Inc. $GOOGL Pullbacks Finding Buyers at Extreme Areas
Read MoreHello everyone! In today’s article, we’ll examine the recent performance of Alphabet Inc. ($GOOGL) through the lens of Elliott Wave Theory. We’ll review how the rally from the May 07, 2025 low unfolded as a 5-wave impulse followed by a 7-swing correction (WXY) and discuss our forecast for the next move. Let’s dive into the structure and expectations for this stock. […]
-
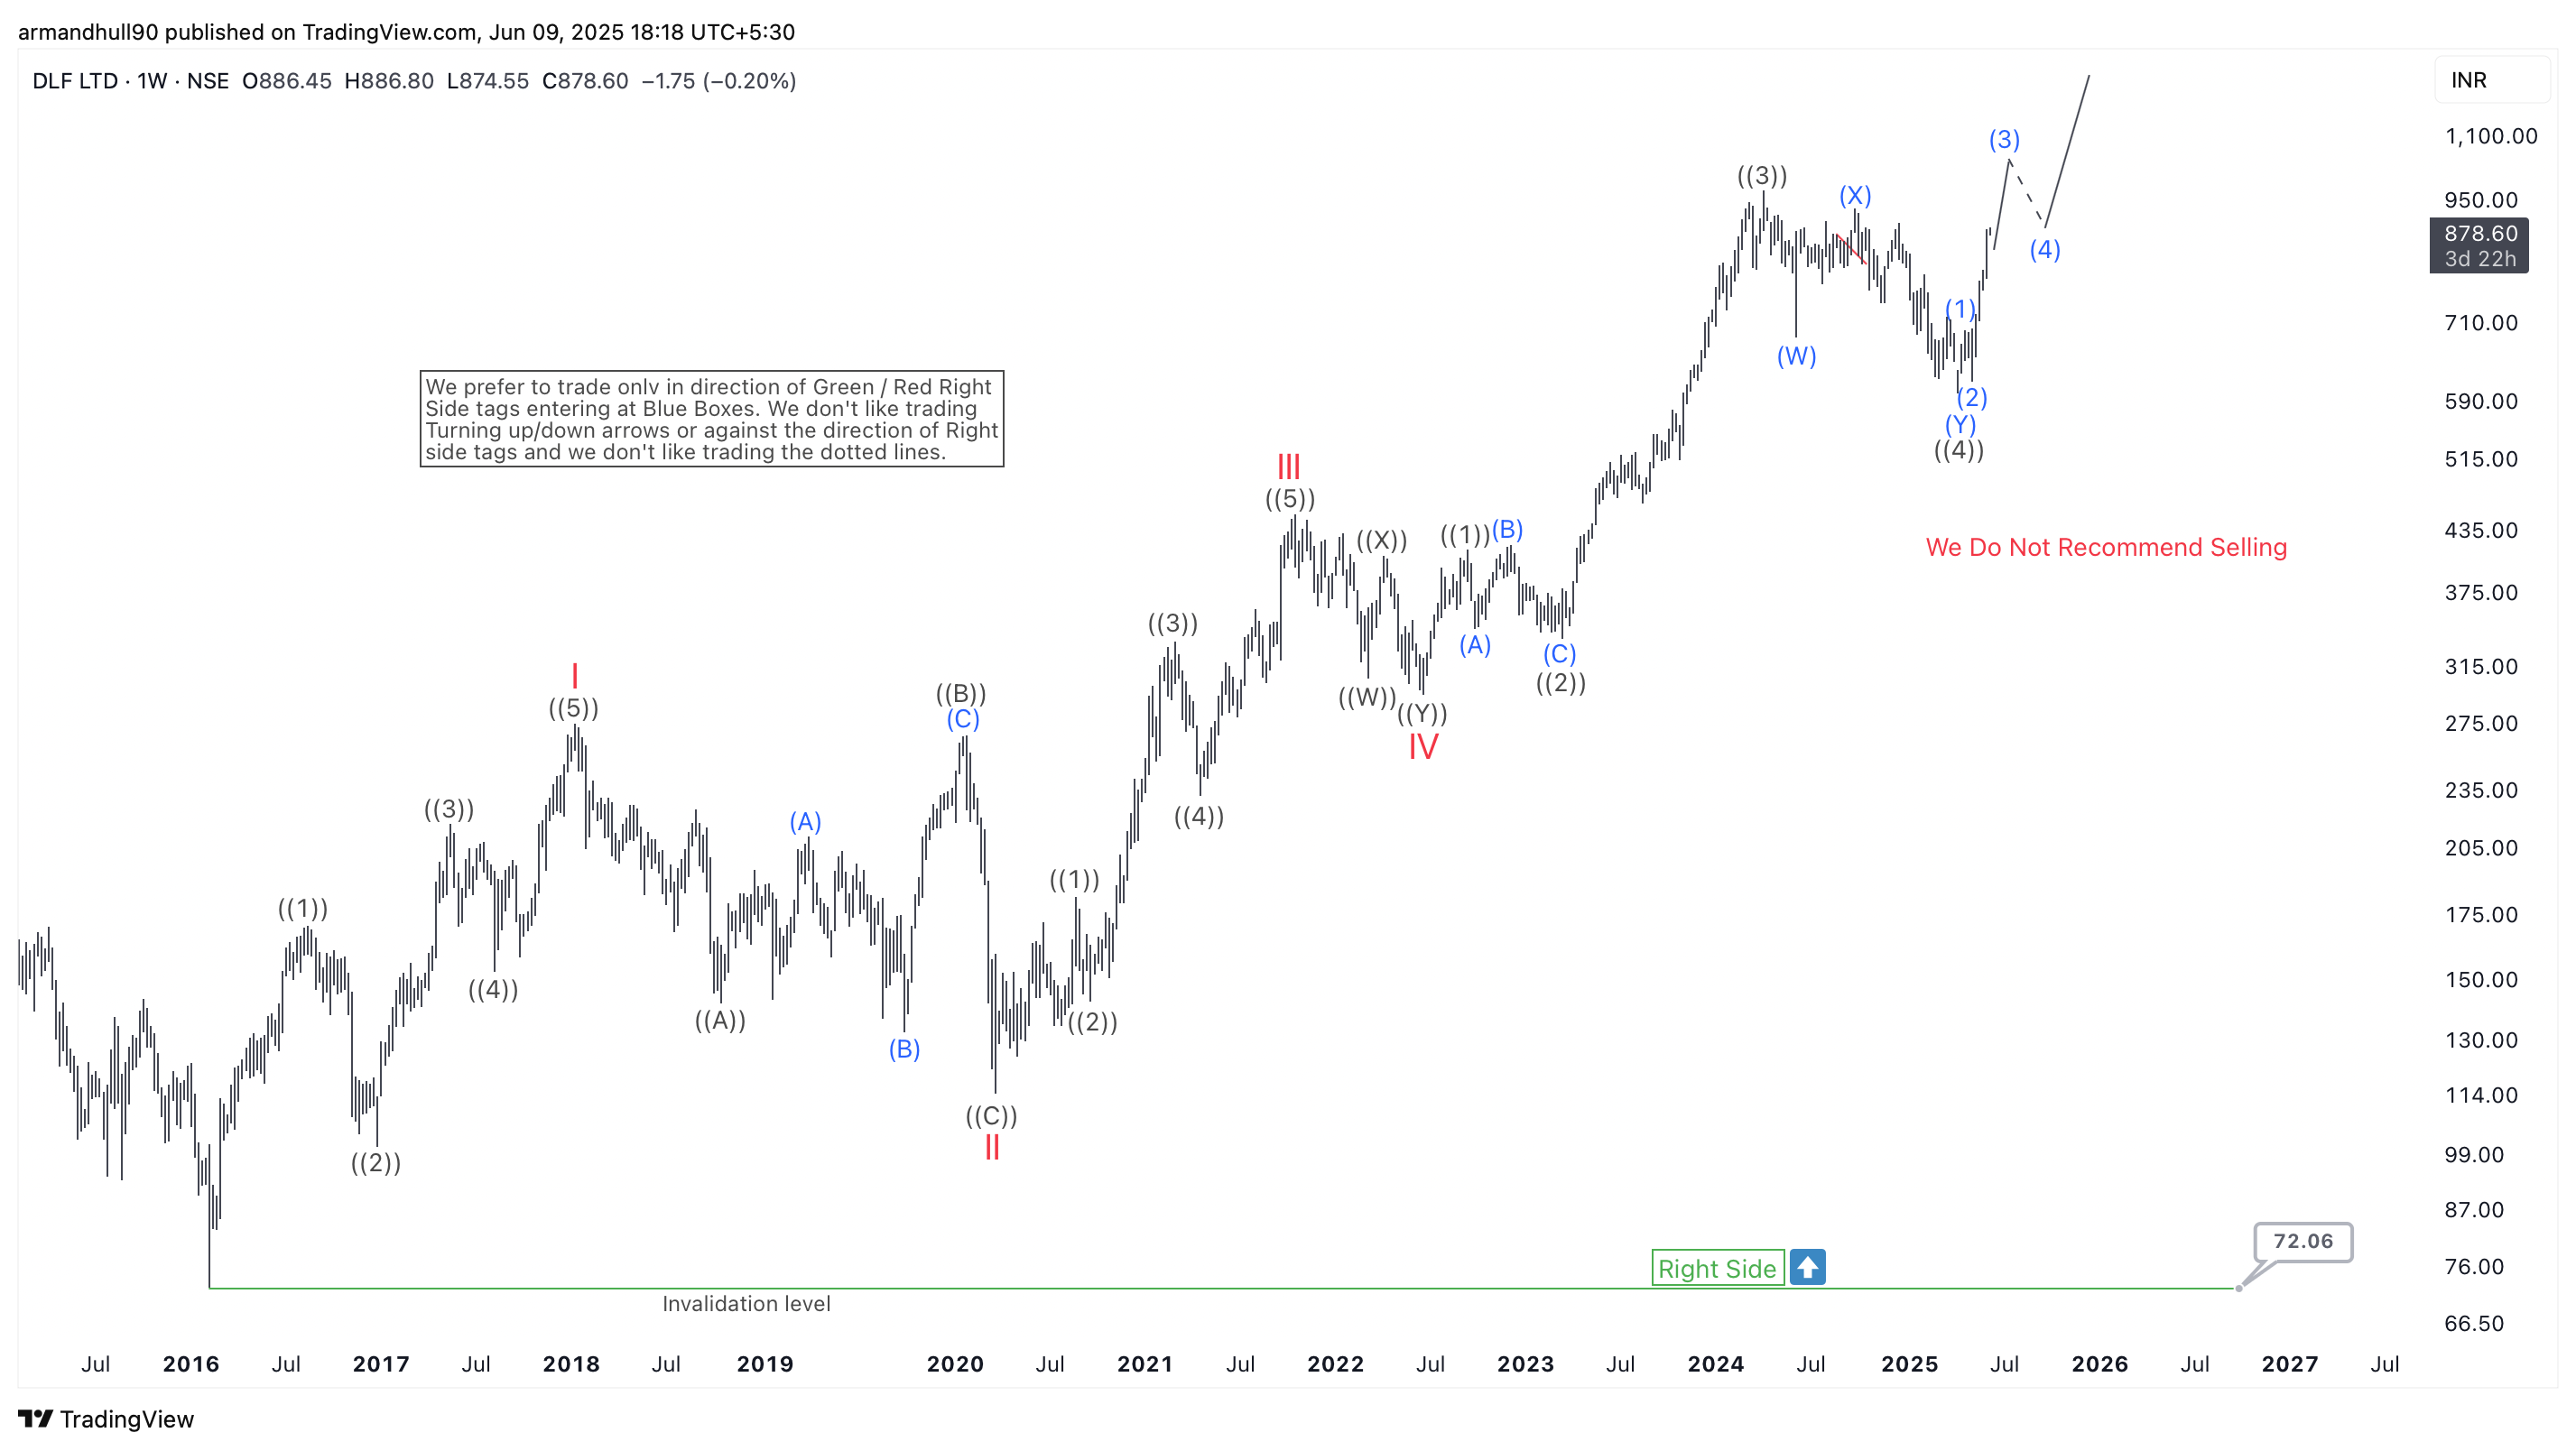
DLF Ltd Elliott Wave Update: Stock Unfolding Its Final Impulsive Leg Toward New Highs
Read MoreDLF continues its bullish trajectory as it progresses through the last stages of a multi-year Elliott Wave impulse, with higher highs still expected in the coming months. DLF Ltd (NSE: DLF) continues to show strong bullish momentum. The stock appears to be unfolding the final leg of a long-term Elliott Wave impulse. Based on the […]
-

GDXJ: Is the Gold Miners Junior ETF Set to Soar Impulsively?
Read MoreThe VanEck Vectors Junior Gold Miners ETF (GDXJ) is an exchange-traded fund designed to provide investors with exposure to small- and mid-cap companies in the gold and silver mining industry, often referred to as “junior” miners. Launched on November 10, 2009, and managed by VanEck, GDXJ seeks to replicate the performance of the MVIS Global […]