

The Power of 3-7-11 and the Grand Super Cycle: How We Saw the Bullish Turn in April 2025 Back on April 9, 2025, while World Indices were dropping sharply and global sentiment had turned overwhelmingly bearish, we published an article that challenged the fear-driven narrative. We explained why selling was not the right approach and […]
-

Elliott Wave View: FTSE Bullish Sequence Favors Higher
Read MoreFTSE shows a bullish Elliott Wave sequence from October 3, 2019 low favoring further upside. The rally from October 3 low is unfolding as a double three Elliott Wave structure. On the chart below, we can see wave ((w)) ended at 7431.94 and pullback in wave ((x)) ended at 7199.40. Internal structure of wave ((x)) […]
-
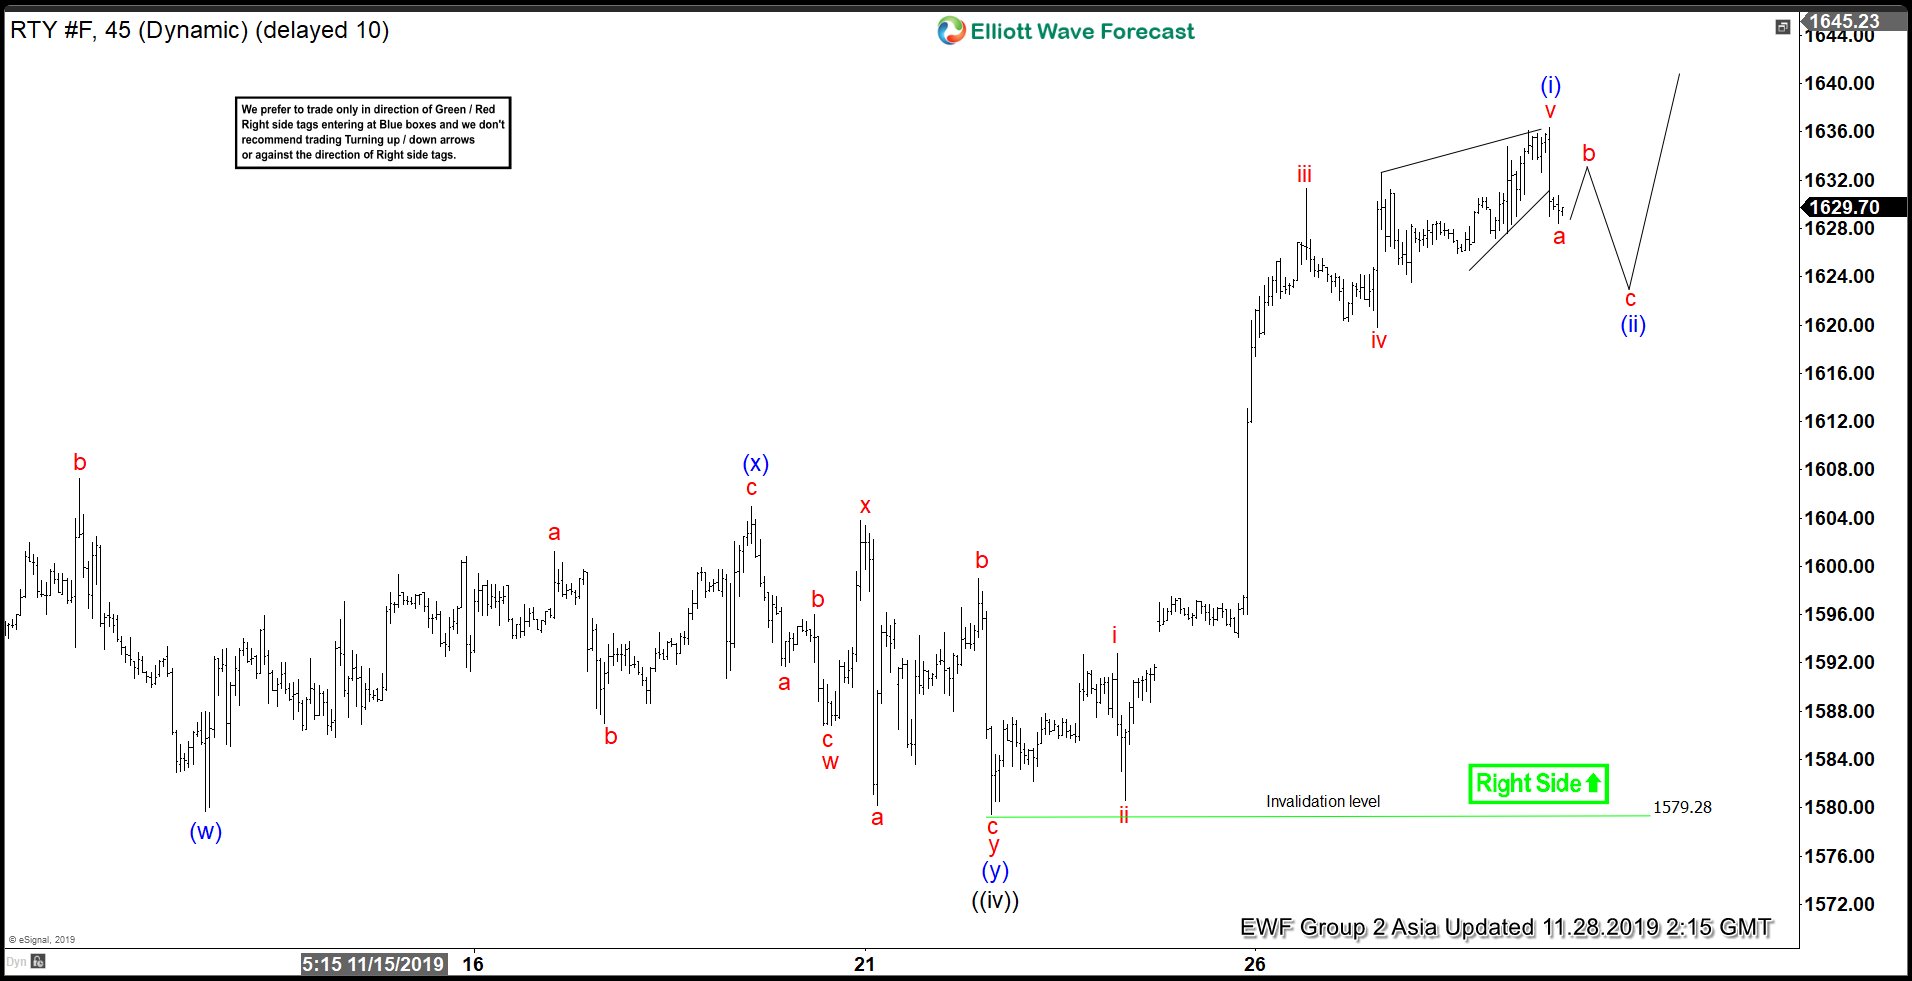
Elliott Wave View: Russell (RTY_F) Ending Wave 5
Read MoreRally in in Russell 2000 (RTY_F) from October 3, 2019 low is unfolding as 5 waves impulsive Elliott Wave structure. The chart below shows wave ((iv)) of the impulse ended at 1579.28. Index is currently within wave ((v)) before ending the cycle from October 3 low. Up from wave ((iv)), wave i ended at 1592.8 and wave ii […]
-
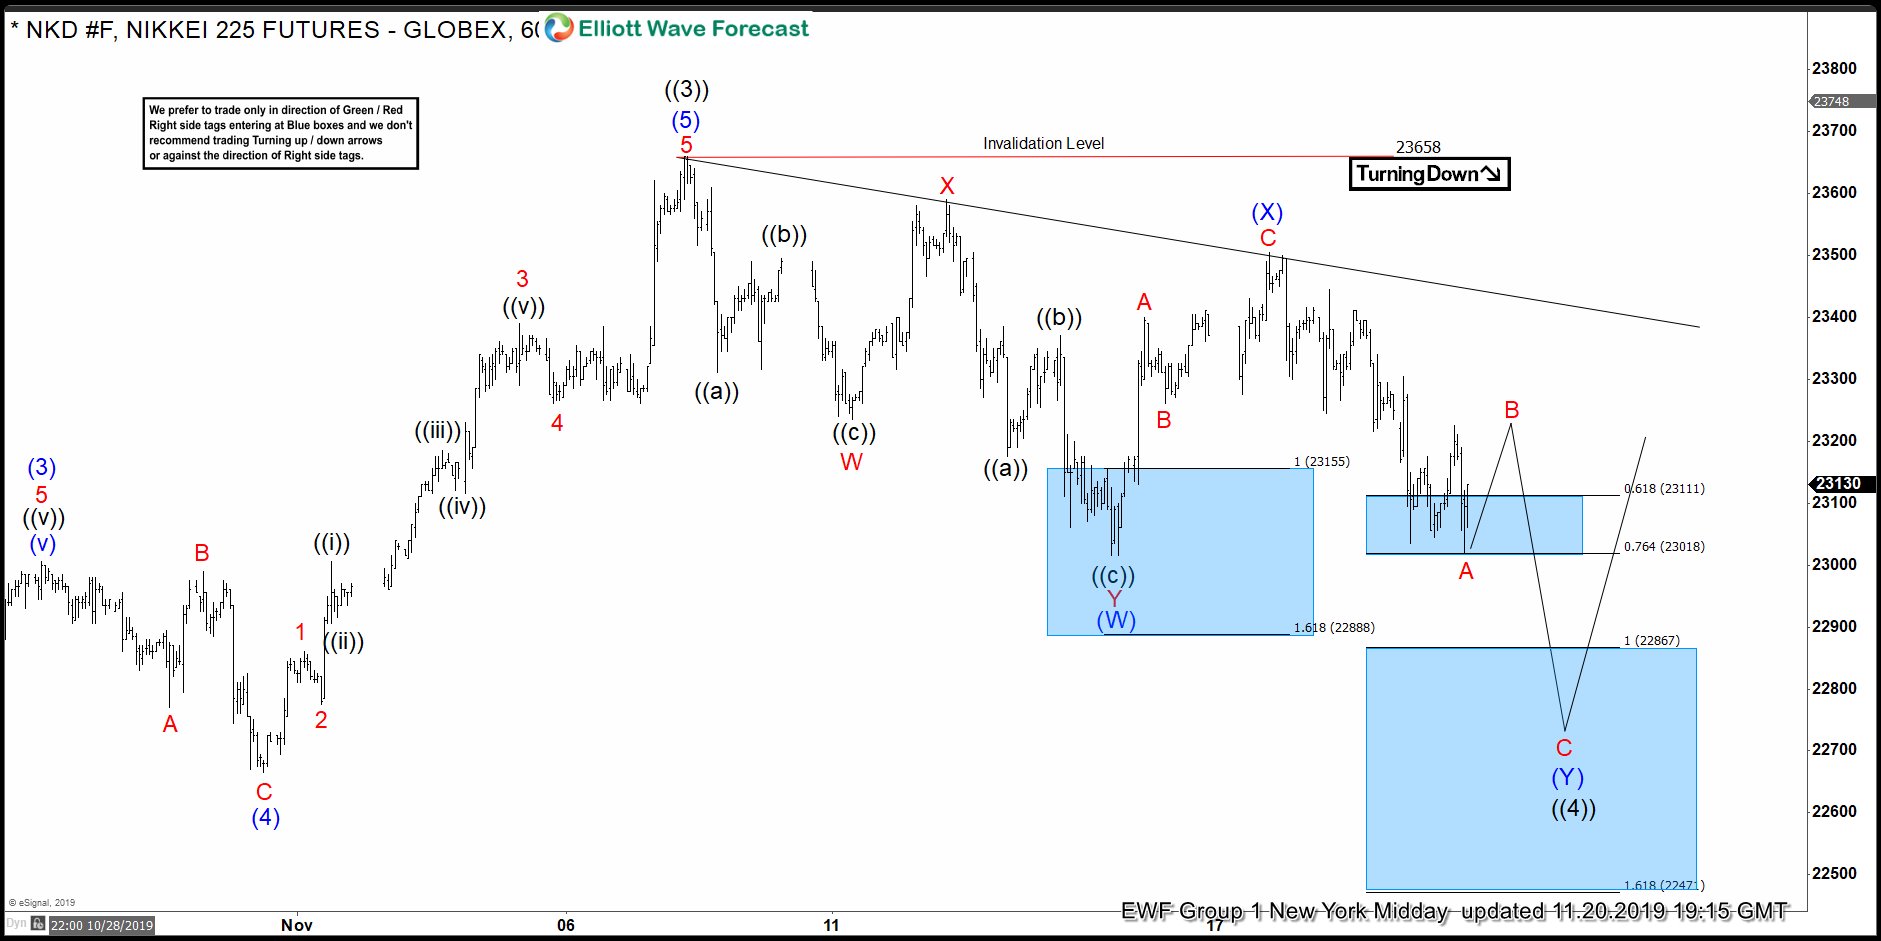
$NIKKEI Forecasting The Rally From The Blue Box
Read MoreHello fellow traders. NIKKEI has been very technical recently. The Futures was keep finding buyers at the Equal legs- Blue Box areas. We’re going to take a quick look at the Elliott Wave charts of NIKKEI published in the membership area of the elliottwave-forecast . NIKKEI ended cycle from the 22427 low as 5 waves […]
-
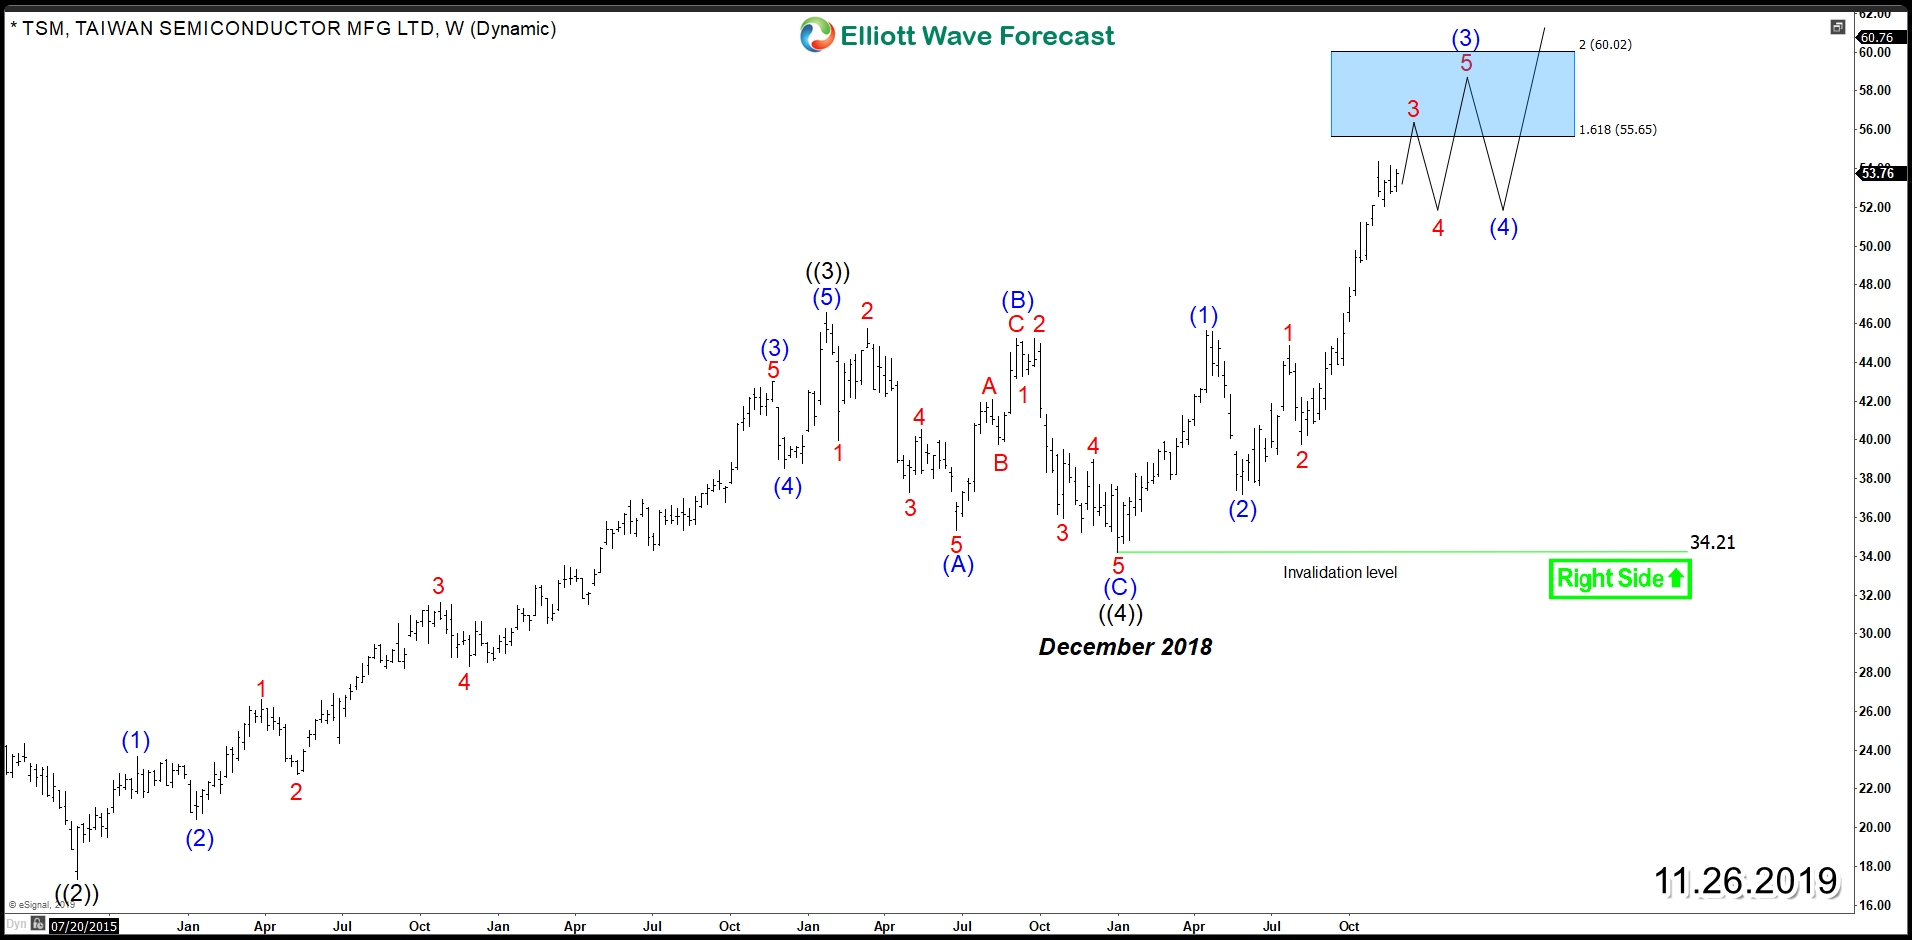
Taiwan Semiconductor (NYSE: TSM) Impulse Rally Calling More Upside
Read MoreTaiwan Semiconductor Manufacturing Company (NYSE: TSM) is the world’s largest dedicated independent (pure-play) semiconductor foundry and it’s located in the Hsinchu Science and Industrial Park in Hsinchu, Taiwan. In 2018, TSM spent the year in a corrective structure after it ended the 5 waves advance from 2015 low. The stock did correction unfolded as 3 waves Zigzag […]
-
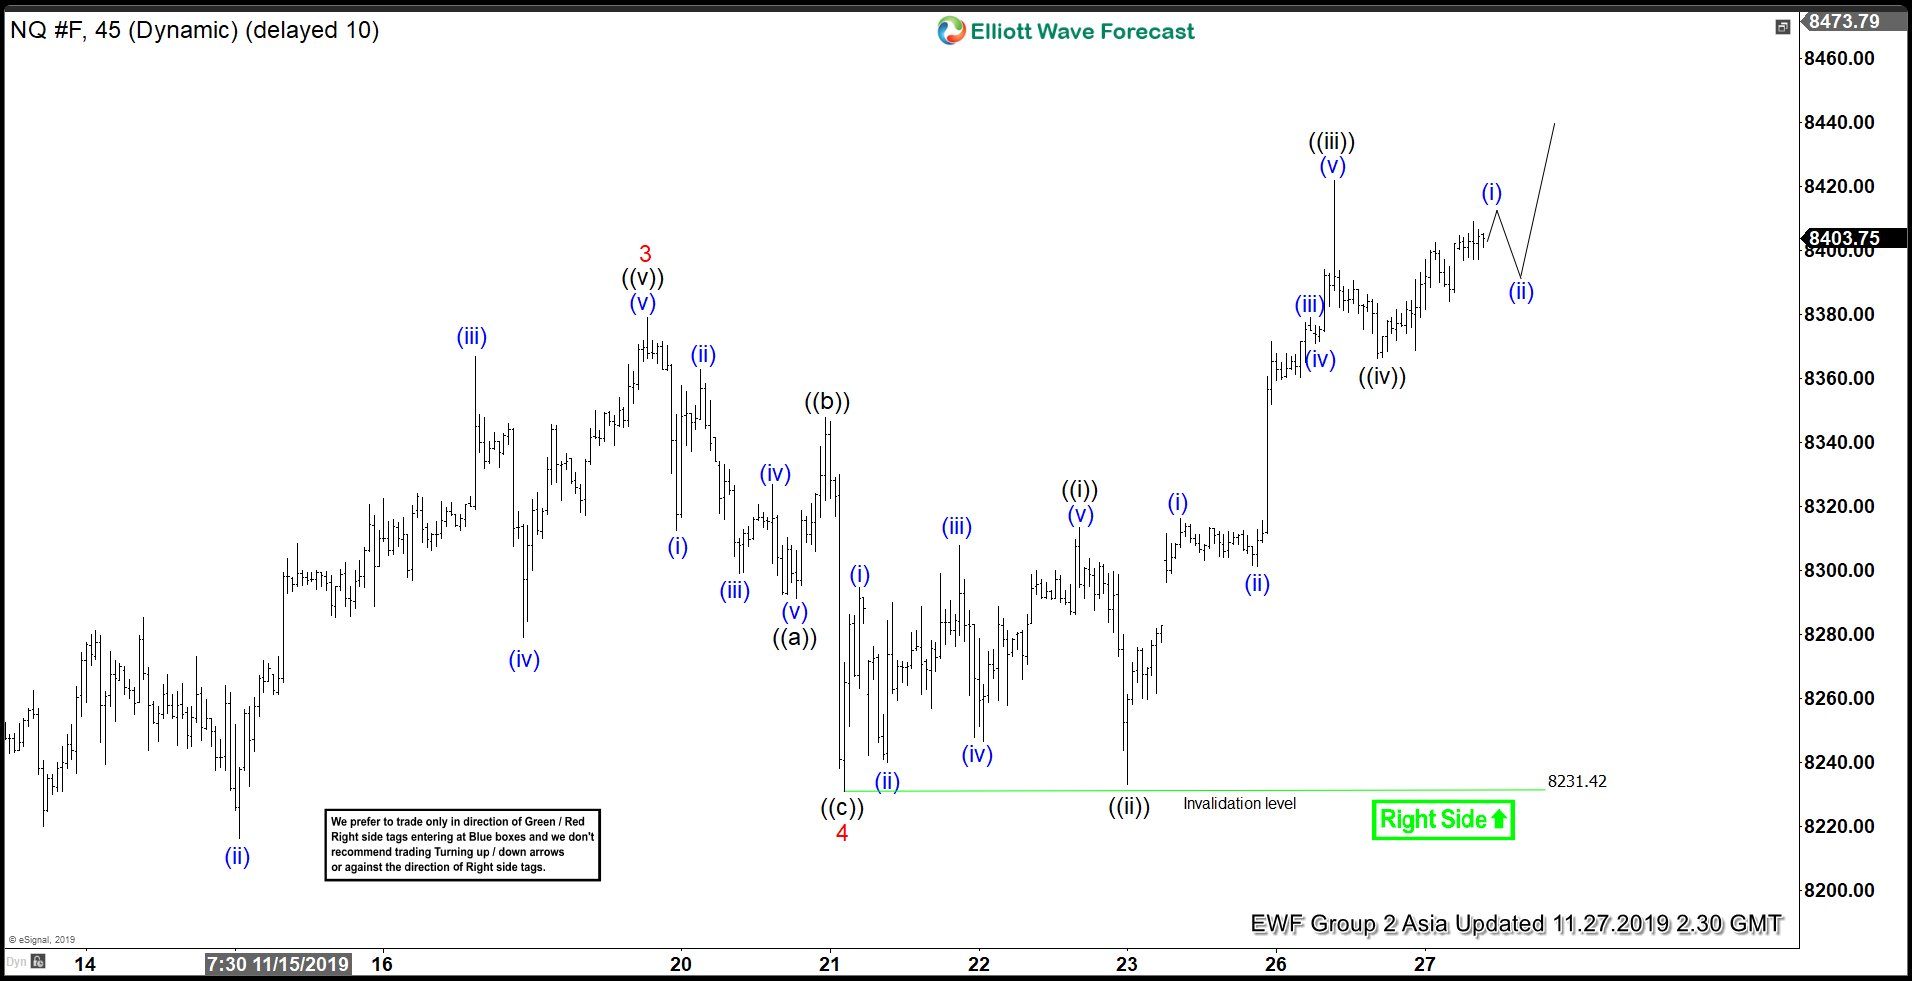
Elliott Wave View: Nasdaq (NQ_F) Extending Higher as Impulse
Read MoreElliott Wave View in Nasdaq (NQ_F) suggests that the rally from October 3, 2019 low is unfolding as 5 waves impulsive Elliott Wave structure. On the chart below, we can see wave 3 of the impulse from October 3 low ended at 8379. The pullback in wave 4 ended at 8231 as a zigzag Elliott Wave structure. Wave […]
-
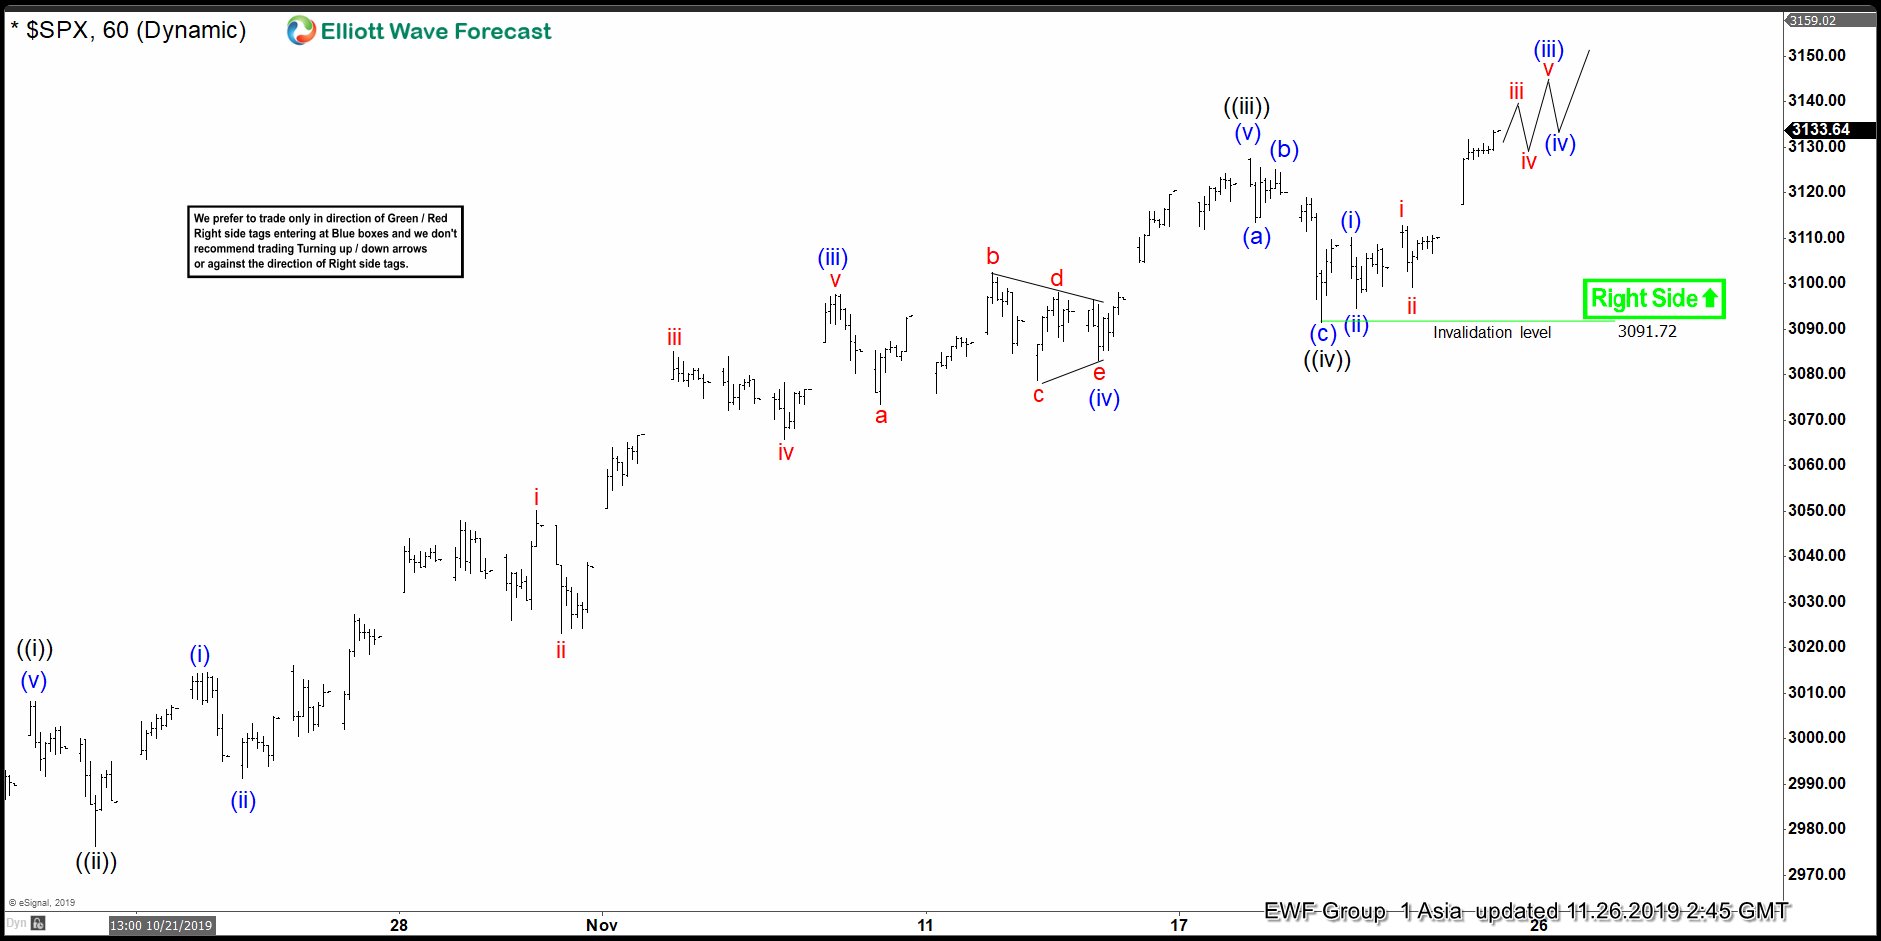
Elliott Wave View: Bullish Sequence Suggests Supported SPX
Read MoreSPX is showing 5 swings incomplete sequence from 12/26/2018 low suggesting dips should remain supported. This article & video show the Elliott Wave path.