
The Power of 3-7-11 and the Grand Super Cycle: How We Saw the Bullish Turn in April 2025 Back on April 9, 2025, while World Indices were dropping sharply and global sentiment had turned overwhelmingly bearish, we published an article that challenged the fear-driven narrative. We explained why selling was not the right approach and […]
-

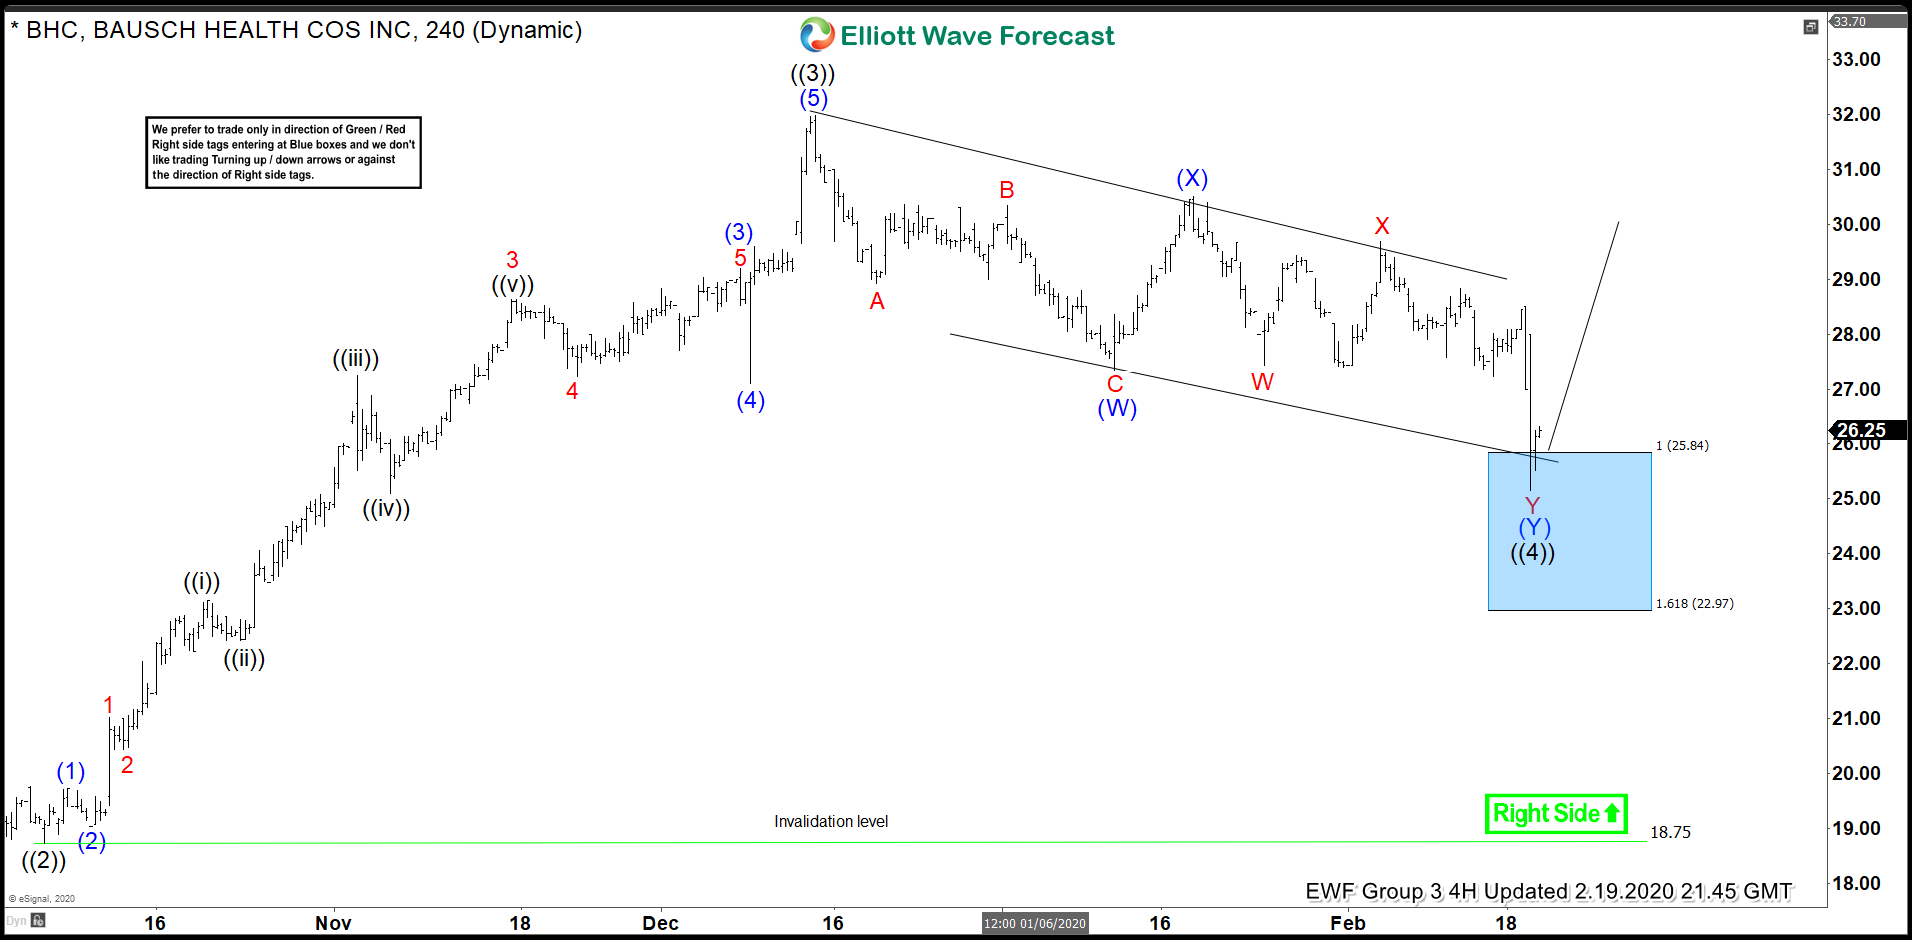
Bausch Health (BHC) Drops More than 10% After Q4 Results
Read MoreBausch Health (Ticker: BHC) reported Q4 revenue of $2.22 billion, which is a 5% YoY increase. The result was slightly higher than the consensus estimate of $2.2 billion. The company also reported a $1.51 billion net loss, or $4.3 per share using Generally Accepted Accounting Principle (GAAP). This is a significant drop compared to the […]
-

Elliott Wave View: NASDAQ (NQ_F) Continues Marching to All-Time High
Read MoreNasdaq continues to make all-time high & it should remain supported in 3, 7, 11 swing against Feb 18 low. This article looks at the Elliott Wave path.
-

Elliott Wave View: PayPal (PYPL) Right Side Remains Bullish
Read MoreAs US indices were making lower lows in January and February of 2019, PYPL was making higher lows setting up a bullish structure within a larger impulse up against its All Time Low of 30.00 set on 8/24/15. Taking a look at the 4h chart on PYPL, we favour that there is a wave ((3)) […]
-

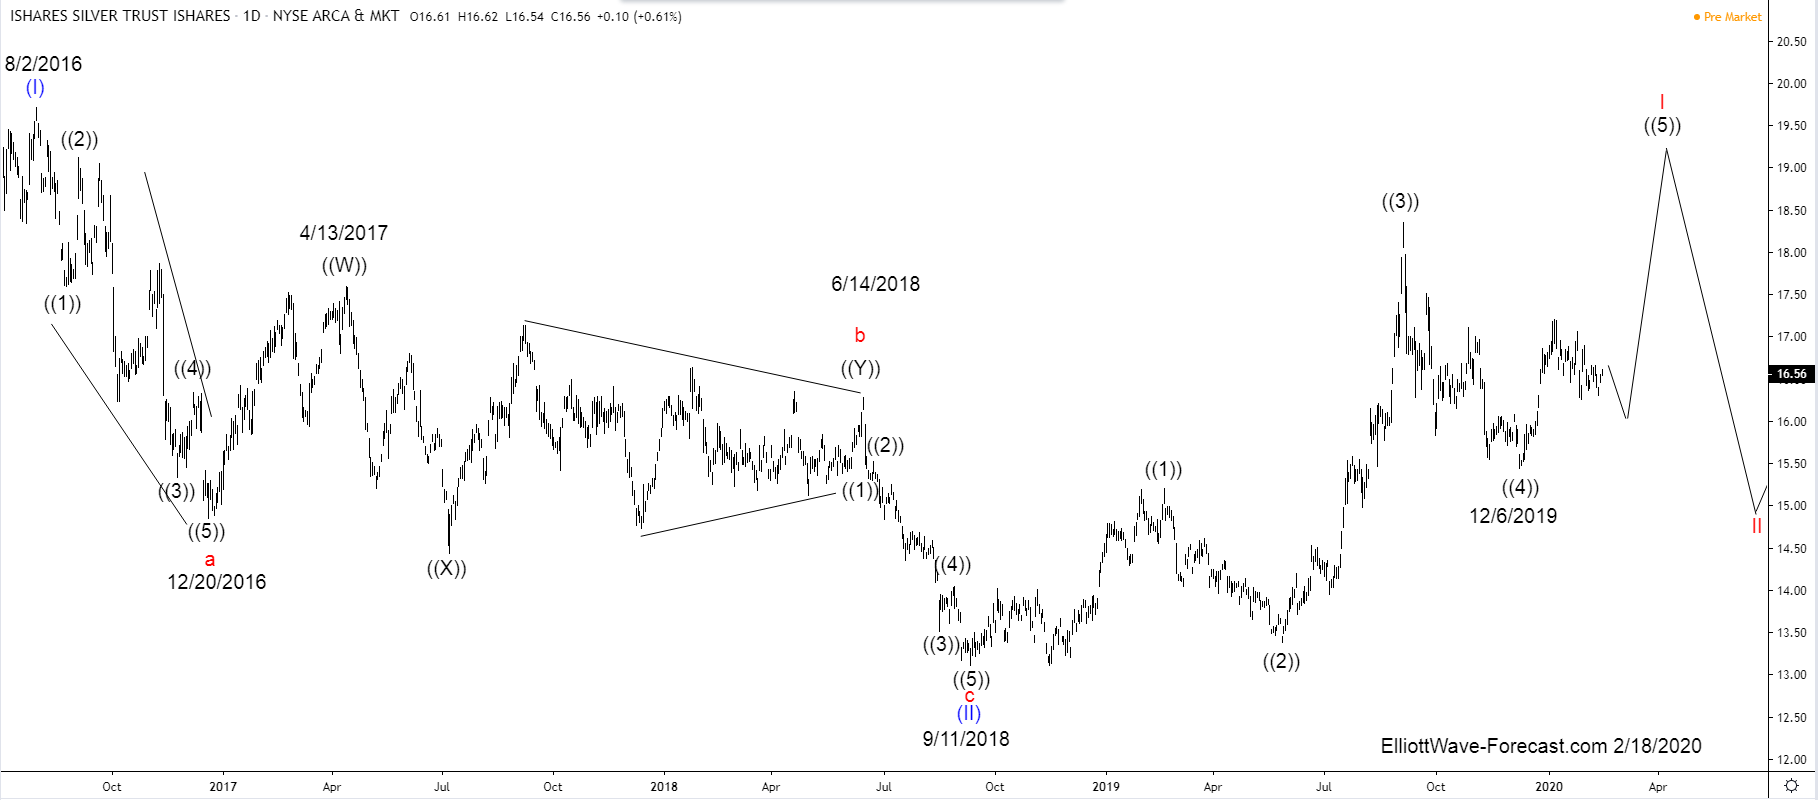
$SLV Ishares Silver Trust Larger Cycles and Elliott Wave
Read More$SLV Ishares Silver Trust Larger Cycles and Elliott Wave Firstly there is data back to when the ETF fund began in 2006 as seen on the weekly chart shown below. The fund made a low in 2008 that has not since been taken out in price. There is no Elliott Wave count on that weekly chart. […]
-

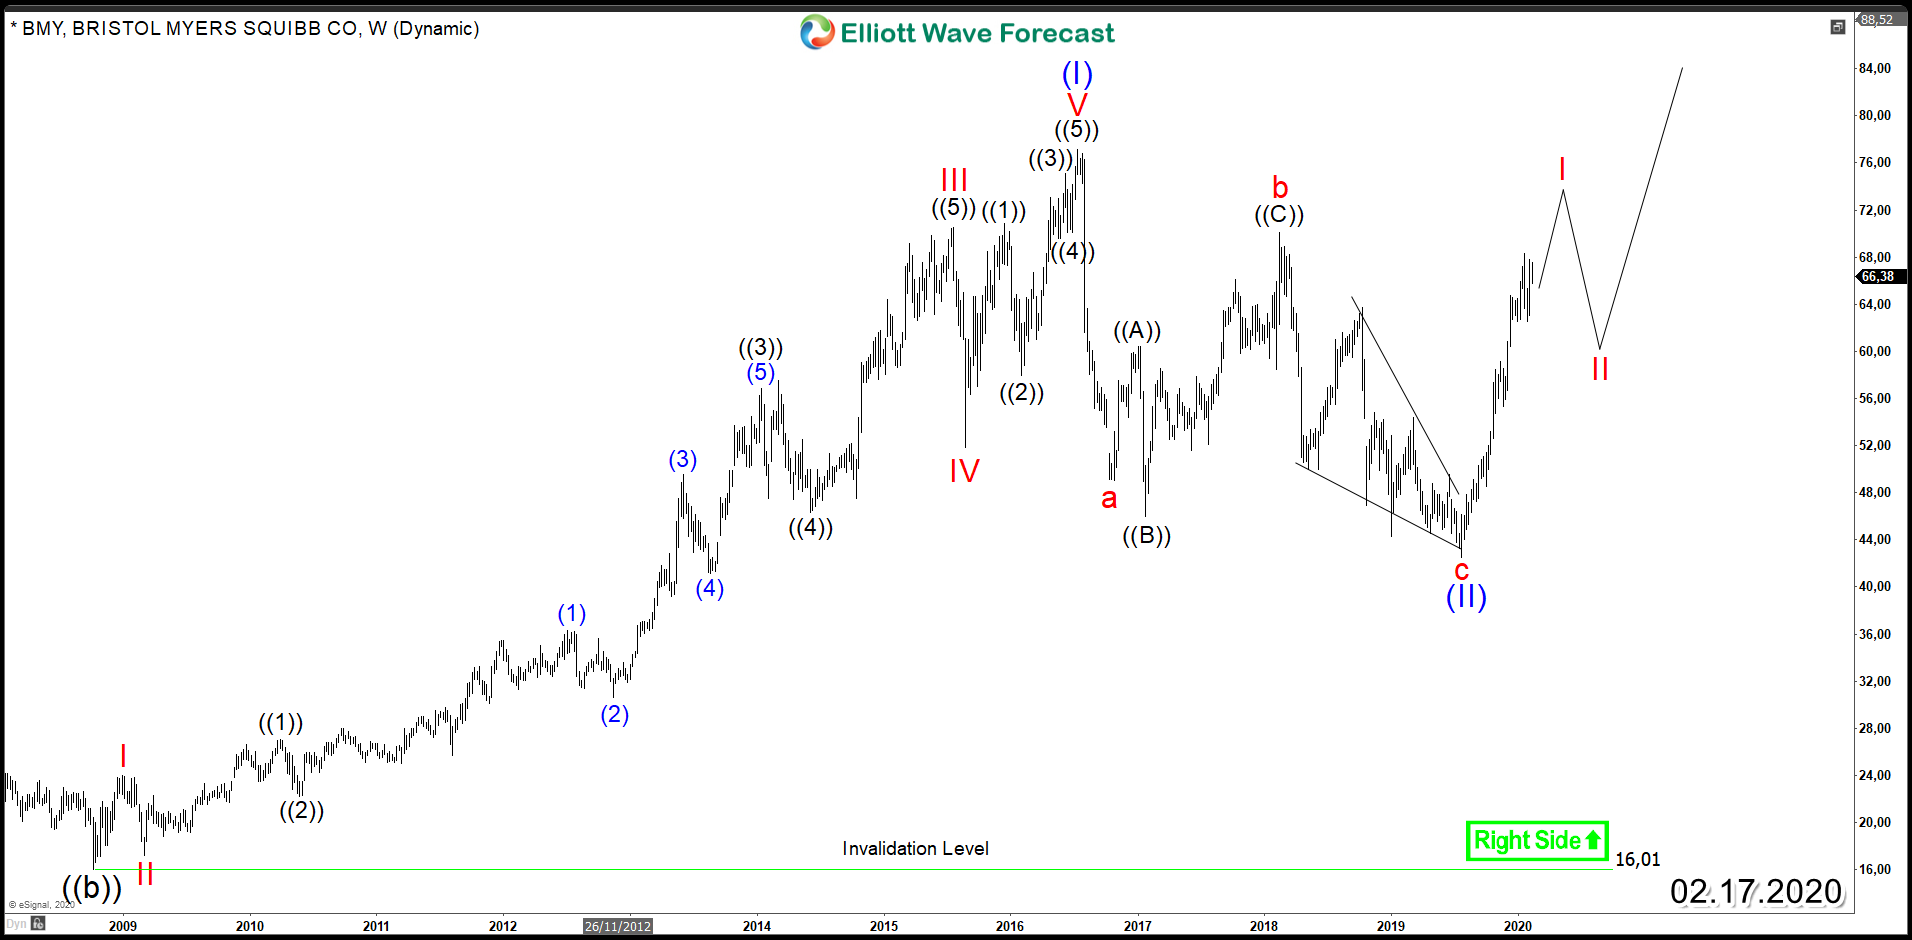
Bristol-Myers Squibb ( NYSE: BMY ) Aiming for New All Time Highs
Read MoreBristol-Myers Squibb (NYSE: BMY) is an American pharmaceutical company which manufactures prescription pharmaceuticals and biologics in several therapeutic areas with particular success in cardiovascular treatments. Since 2008, BMY established an impulsive rally taking the stock to new all time highs after it managed to break above 1999 peak which opened a multi-year bullish sequence. The cycle lasted for […]
-

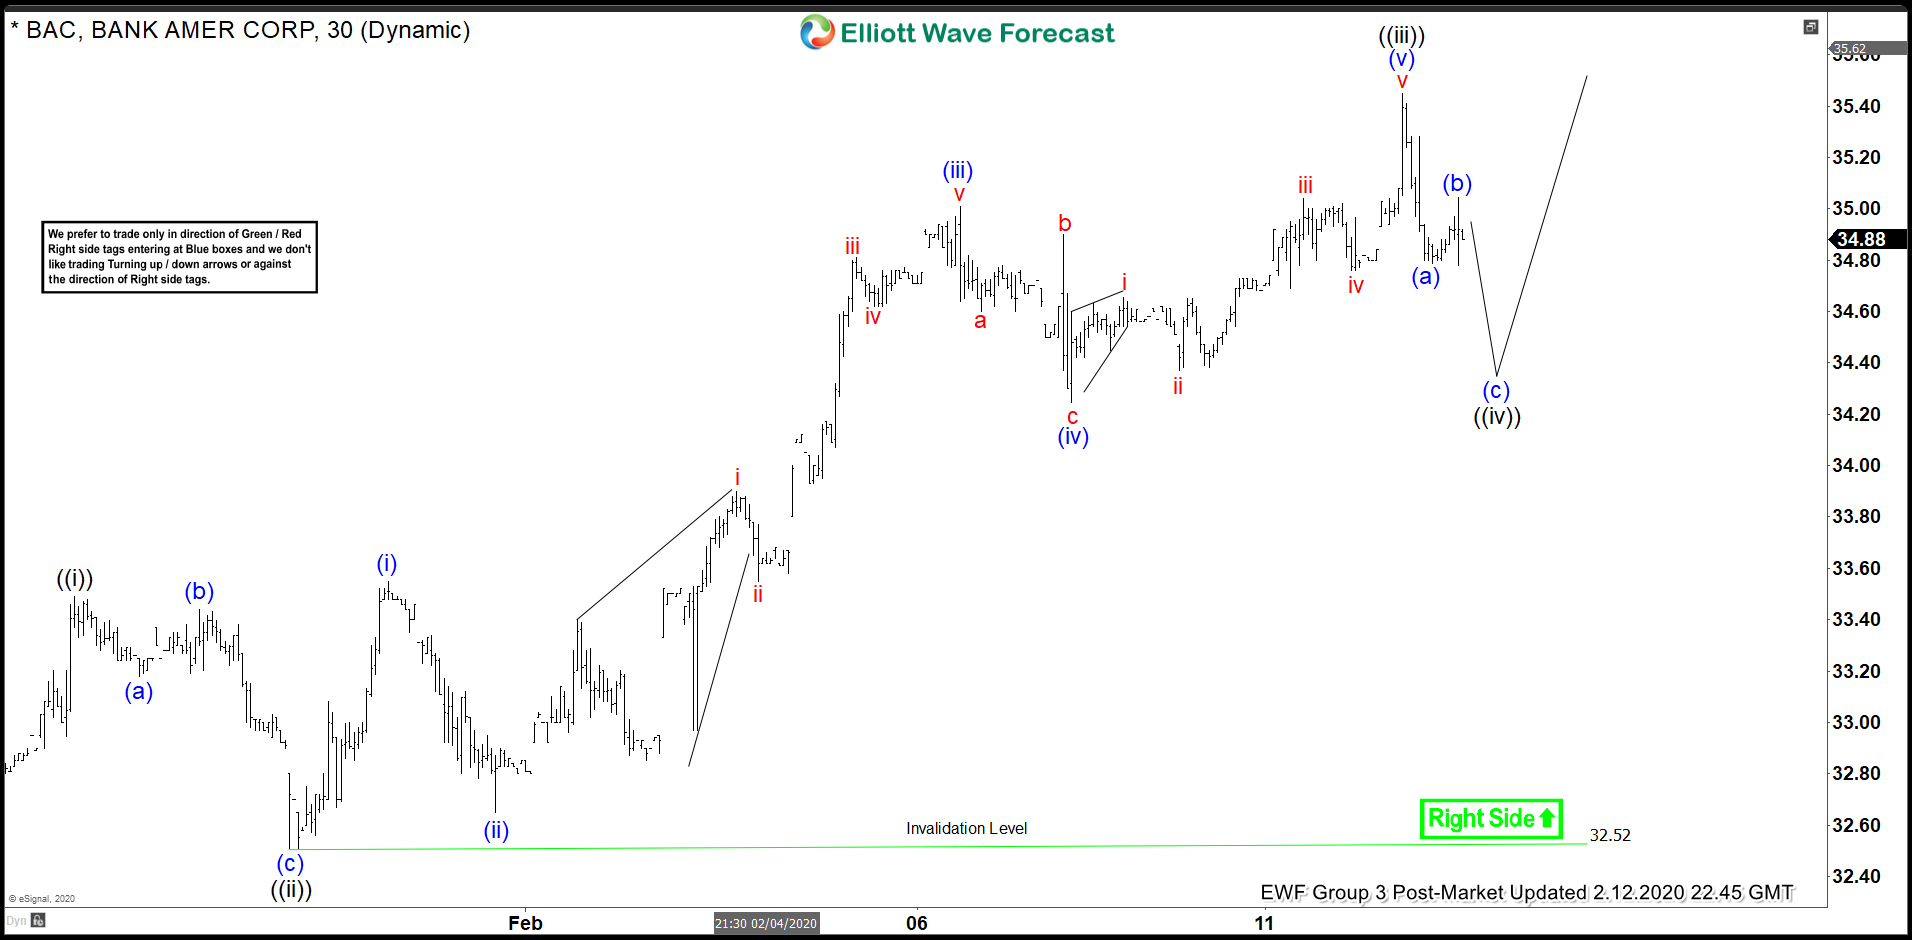
Elliott Wave View: Bank of America (BAC) Approaching Short Term Support
Read MoreShort term Elliott wave view in Bank of America (ticker: BAC) suggests the rally from January 27, 2020 low is unfolding as a 5 waves impulse Elliott Wave structure. Up from January 27 low, wave ((i)) ended at 33.49 and pullback in wave ((ii)) ended at 32.52. The stock has resumed higher in wave ((iii)) […]