

The Power of 3-7-11 and the Grand Super Cycle: How We Saw the Bullish Turn in April 2025 Back on April 9, 2025, while World Indices were dropping sharply and global sentiment had turned overwhelmingly bearish, we published an article that challenged the fear-driven narrative. We explained why selling was not the right approach and […]
-
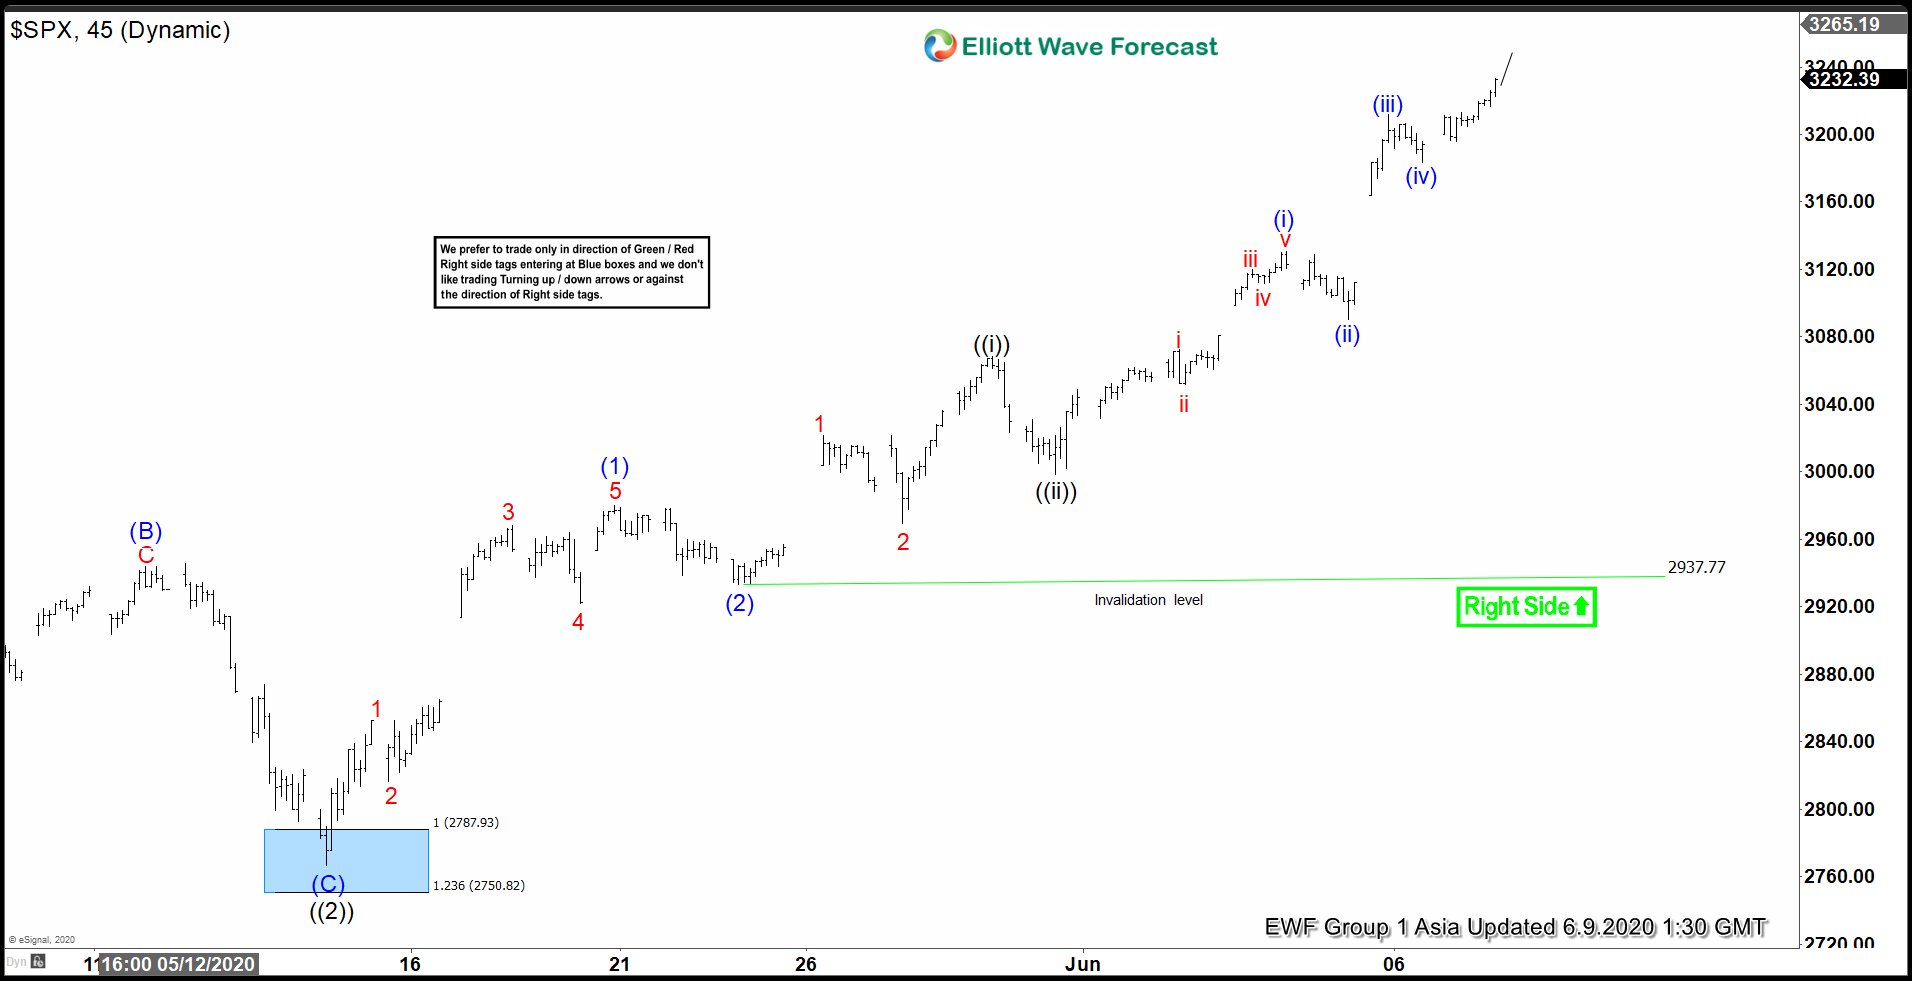
Elliott Wave View: SPX Should Extend Higher
Read MoreCycle from March 23, 2020 low remains in progress in $SPX & the Index should see further strength. This article and video look at the Elliott wave path.
-
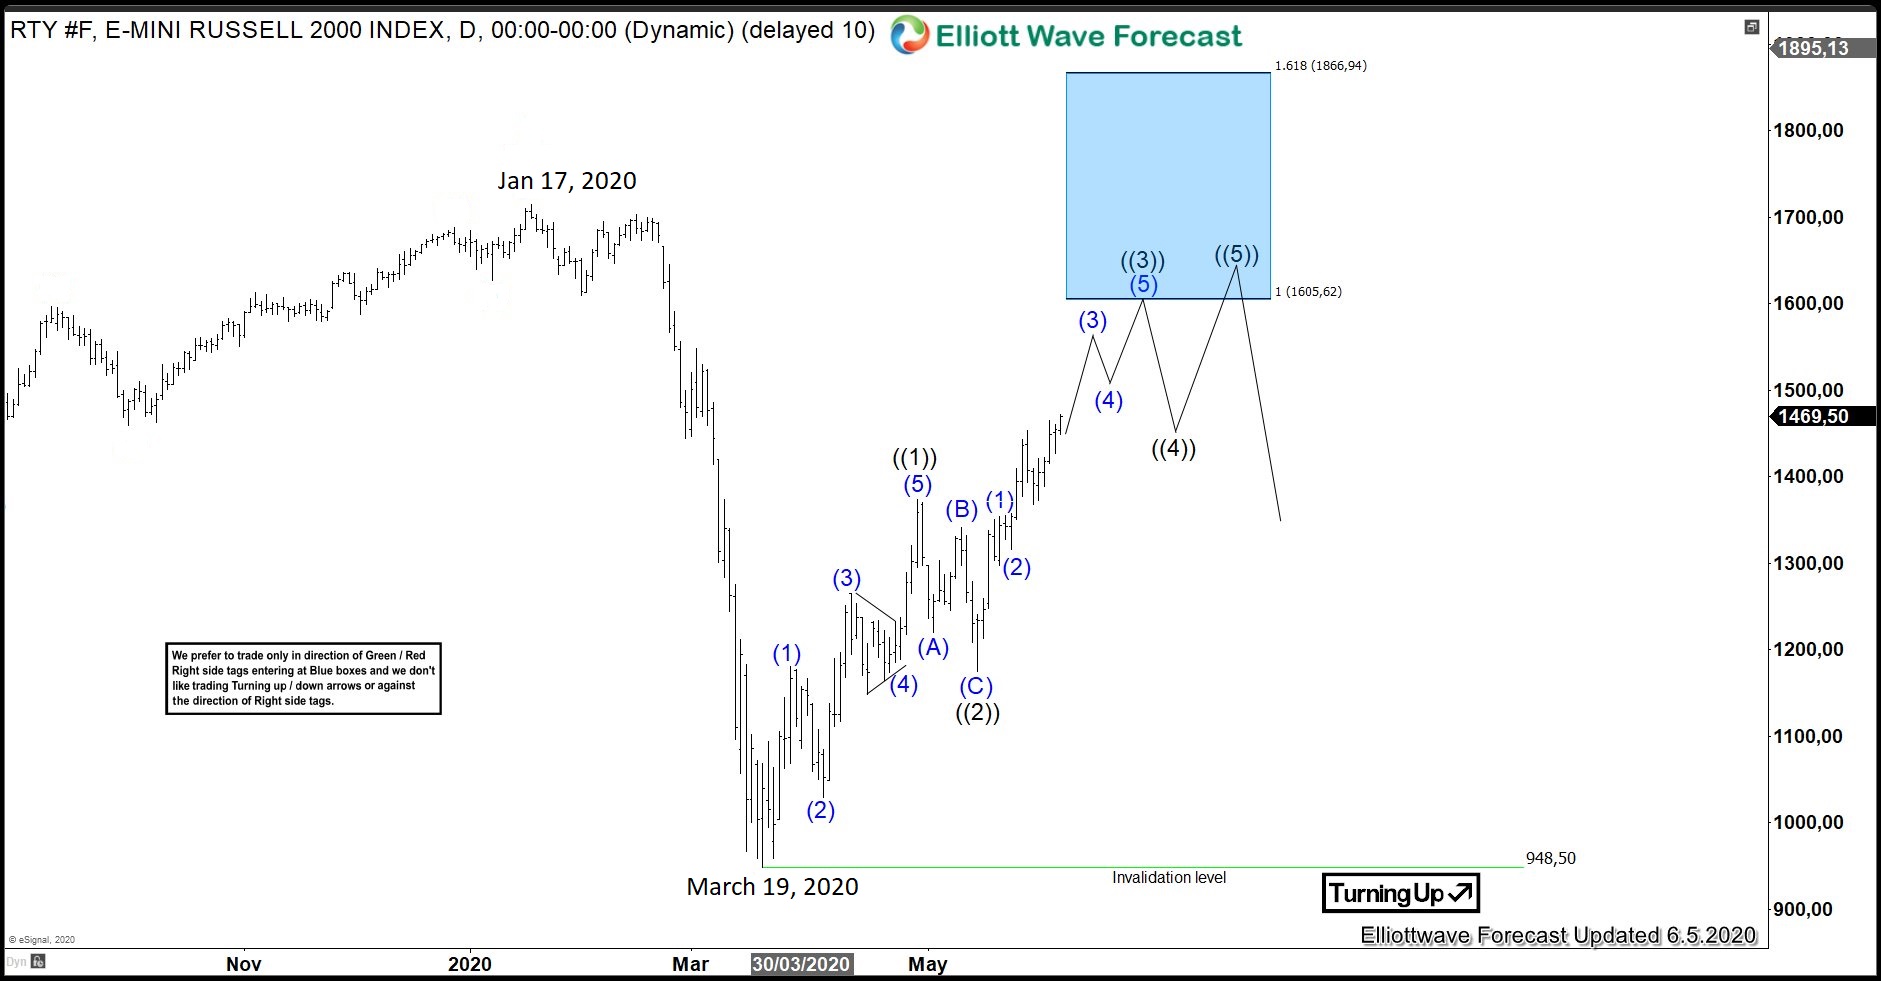
More Upside For RTY_F (Russell 2000) In The Near Term
Read MoreIn this blog, we are going to take a look at the Elliottwave chart of RTY_F. Daily chart below shows that RTY_F ended the decline from January 17, 2020 high at 948.50 low. Since reaching that March 19 low, the index has continued to extend higher. From 948 low, the index extended higher in wave […]
-
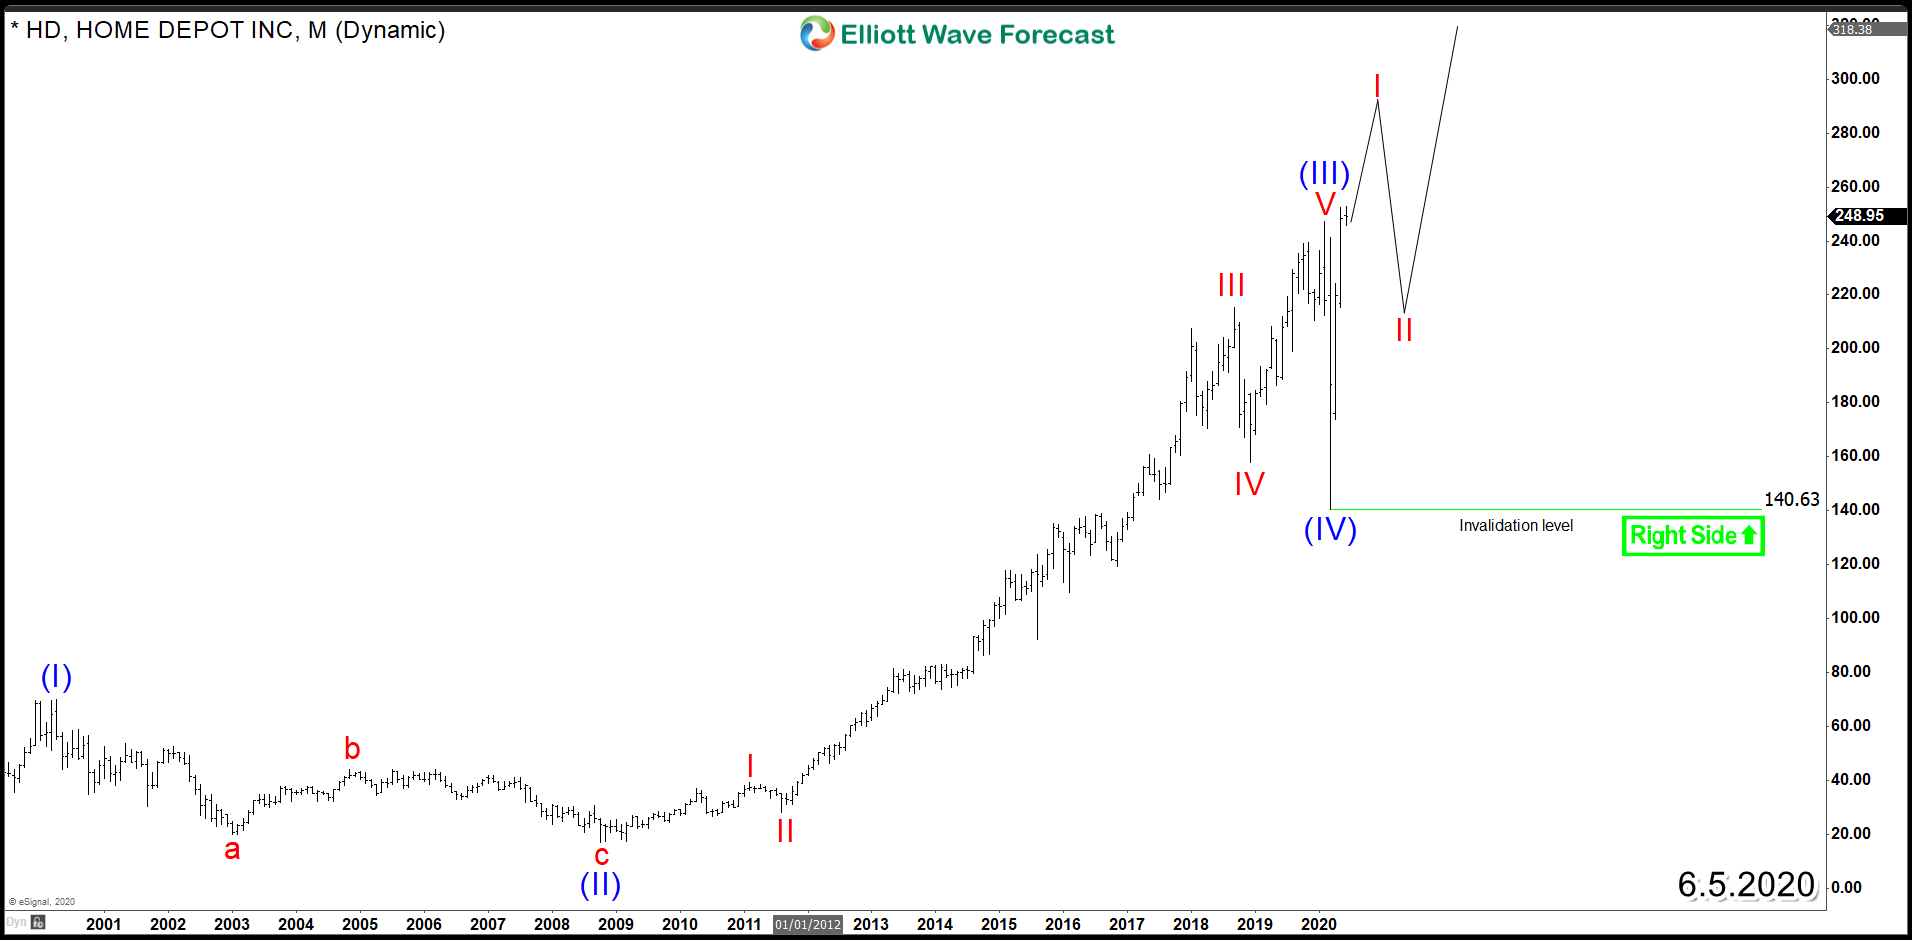
Home Depot (NYSE: HD) Next Investment Opportunity
Read MoreThe world largest home improvement retailer Home Depot (NYSE: HD) sales growth doubled its pace from the prior quarter despite reduced operating hours and cancelled promotions because of the COVID-19 pandemic which pressured most of the retail industry. Early this year, HD ended the cycle from 2008 low and did a sharp 40% drop along side the rest of the market. […]
-
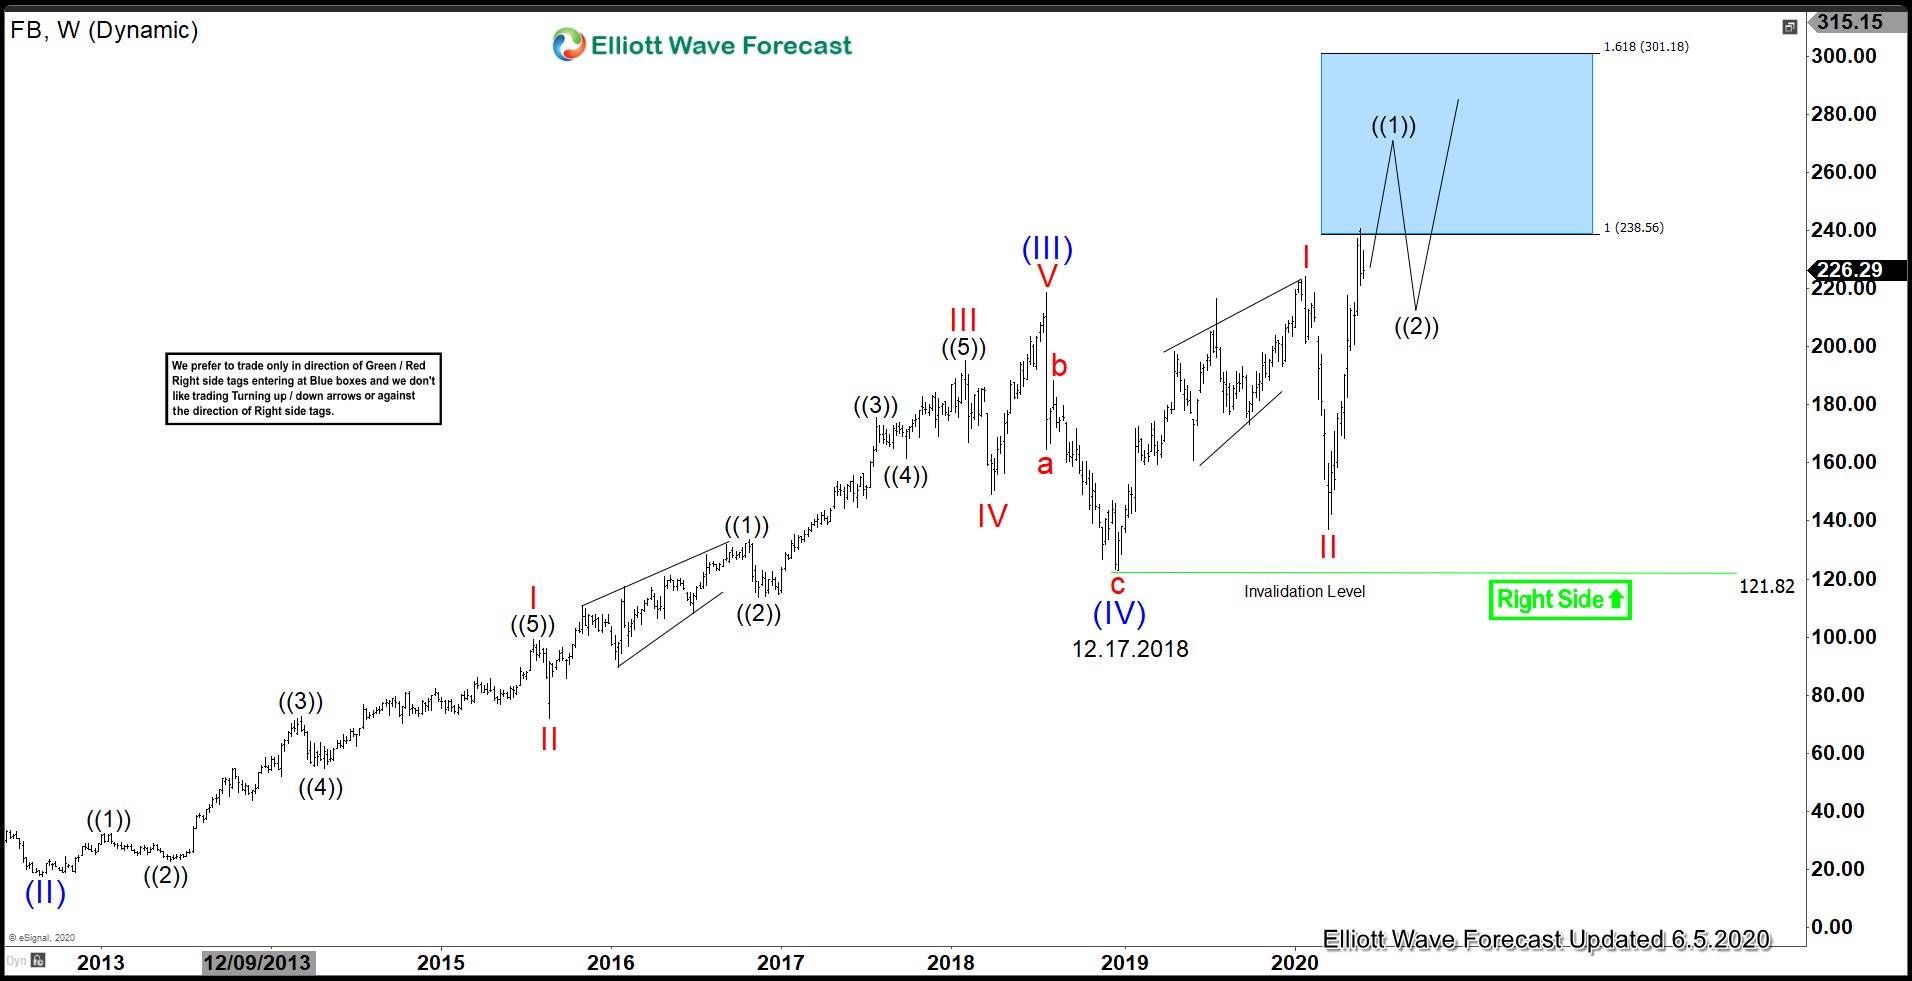
Rally in Facebook Should Continue
Read MoreThe coronavirus pandemic has been a boon to social media, streaming, and online shopping companies. As government around the world recommends social distancing and people reduce unnecessary travel, they spend more time at home consuming social media and streaming content. More people also shop their daily necessities online. One of the beneficiaries of the Covid-19 […]
-
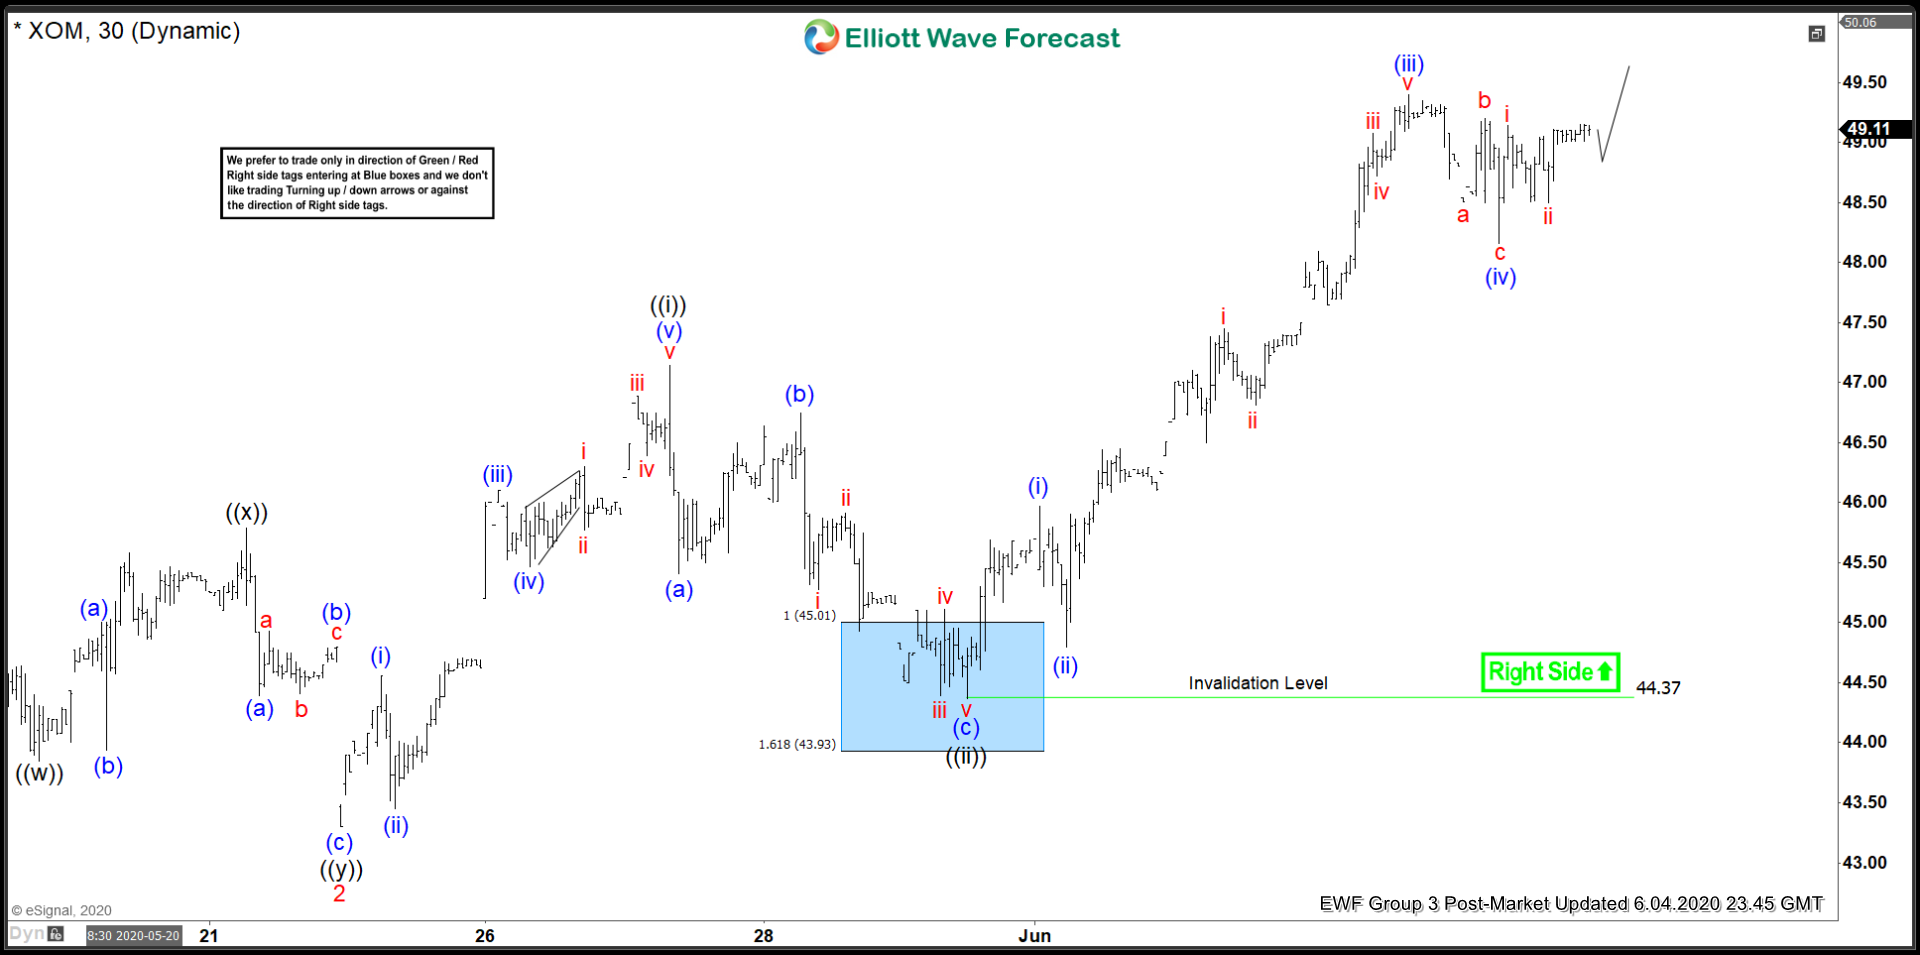
Elliott Wave View: Further Strength in Exxon Mobil
Read MoreExxon Mobil (XOM) shows incomplete sequence from 3.23.2020 low favoring more upside. This article and video look at the Elliott Wave path.
-
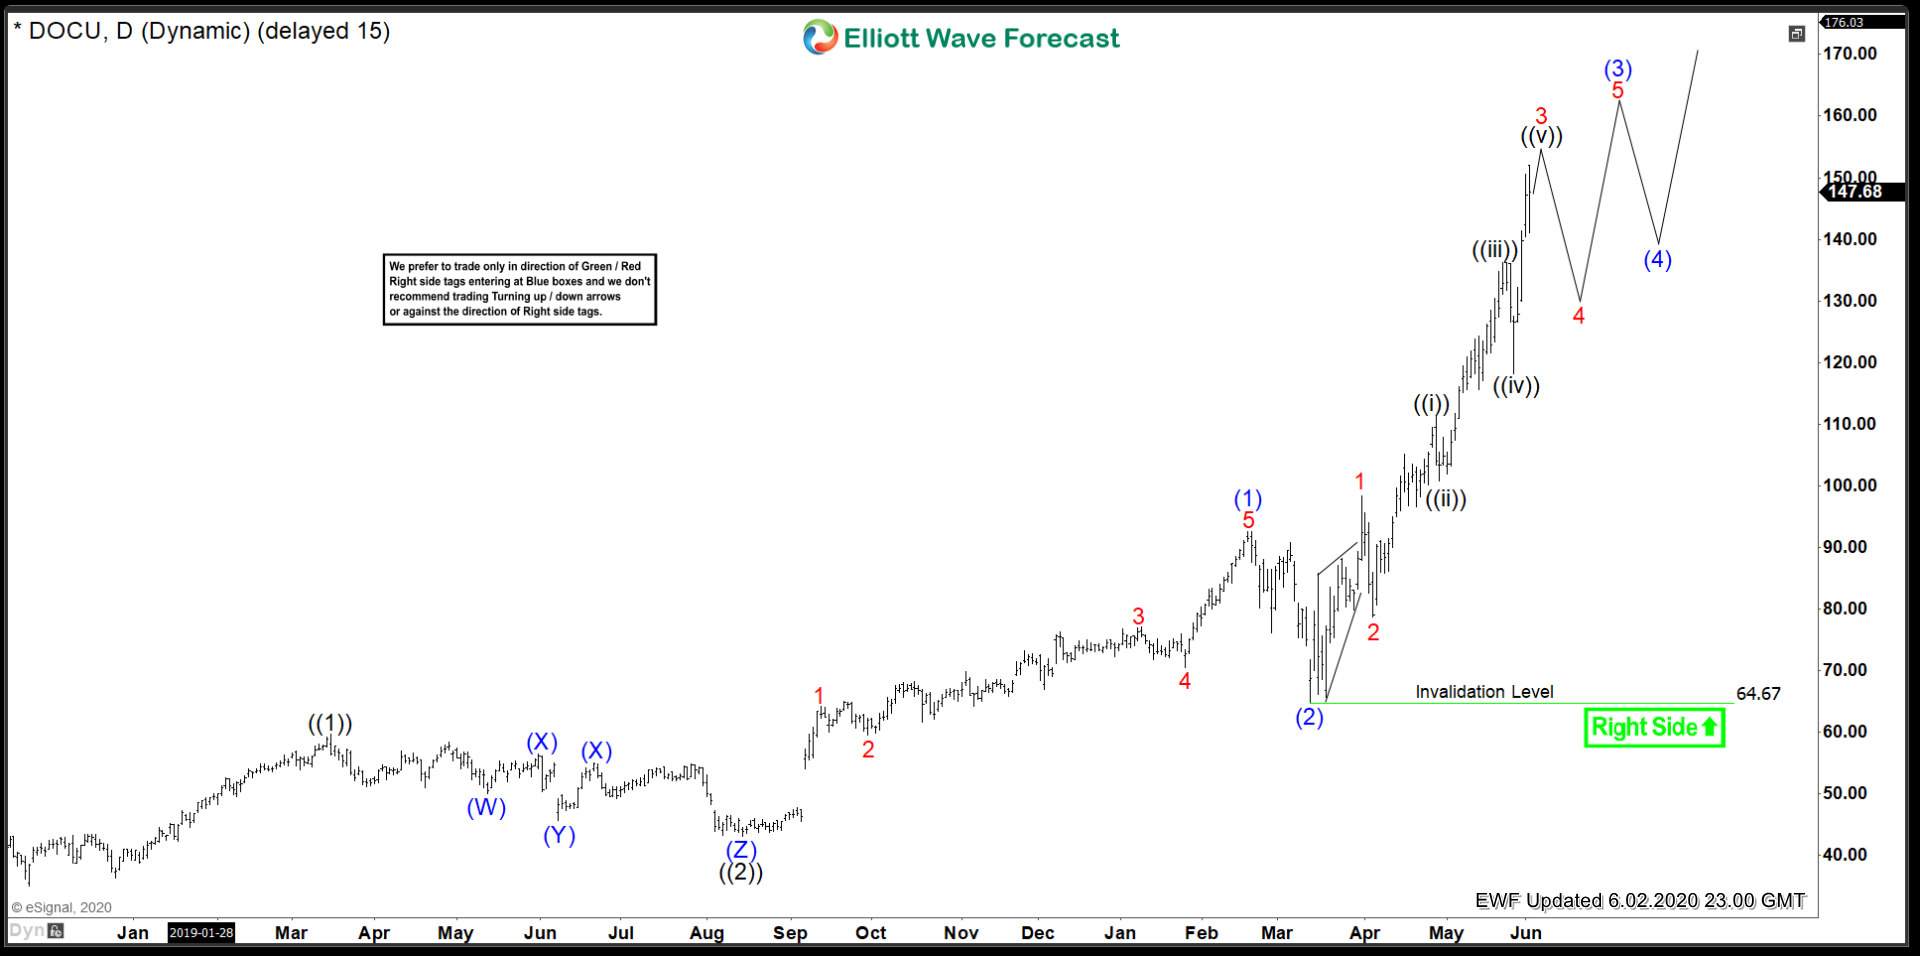
DocuSign ($DOCU) Bulls In Control
Read MoreThe next entry in the theme of Corona Virus stocks is DocuSign. Biotech is not the only sector benefitting greatly from the COVID-19 oubreak, software is also making huge gains in some stocks. I am finding new software companies every single day that are making new All Time Highs. $DOCU has been on a monster […]