

The Power of 3-7-11 and the Grand Super Cycle: How We Saw the Bullish Turn in April 2025 Back on April 9, 2025, while World Indices were dropping sharply and global sentiment had turned overwhelmingly bearish, we published an article that challenged the fear-driven narrative. We explained why selling was not the right approach and […]
-
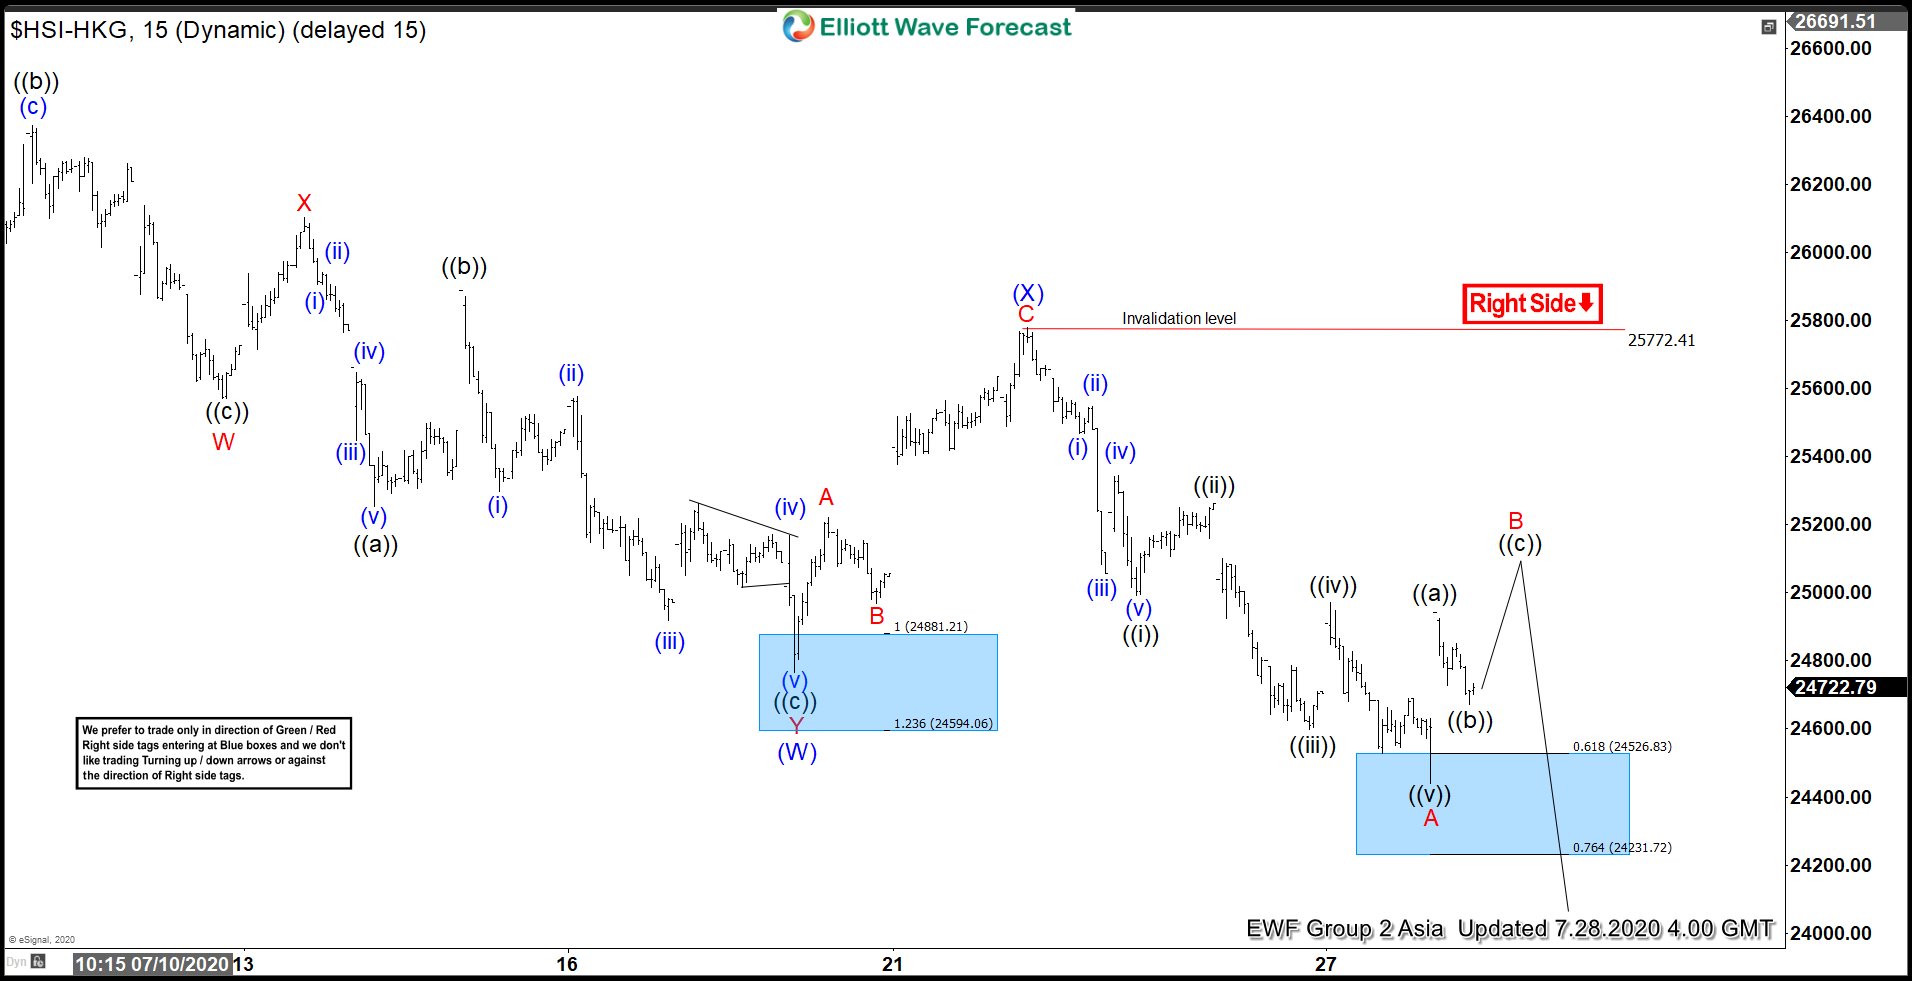
Elliott Wave View: Hang Seng Index Correction In Progress
Read MoreHang Seng extended lower from July 7 high as double three structure. While below July 22 high, the Index can still extend lower
-

$GLNCY : Glencore may be preparing for a big move
Read MoreGlencore plc is a British commodity trading and mining company. Marc Rich has founded the company 1974 which has its headquarters in Baar, Switzerland. Traded under tickers $GLEN at LSE and $GLNCY in US in form of ADRs, it is a component of the FTSE100 index. Glencore plc dominates the copper and zinc trading markets. […]
-
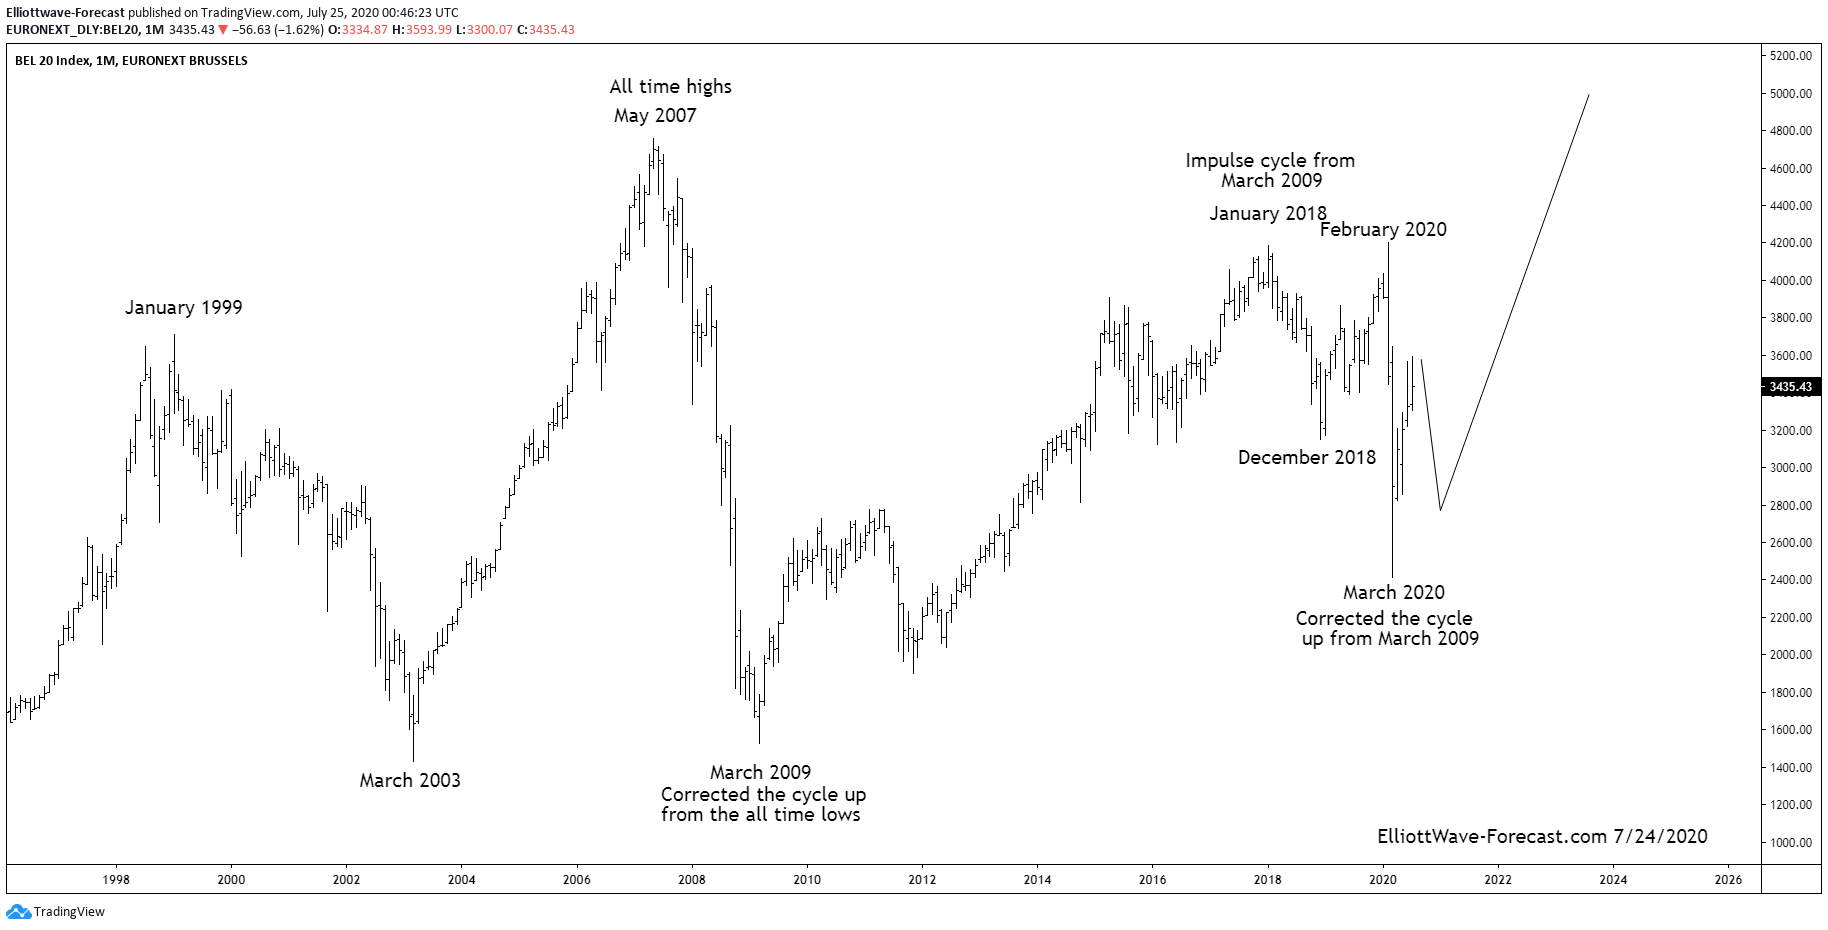
The BEL20 Index Longer Term Swings and Cycles
Read MoreThe BEL20 Index Longer Term Swings and Cycles Firstly the BEL20 Index has trended higher with other world indices since the benchmark was established. The index remained in a long term bullish trend cycle into the May 2007 highs. From there it made a sharp correction lower that lasted until March 2009 similar to other world […]
-
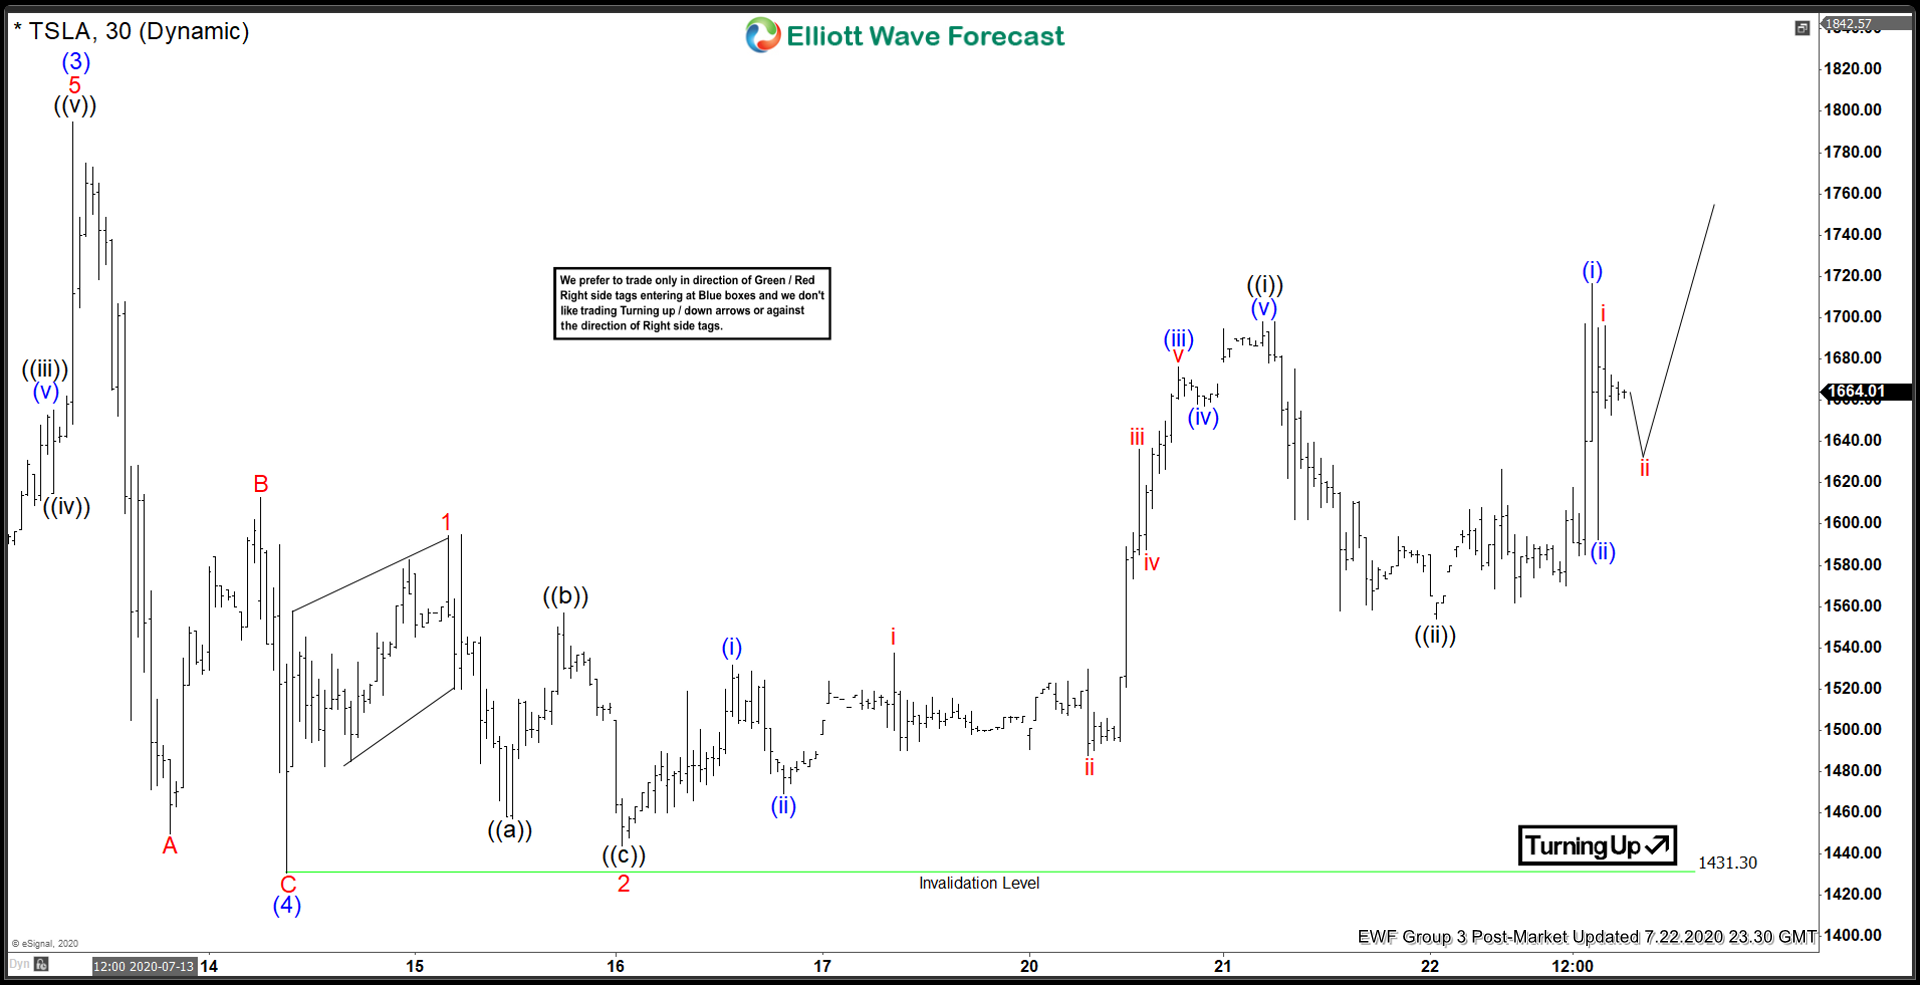
Elliott Wave View: Tesla (TSLA) Aiming for All-Time High
Read MoreTSLA ended the pullback from July 13 high and resumed higher. While above July 14 low, expect dips in 3, 7, or 11 swings to find support.
-
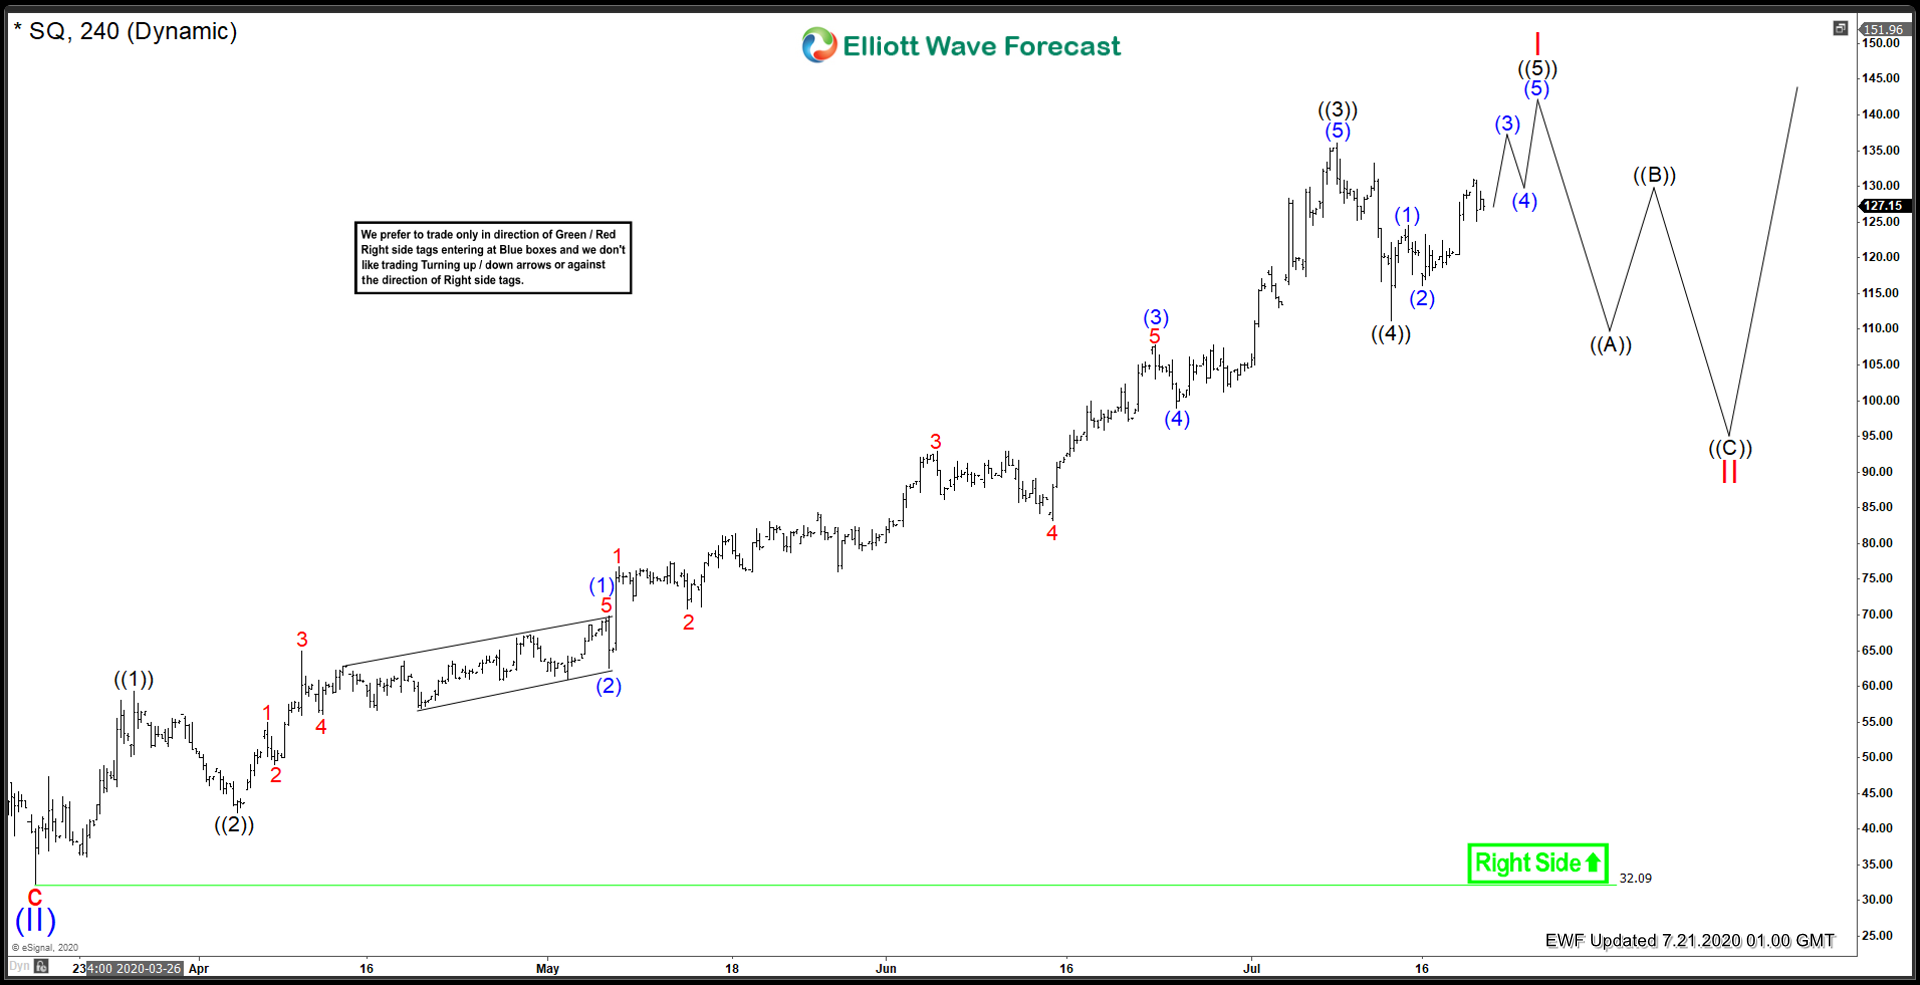
Square Inc. ($SQ), Larger degree top looms
Read MoreThe Corona Virus has had its toll on the marketplace in general. But some select names have rallied sharply off the March 2020 lows, Square is one of those names. Square has rallied from a low of 32.33 to a high of 133.81 recently. Lets take a look at what the company does: “Square, Inc. is […]
-

Gold Miners Junior (GDXJ) Breaks 7 Year Base
Read MoreGold prices continue to extend higher as the EU sets to announce a historic €750 billion coronavirus stimulus. The US Congress is also debating for a new aid package to counter the economic effects of the pandemic. With all the unprecedented fiscal and monetary stimulus, market once again seems to expect inflation to make a return. […]