

The Power of 3-7-11 and the Grand Super Cycle: How We Saw the Bullish Turn in April 2025 Back on April 9, 2025, while World Indices were dropping sharply and global sentiment had turned overwhelmingly bearish, we published an article that challenged the fear-driven narrative. We explained why selling was not the right approach and […]
-
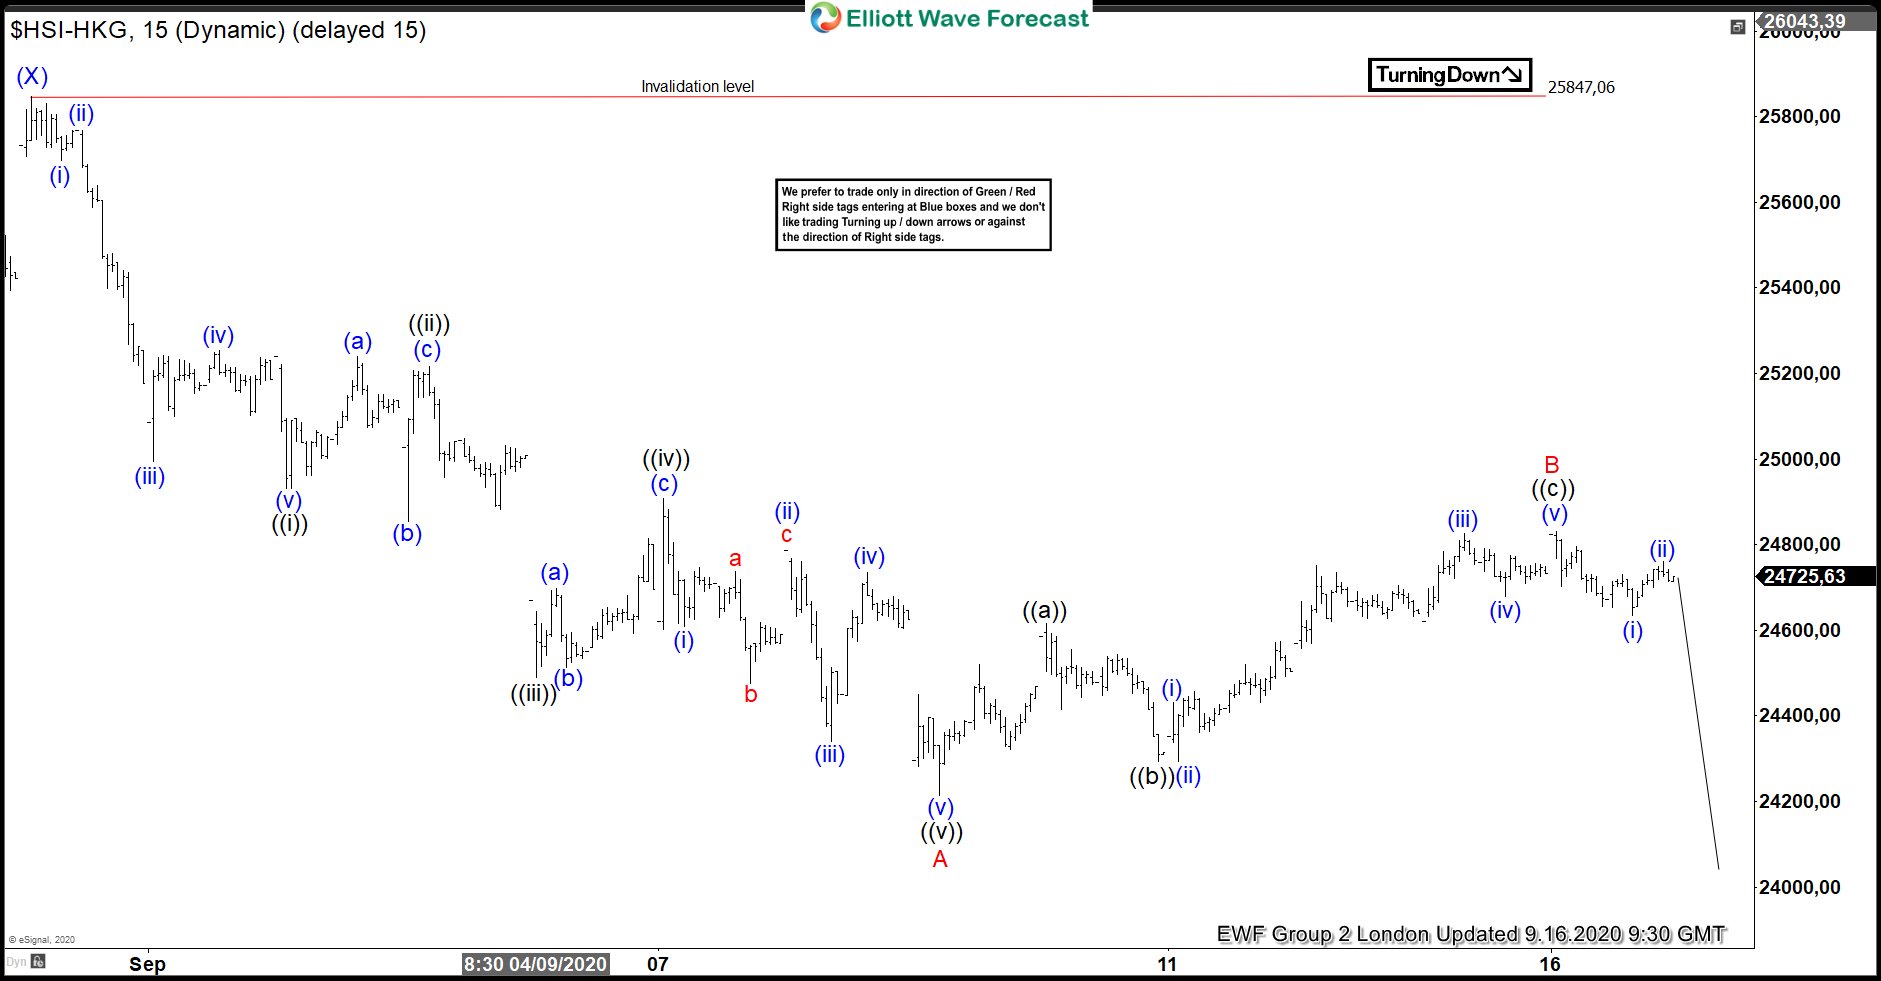
Hang Seng ( $HSI_HKG ) Forecasting The Decline
Read MoreHello fellow traders. In this technical blog we’re going to take a quick look at the charts of Hang Seng published in members area of the website. As our members know, Hang Seng has given us a decent pull back recently. We got decline within the cycle from the July 6th peak ,when the price […]
-
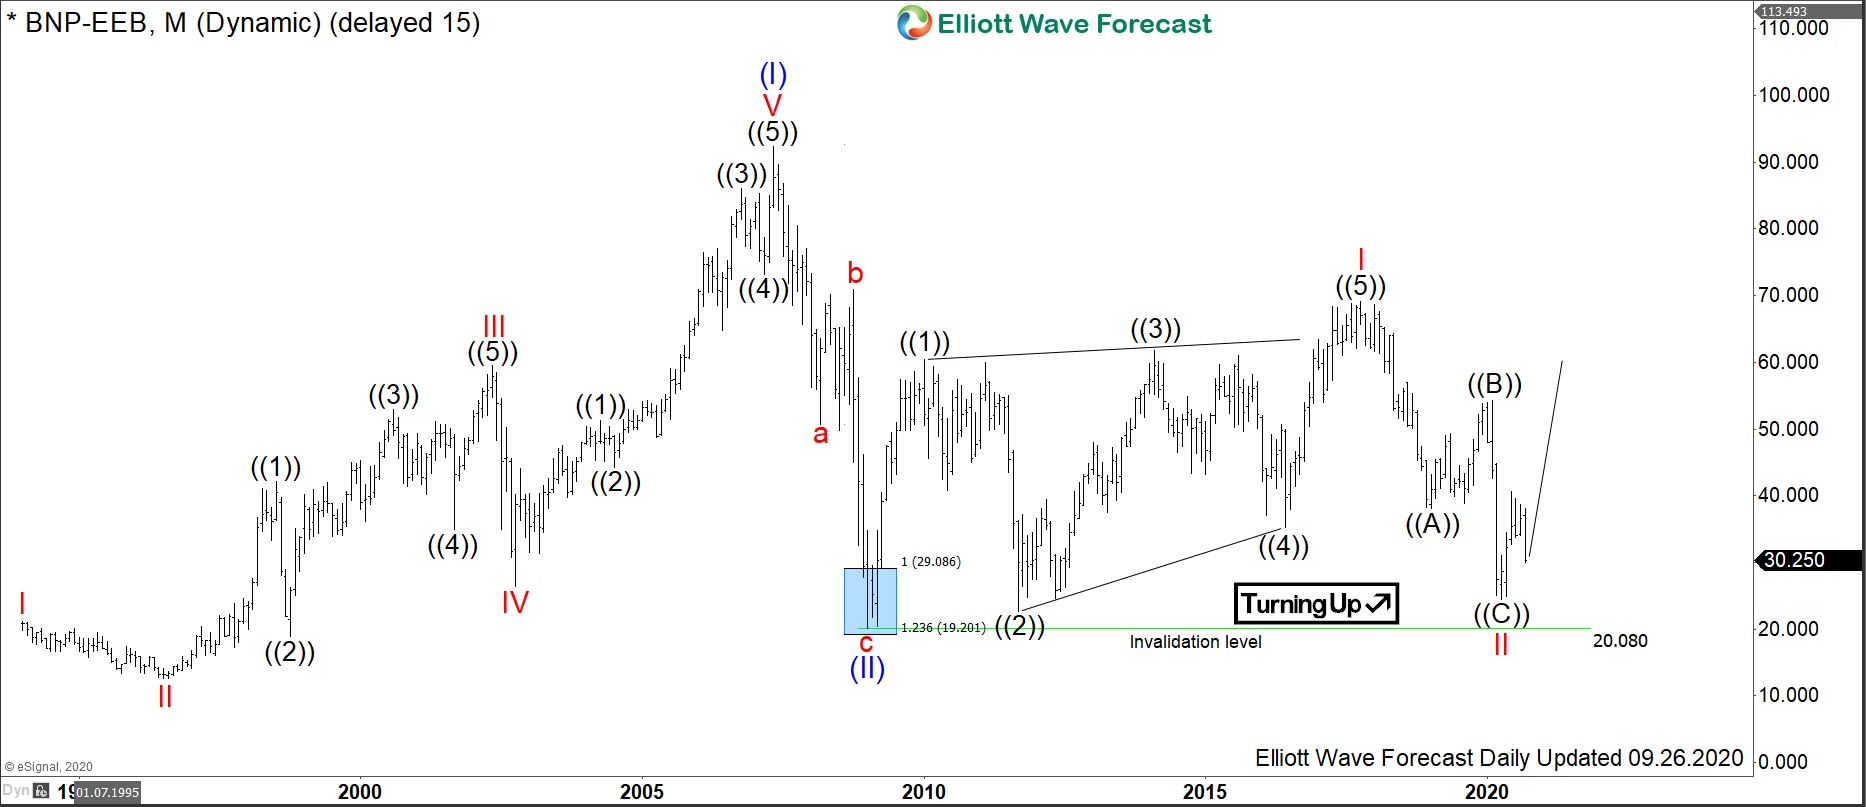
$BNP : Largest Bank of Eurozone BNP Paribas is nesting
Read MoreBNP Paribas is a French international banking group being within 10 largest banks in the world. Headquartered in Paris, it is a merger of Banque Nationale de Paris (BNP) and Paribas. BNP Paribas is a part of Euro Stoxx 50 (SX5E) and CAC40 indices. Investors can trade it under the ticker $BNP at Euronext Paris […]
-
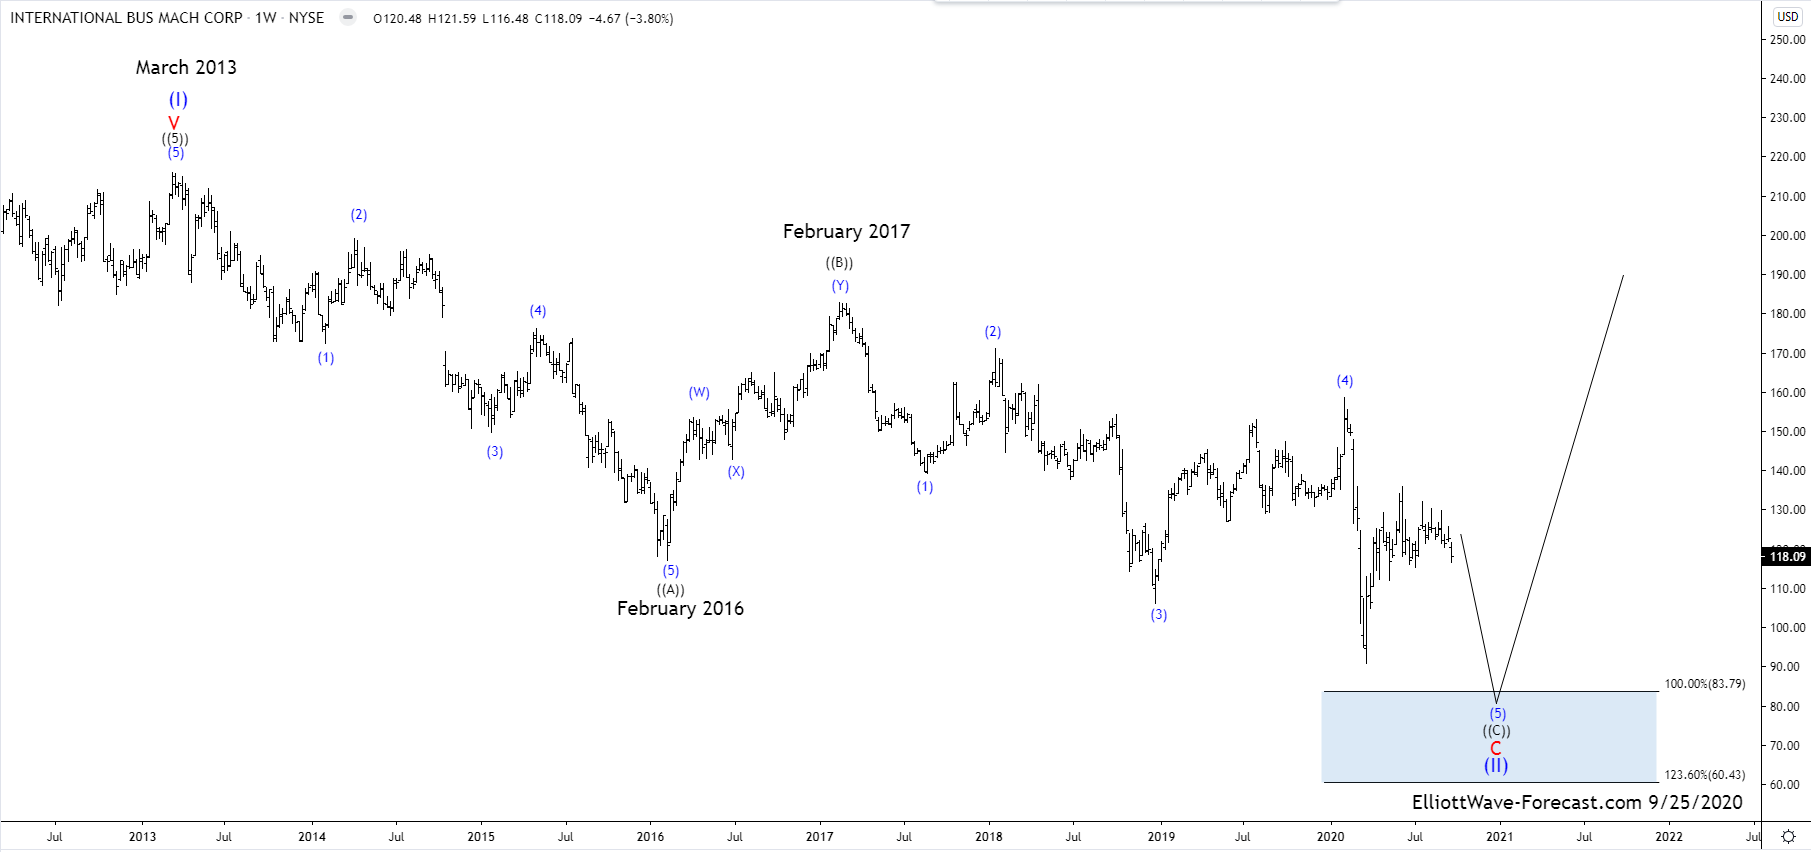
$IBM Long Term Bullish Cycle and Elliott Wave Pullback
Read More$IBM Long Term Bullish Cycle and Elliott Wave Pullback Firstly I would like to mention Big Blue has been around for over 100 years since it was founded. I have price data that goes back to the 1960’s when the stock price was around three dollars. The point of this article is to show what […]
-
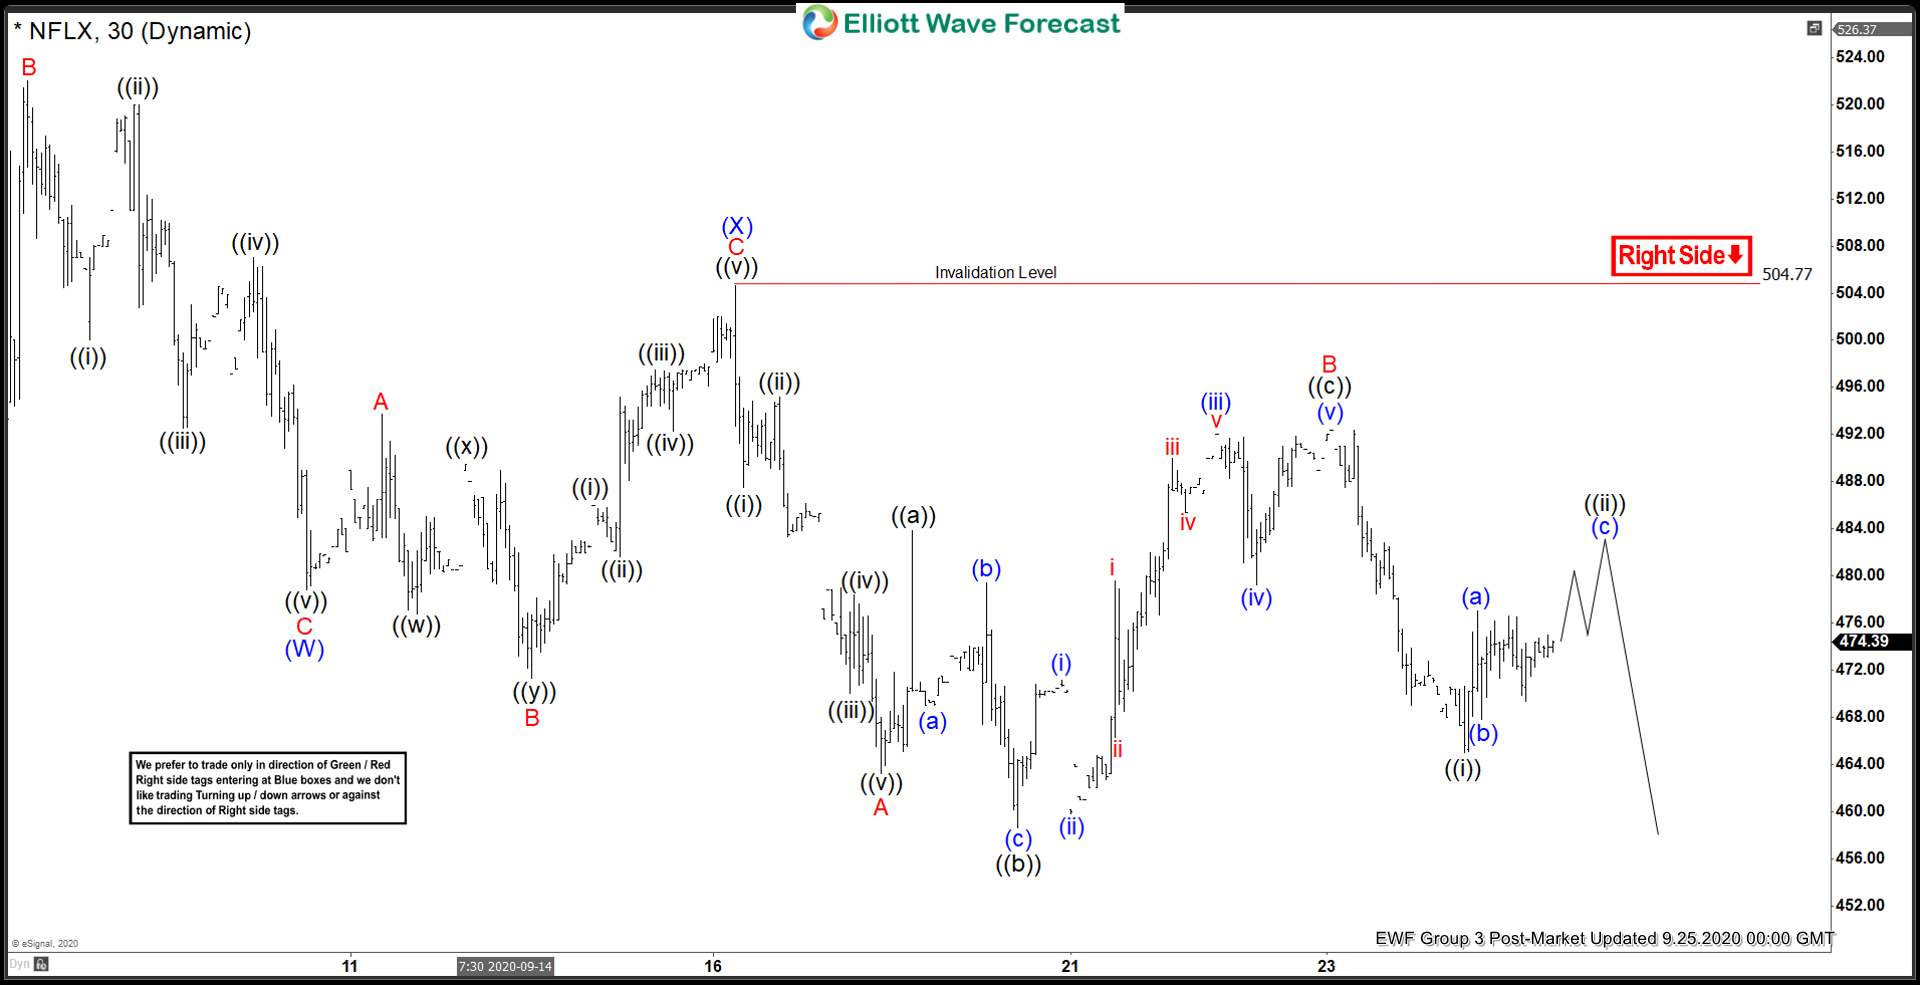
Elliott Wave View: Rally in Netflix is Expected to Fail
Read MoreNetflix is doing a double three correction from September 2 high. While below September 16 high, expect bounce in 3,7,11 swings to fail in the near term.
-
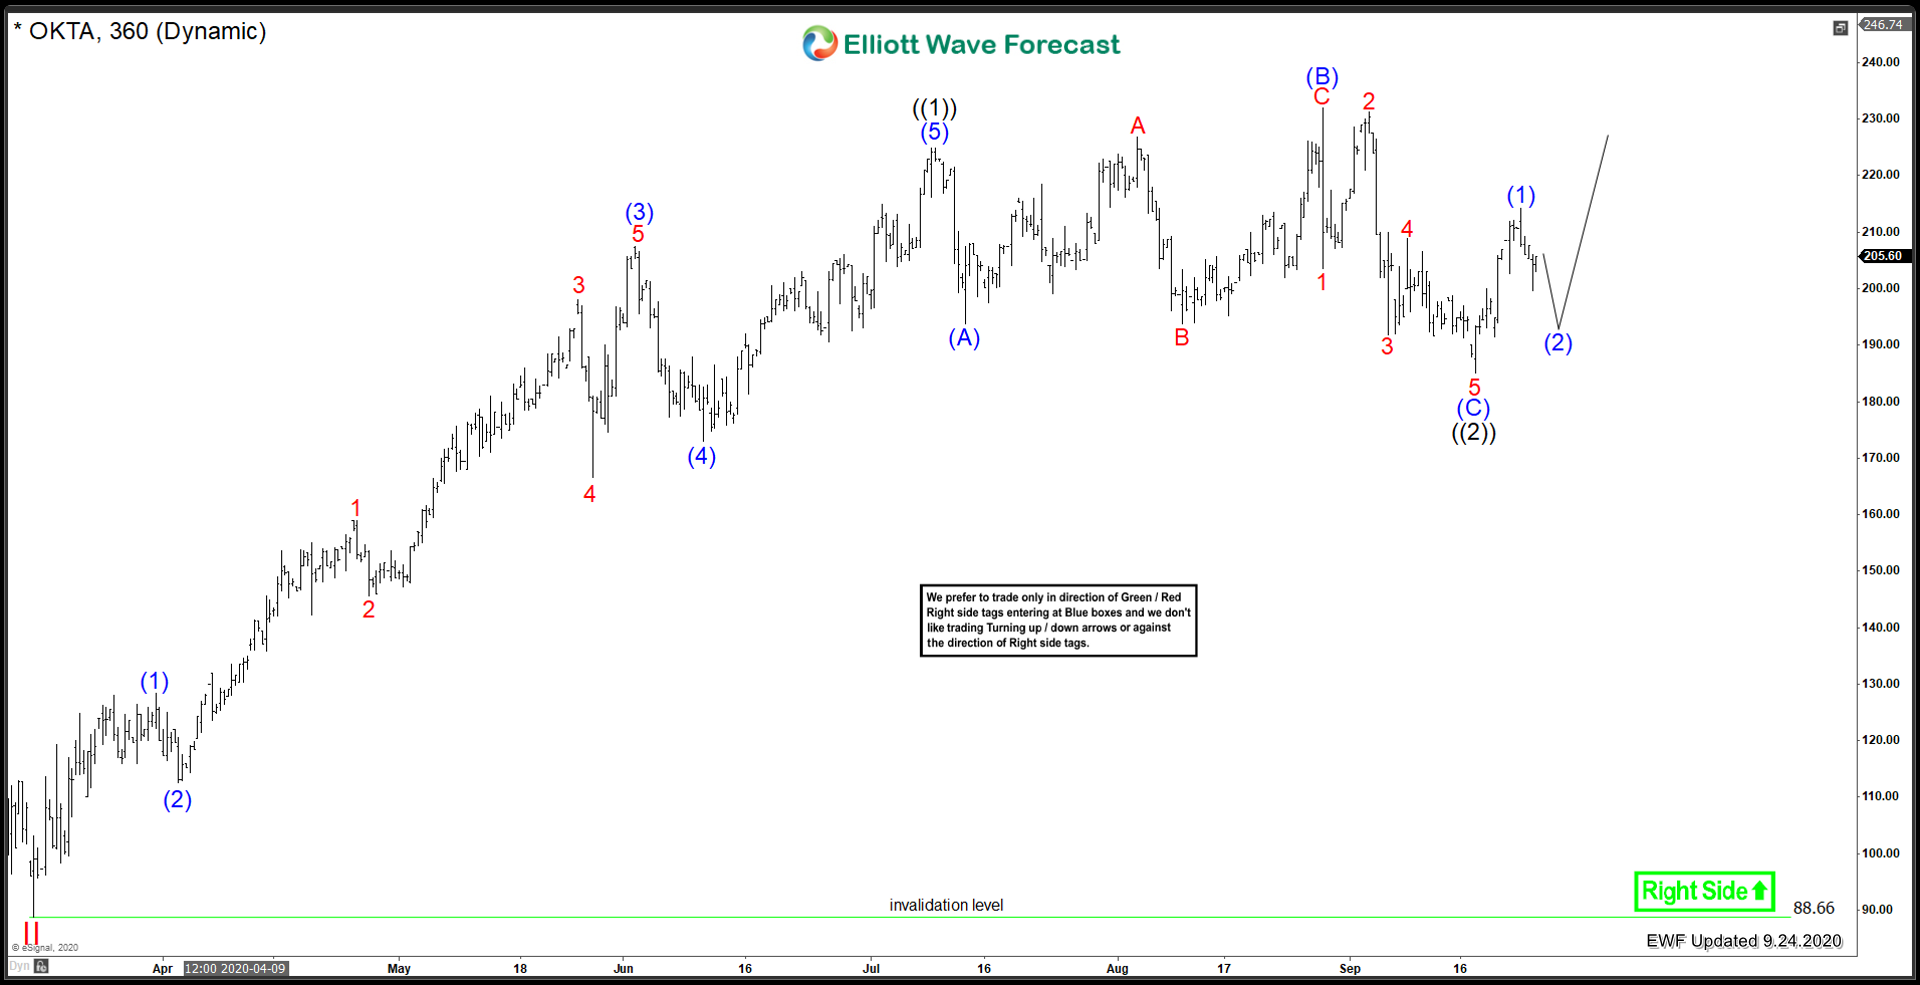
OKTA Inc. ($OKTA) Bulls Remain In Charge
Read MoreAnother Cloud cloud computing name that has vastly outperformed the market since March 2020 low, is none other than OKTA. This name has been a solid performer since the IPO, and remains favoured to extend higher in its bull trend in the long term. Lets take a look at what the company does: “Okta, Inc. is […]
-
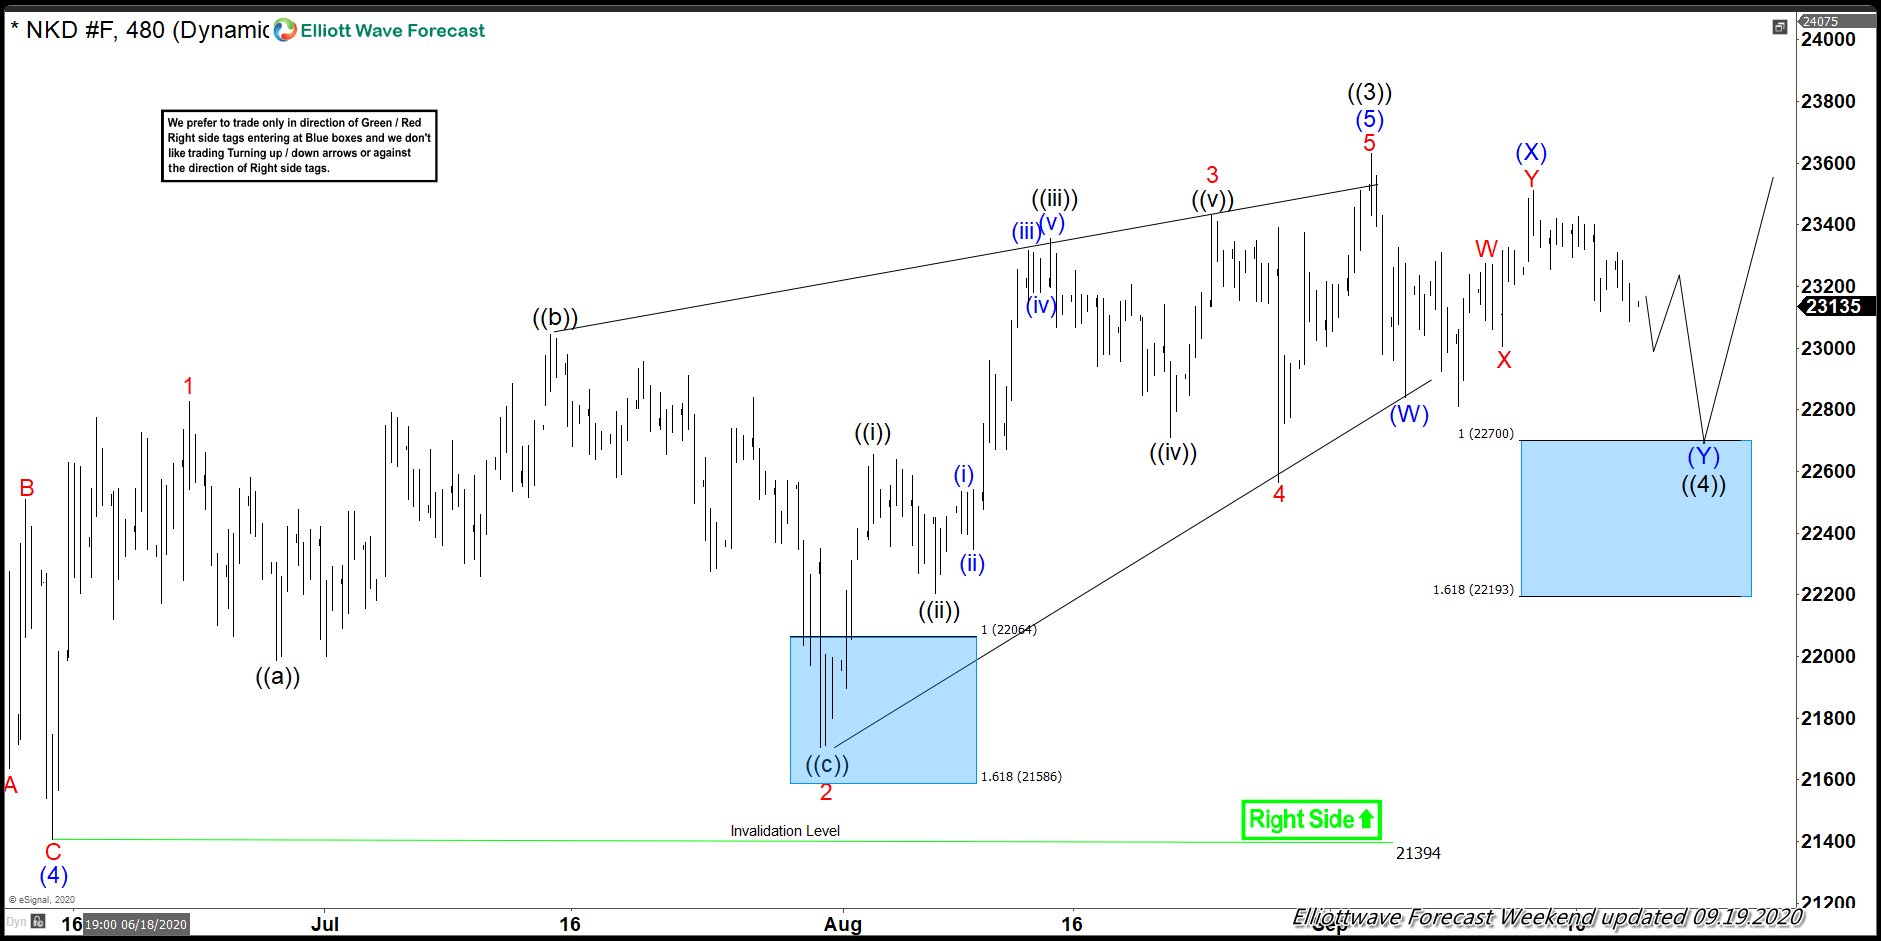
Nikkei: Forecasting The Rally From Elliott Wave Blue Box
Read MoreThis week we witnessed a sharp decline in Nikkei followed by an equally sharp rally. Our weekend update informed members that a decline was expected to unfold this week followed by a reaction higher, we even showed them the area where we expected the decline to end and reaction higher to take place. In this […]