

The Power of 3-7-11 and the Grand Super Cycle: How We Saw the Bullish Turn in April 2025 Back on April 9, 2025, while World Indices were dropping sharply and global sentiment had turned overwhelmingly bearish, we published an article that challenged the fear-driven narrative. We explained why selling was not the right approach and […]
-
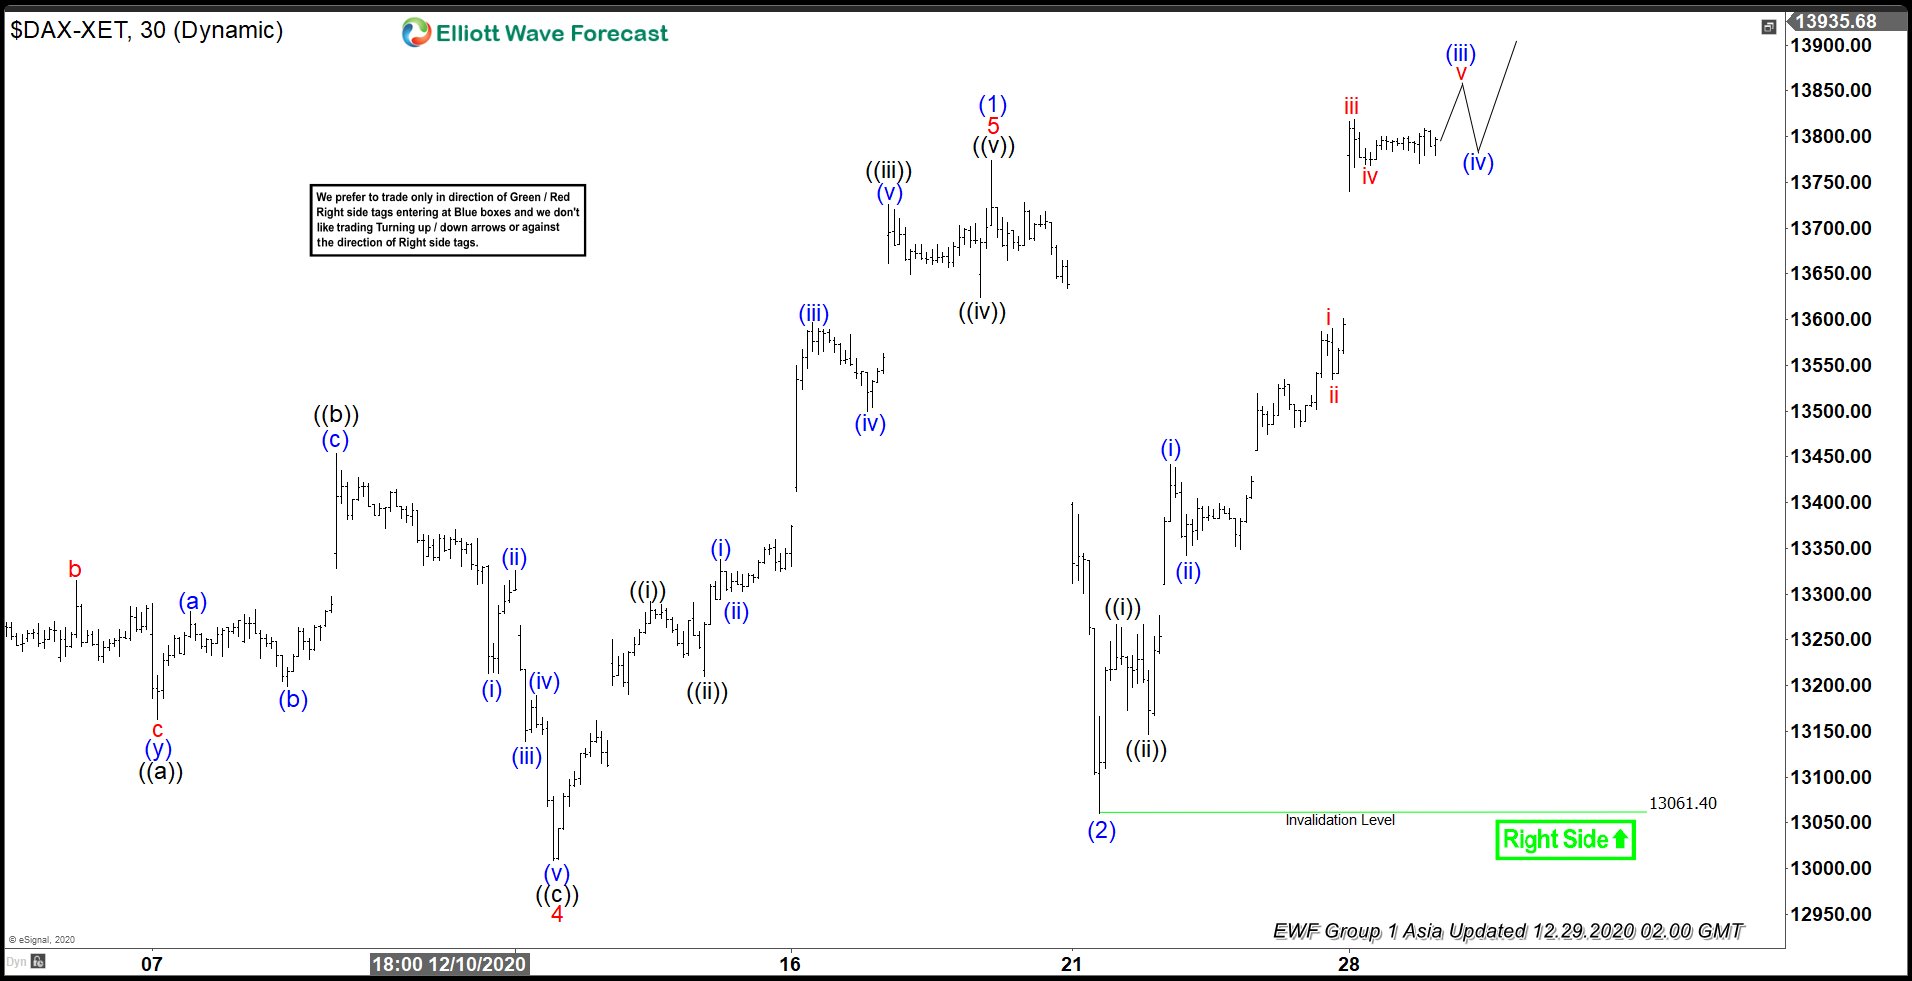
Elliott Wave View: DAX Starts a New Bullish Cycle
Read MoreDAX has started a new bullish cycle and dips should find support in 3, 7, or 11 swing. This article and video look at the Elliott Wave path.
-
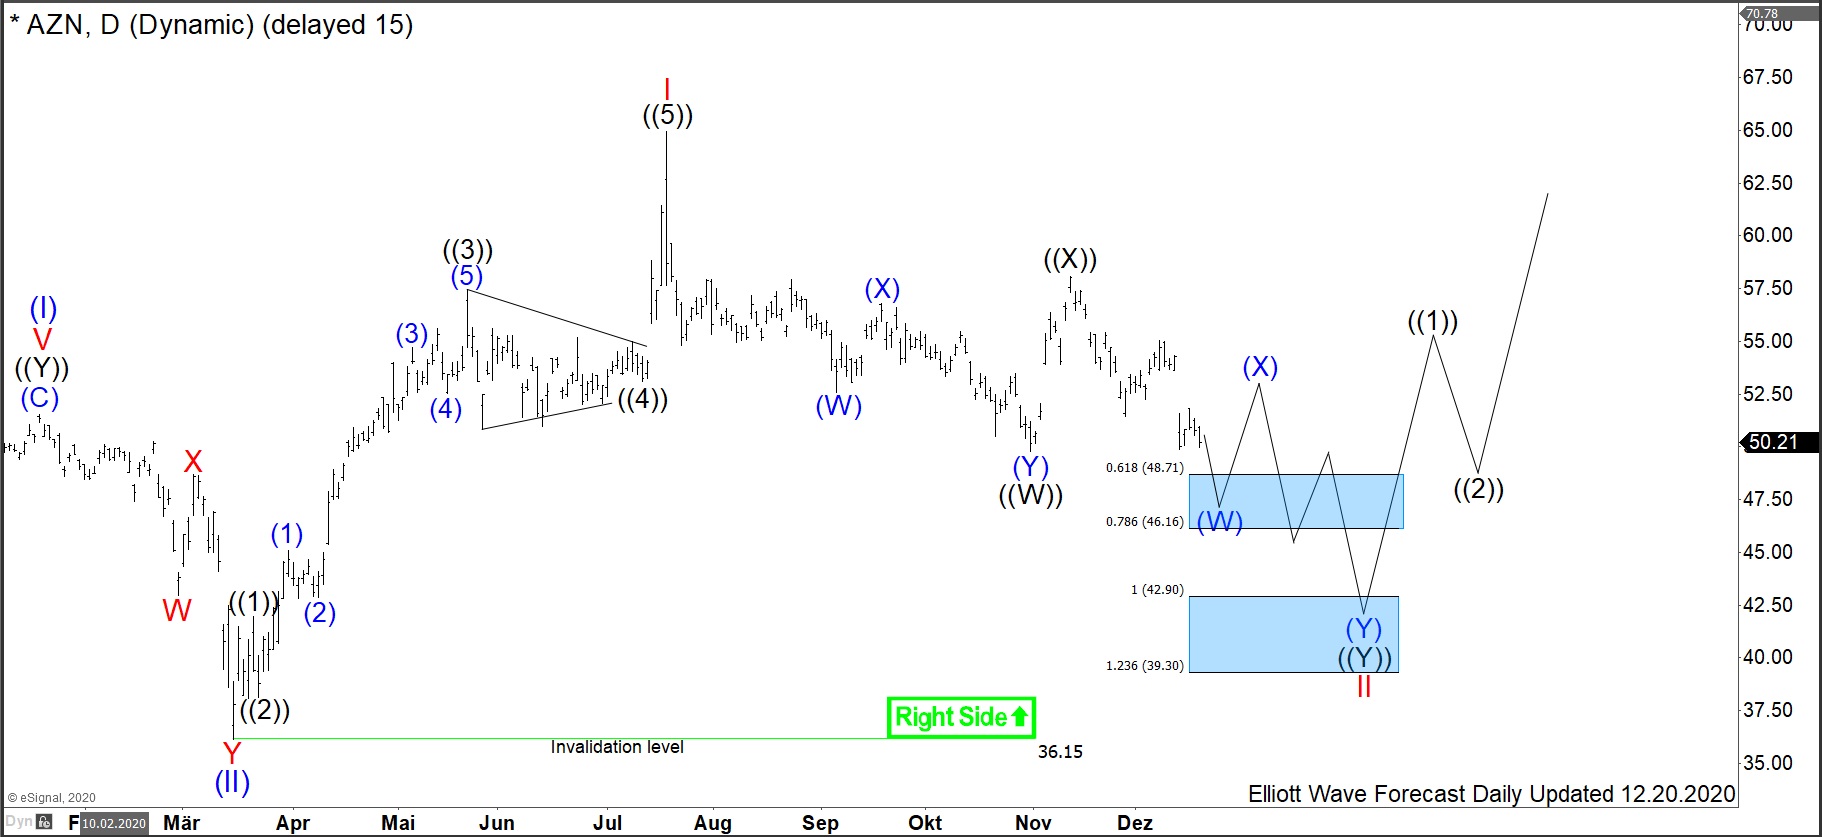
$AZN : Will COVID vaccine development propulse AstraZeneca?
Read MoreAstraZeneca is a British-Swedish multinational pharmaceutical and biopharmaceutical company. Founded in 1999 and headquartered in Cambridge, UK, it is a merger of the Swedish Astra AB and British Zeneca Group. Astrazeneca is a part of FTSE100 index. Investors can trade it under the ticker $AZN at London Stock Exchange and also under $AZN at NASDAQ. […]
-
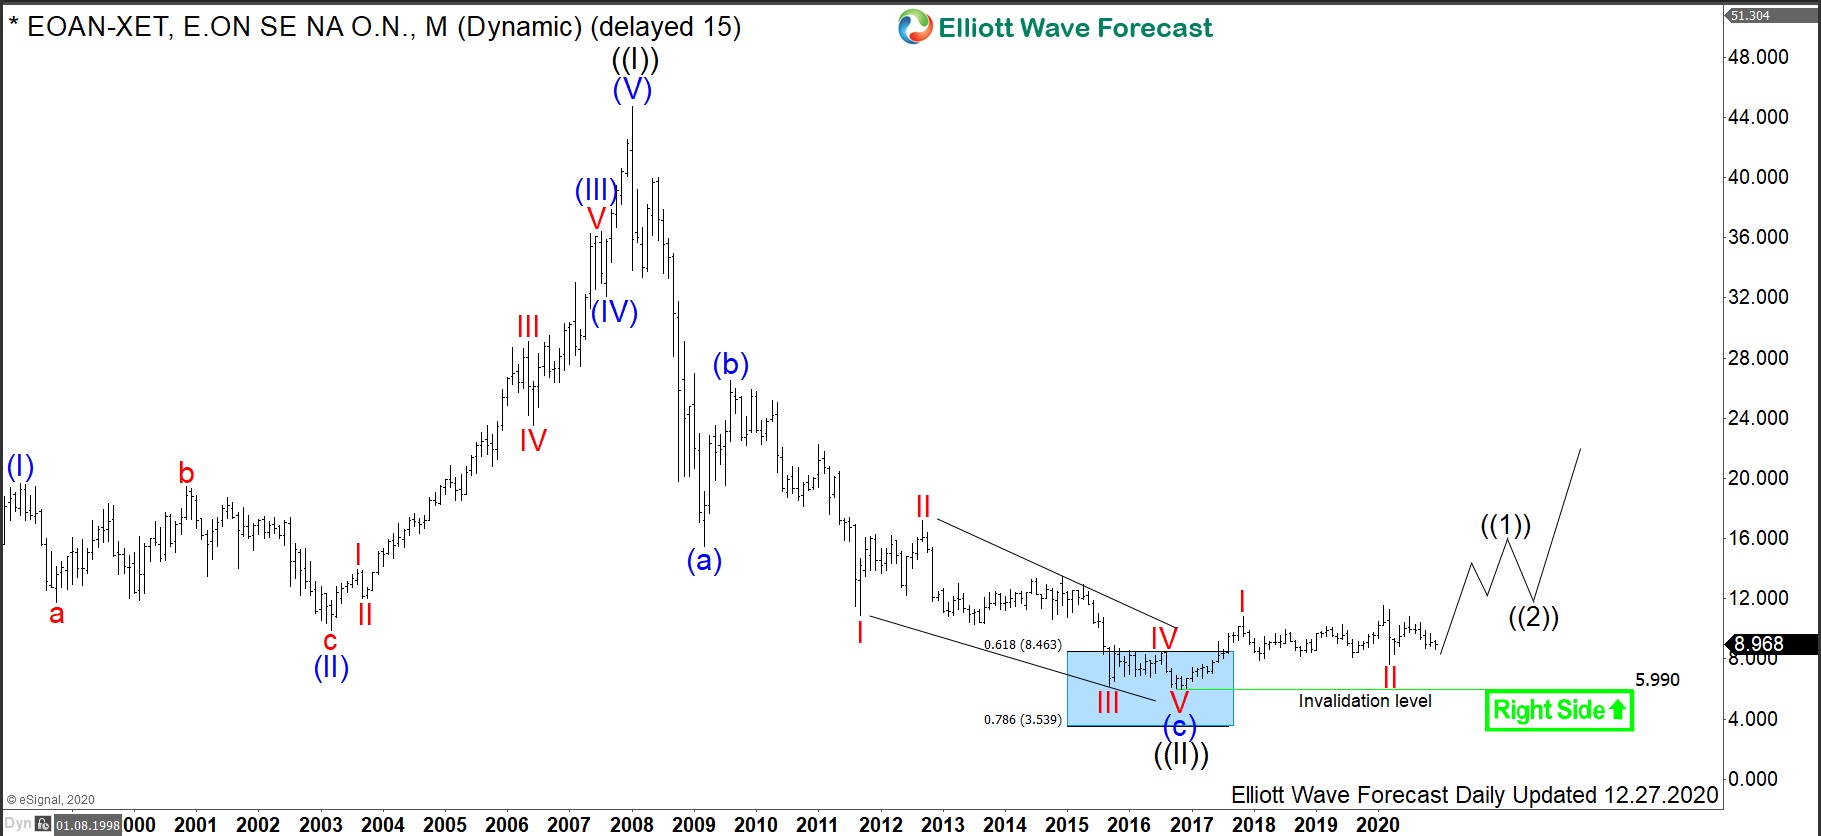
$ EOAN : E.ON Stock Looking Towards a Strong Rally
Read MoreE.ON SE is a German electric utility company and by revenue one of the largest electric utility providers in the world. Created in 2000 through the merger of VEBA and VIAG and headquartered in Essen, Germany, the company operates in over 30 countries worldwide. E.ON is a part of both DAX30 and of SX5E indices. […]
-
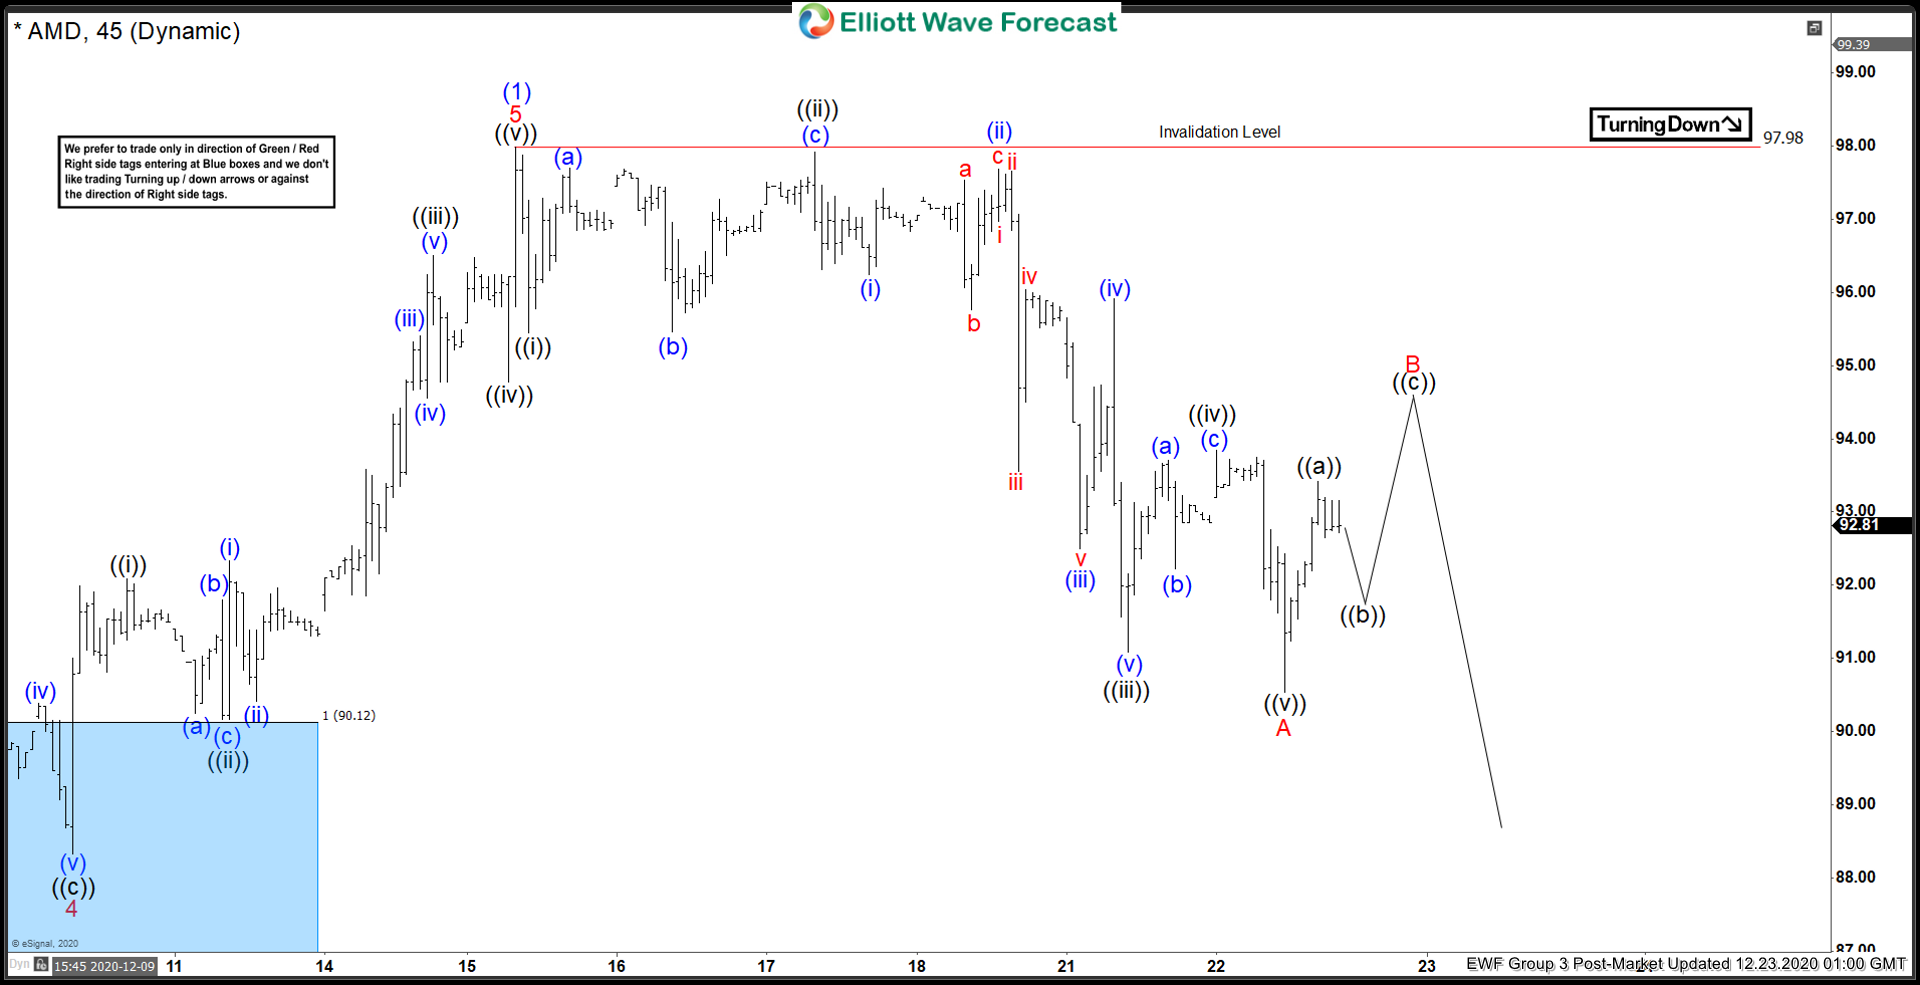
Elliott Wave View: AMD Pullback Another Buying Opportunity
Read MoreAMD is correcting the cycle from 11/02/2020 cycle & soon it is expected to provide another buying opportunity. This video looks at the Elliott Wave path.
-
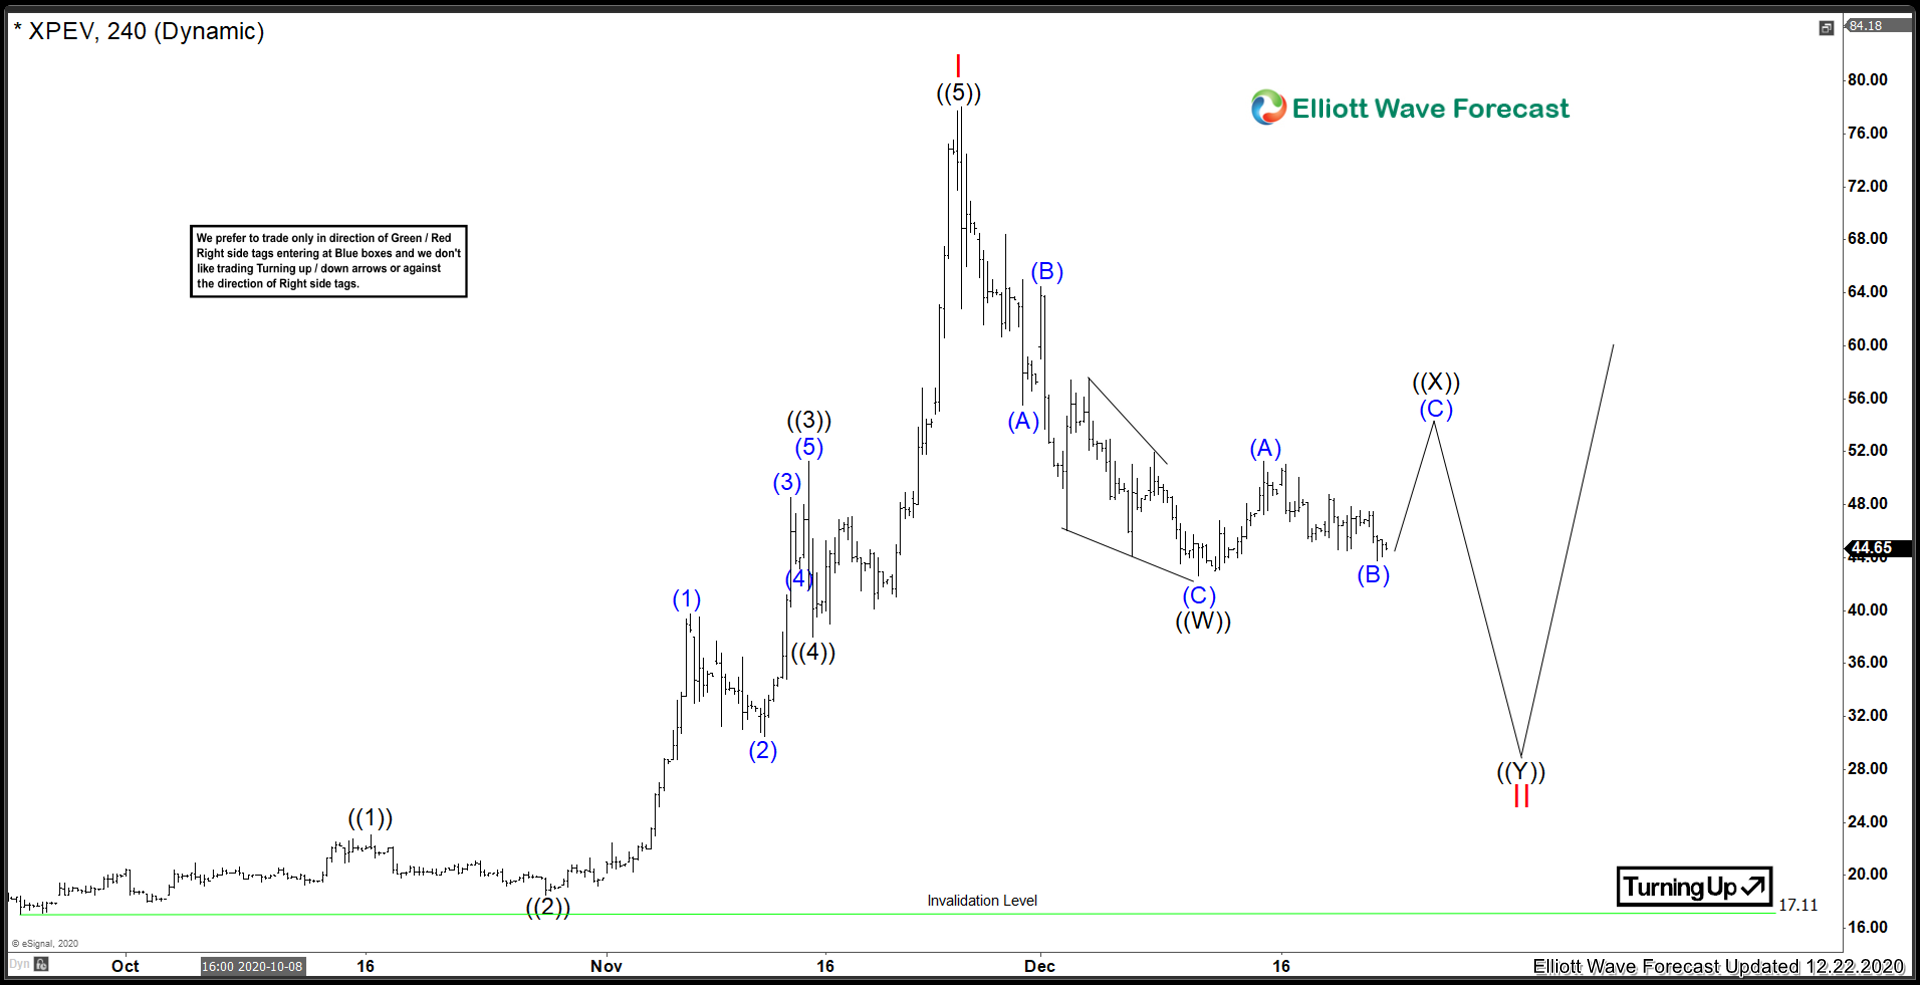
Xiaopeng Motors ($XPEV) Correcting in Larger Cycle
Read MoreThe EV sector has has a very lucrative 2020. Xiaopeng stock has risen from a low of 17.11 to a peak of 78.00 and seems to be correcting the cycle from the all time low. This chart has lots of potential for future gains. Lets take a look at the company profile below: “Xpeng was […]
-
Top 21 Best Day Trading Stocks in 2024
Read MoreDay trading is a skill that has made fortune for many well-known traders from Jesse Livermore to Steven Cohn. The names mentioned were the best day traders of all time and proved to the world that trading is not speculation but a highly calculative and strategic business. In this blog, you will find well known […]