

The Power of 3-7-11 and the Grand Super Cycle: How We Saw the Bullish Turn in April 2025 Back on April 9, 2025, while World Indices were dropping sharply and global sentiment had turned overwhelmingly bearish, we published an article that challenged the fear-driven narrative. We explained why selling was not the right approach and […]
-
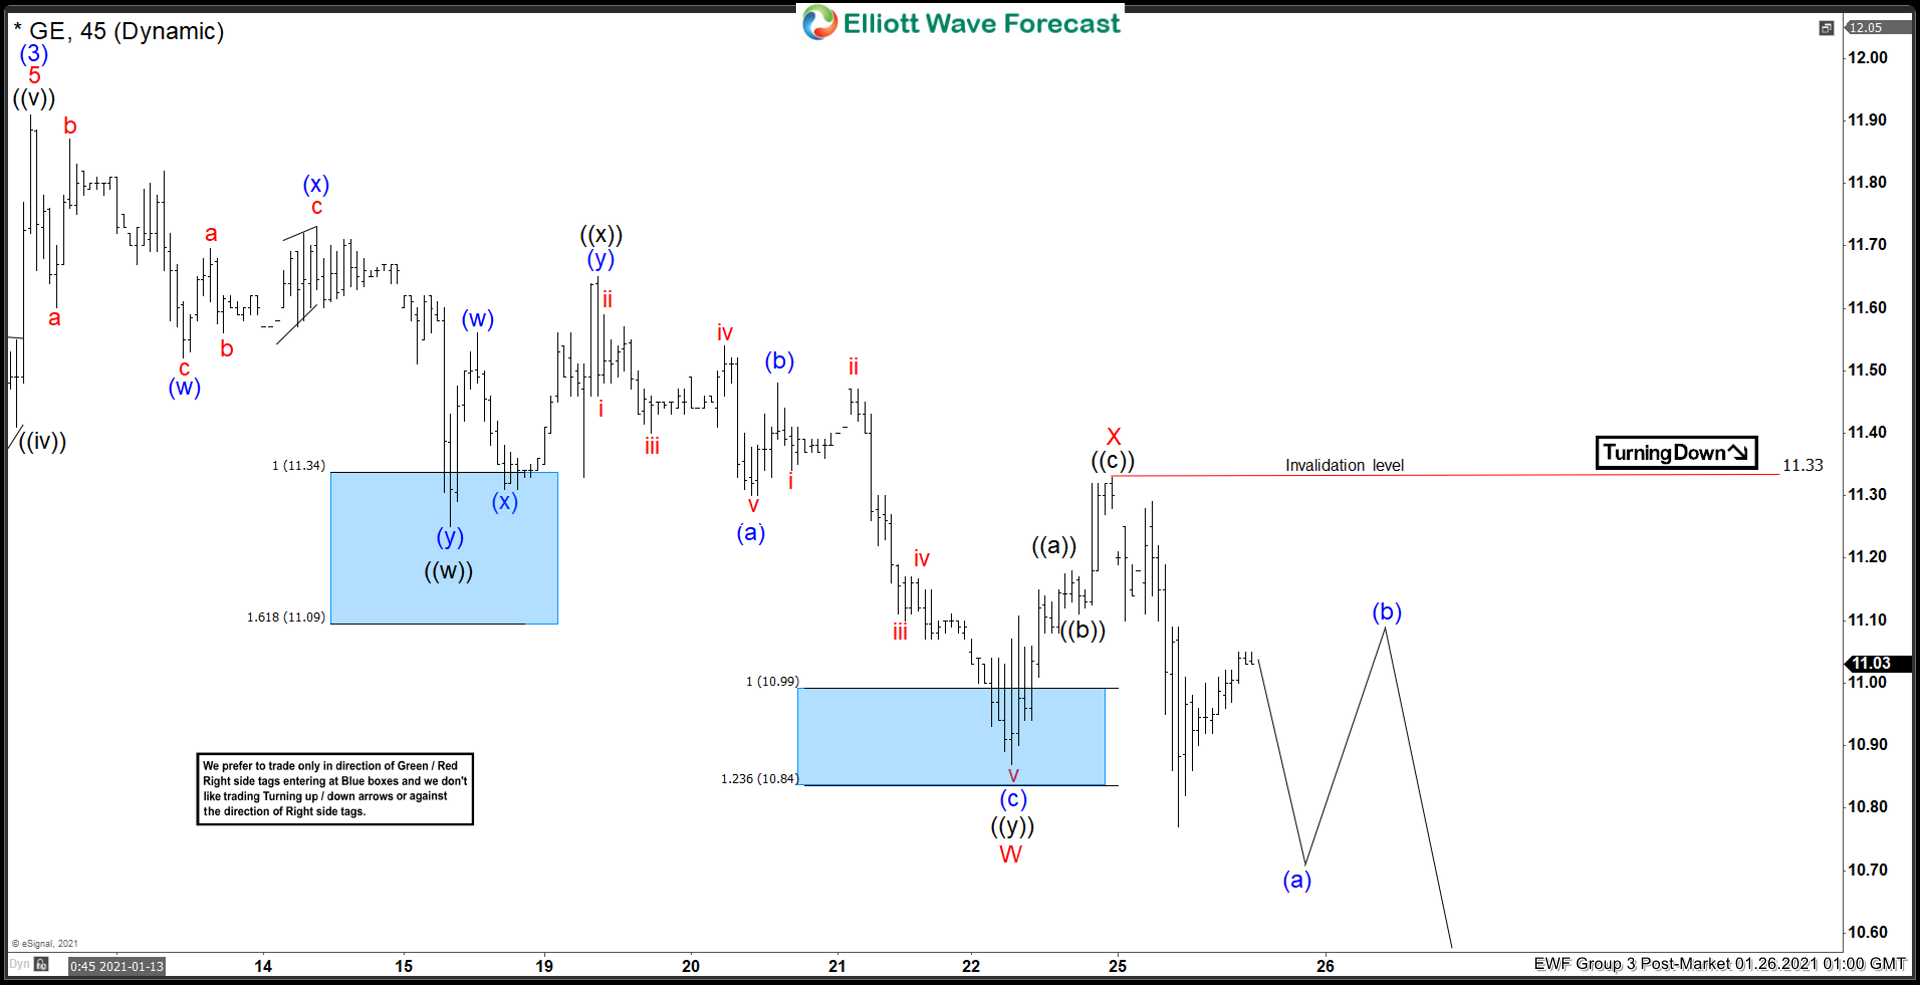
Elliott Wave View: General Electric (GE) Has Further Downside in Correction
Read MoreGeneral Electric (GE) shows incomplete sequence from January 13 peak & the stock can see more downside. This article & video look at the Elliott Wave path.
-
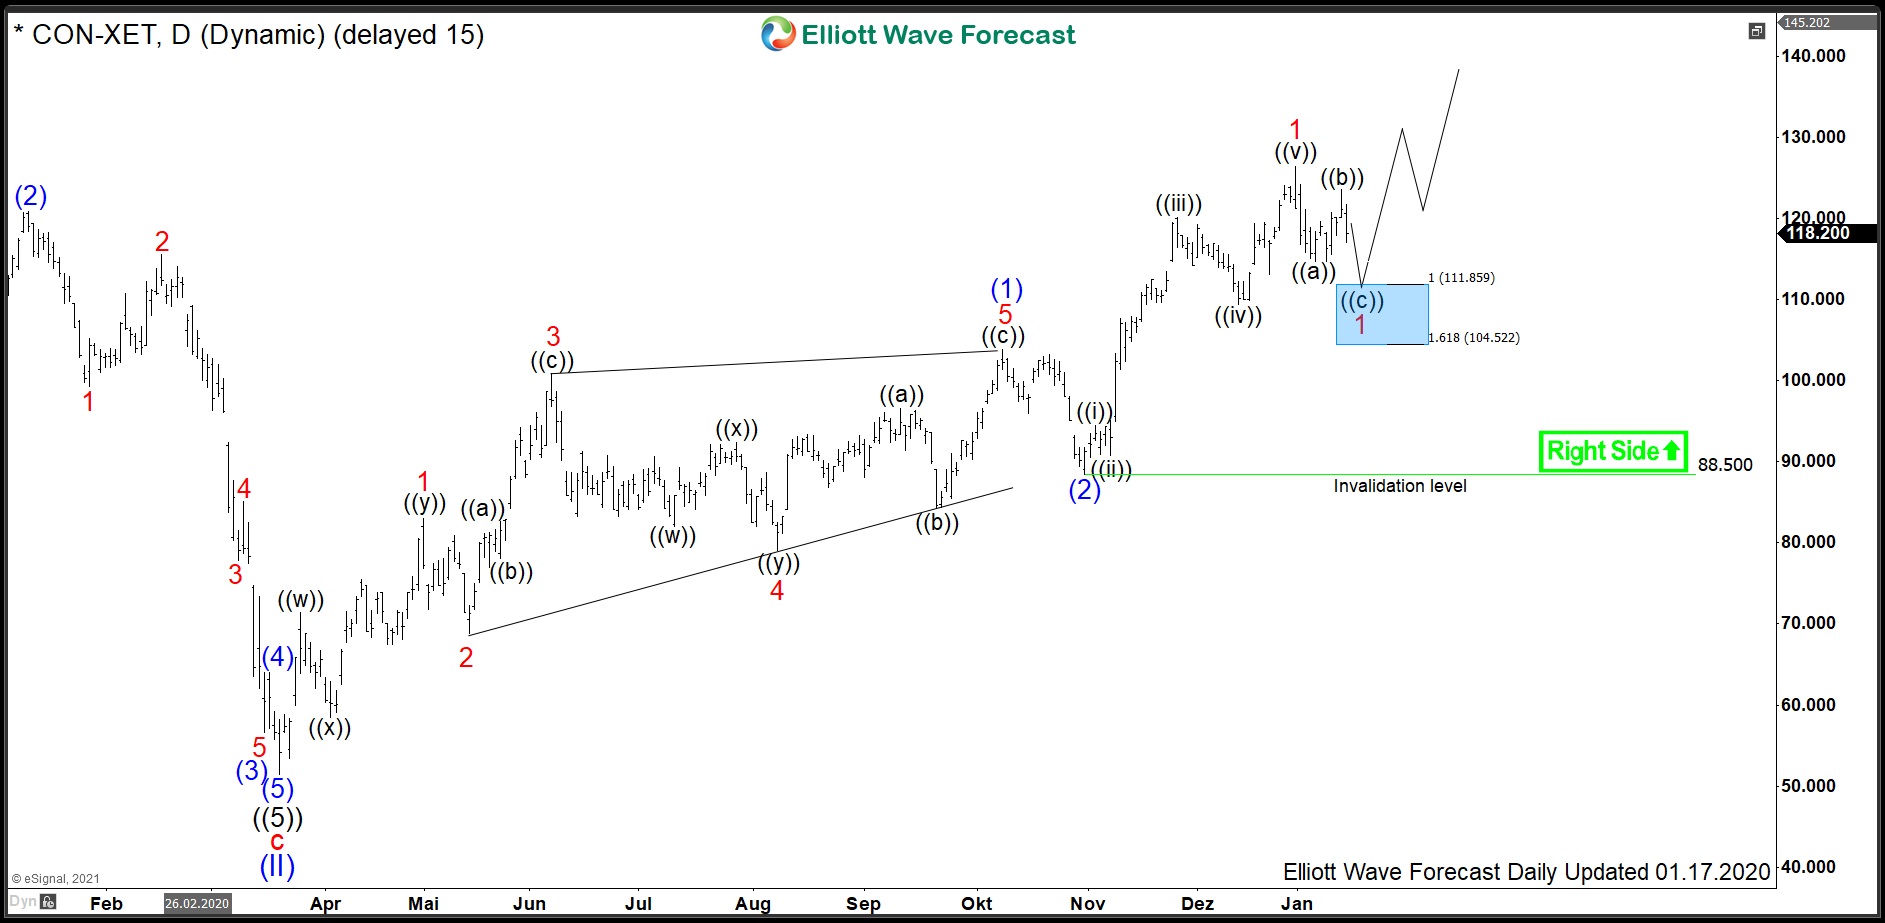
$CON : Automotive Parts Manufacturer Continental to Accelerate Higher
Read MoreContinental is a German multinational automotive parts manufacturing company. It is specializing in brake systems, interior electronics, tachographs, automotive safety, powertrain and chassis components, tires and other parts for the automotive and transportation industries. Founded in 1871 and headquartered in Hanover, Germany, Continental is a part of DAX30 index. From the all-time lows, the stock […]
-
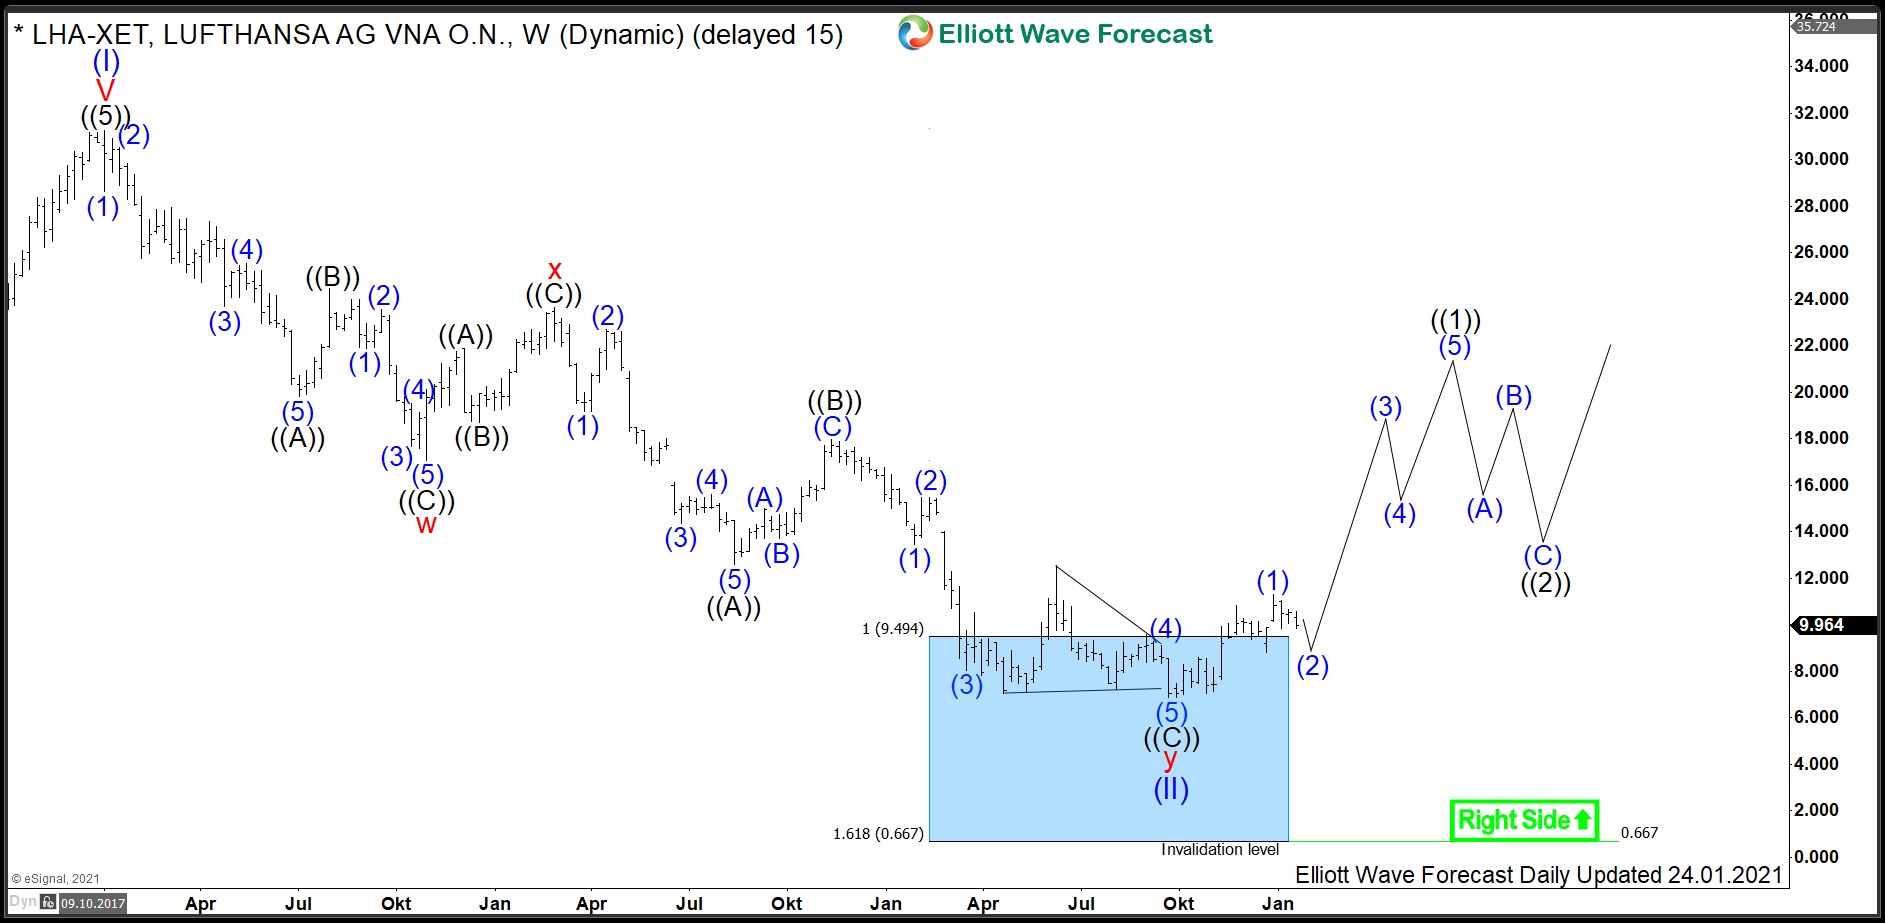
$LHA : Lufthansa Ramping Up Despite Lockdowns
Read MoreDeutsche Lufthansa AG is the largest German airline and behind Ryanair the second largest company in Europe in terms of the number of passengers. Founded in 1926 and headquartered in Cologne, Germany, it can be traded under the ticker $LHA at XETRA in Frankfurt. Besides its own services, Lufthansa owns Austrian Airlines, Swiss International Airlines, Brussels […]
-
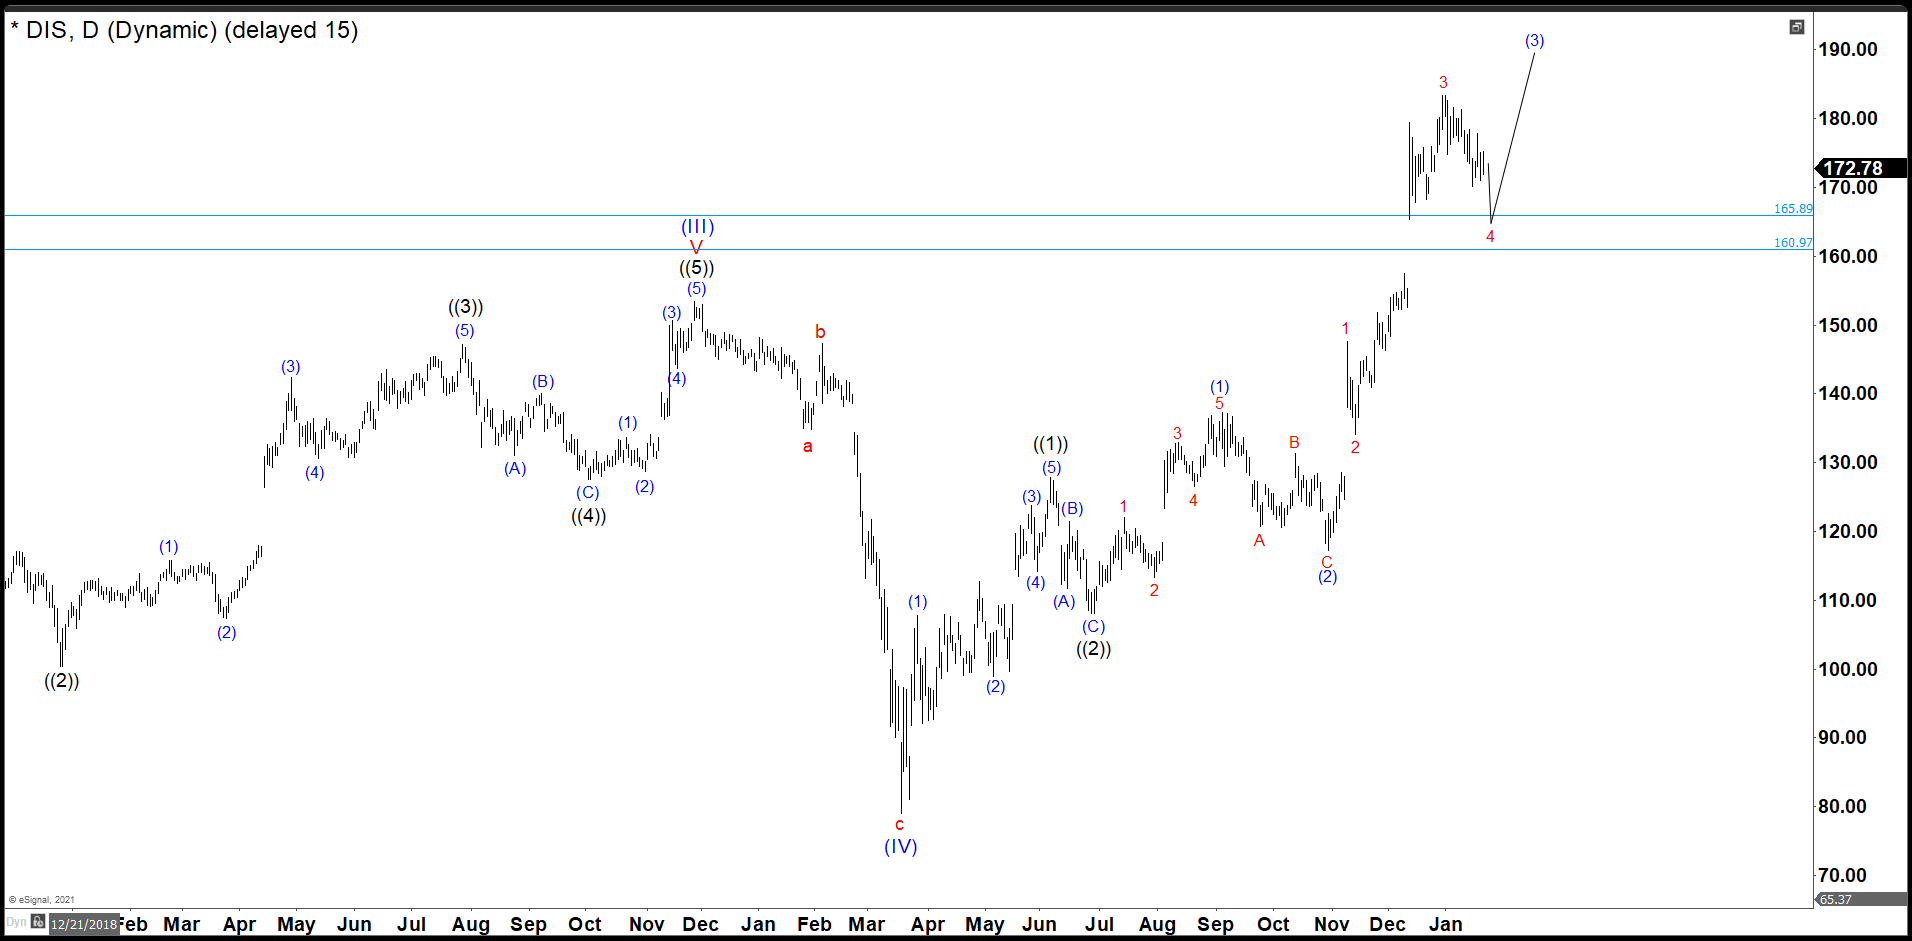
Building An Impulse In Disney Since March Low
Read MoreSince the crash of March 2020, all stocks have tried to recover what they lost and Disney was no exception. Disney did not only recover the lost, but It also reached historic highs. Now, we are going to try to build an impulse from the March 2020 lows with a target around $230. Target measured […]
-
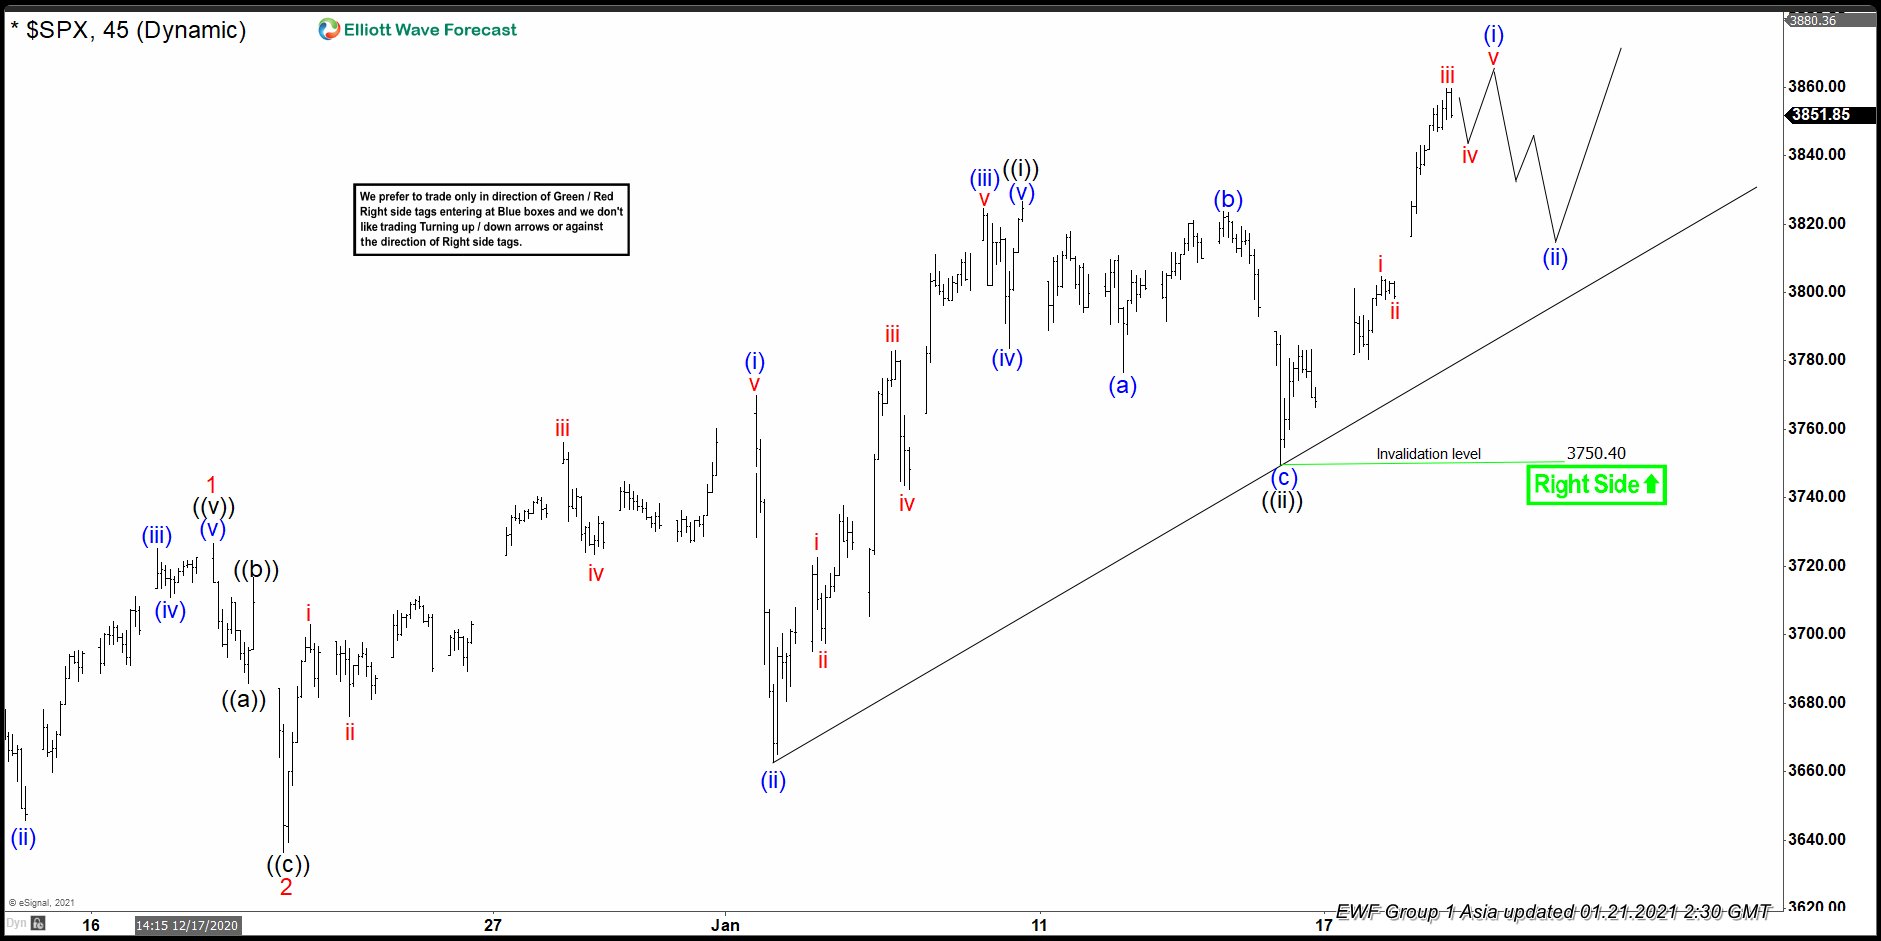
Elliottwave View: SPX Upside Move Has Resumed
Read MoreS&P 500 (SPX) extends to new all-time high and more upside is favored. This article and video look at the Elliott Wave path.
-
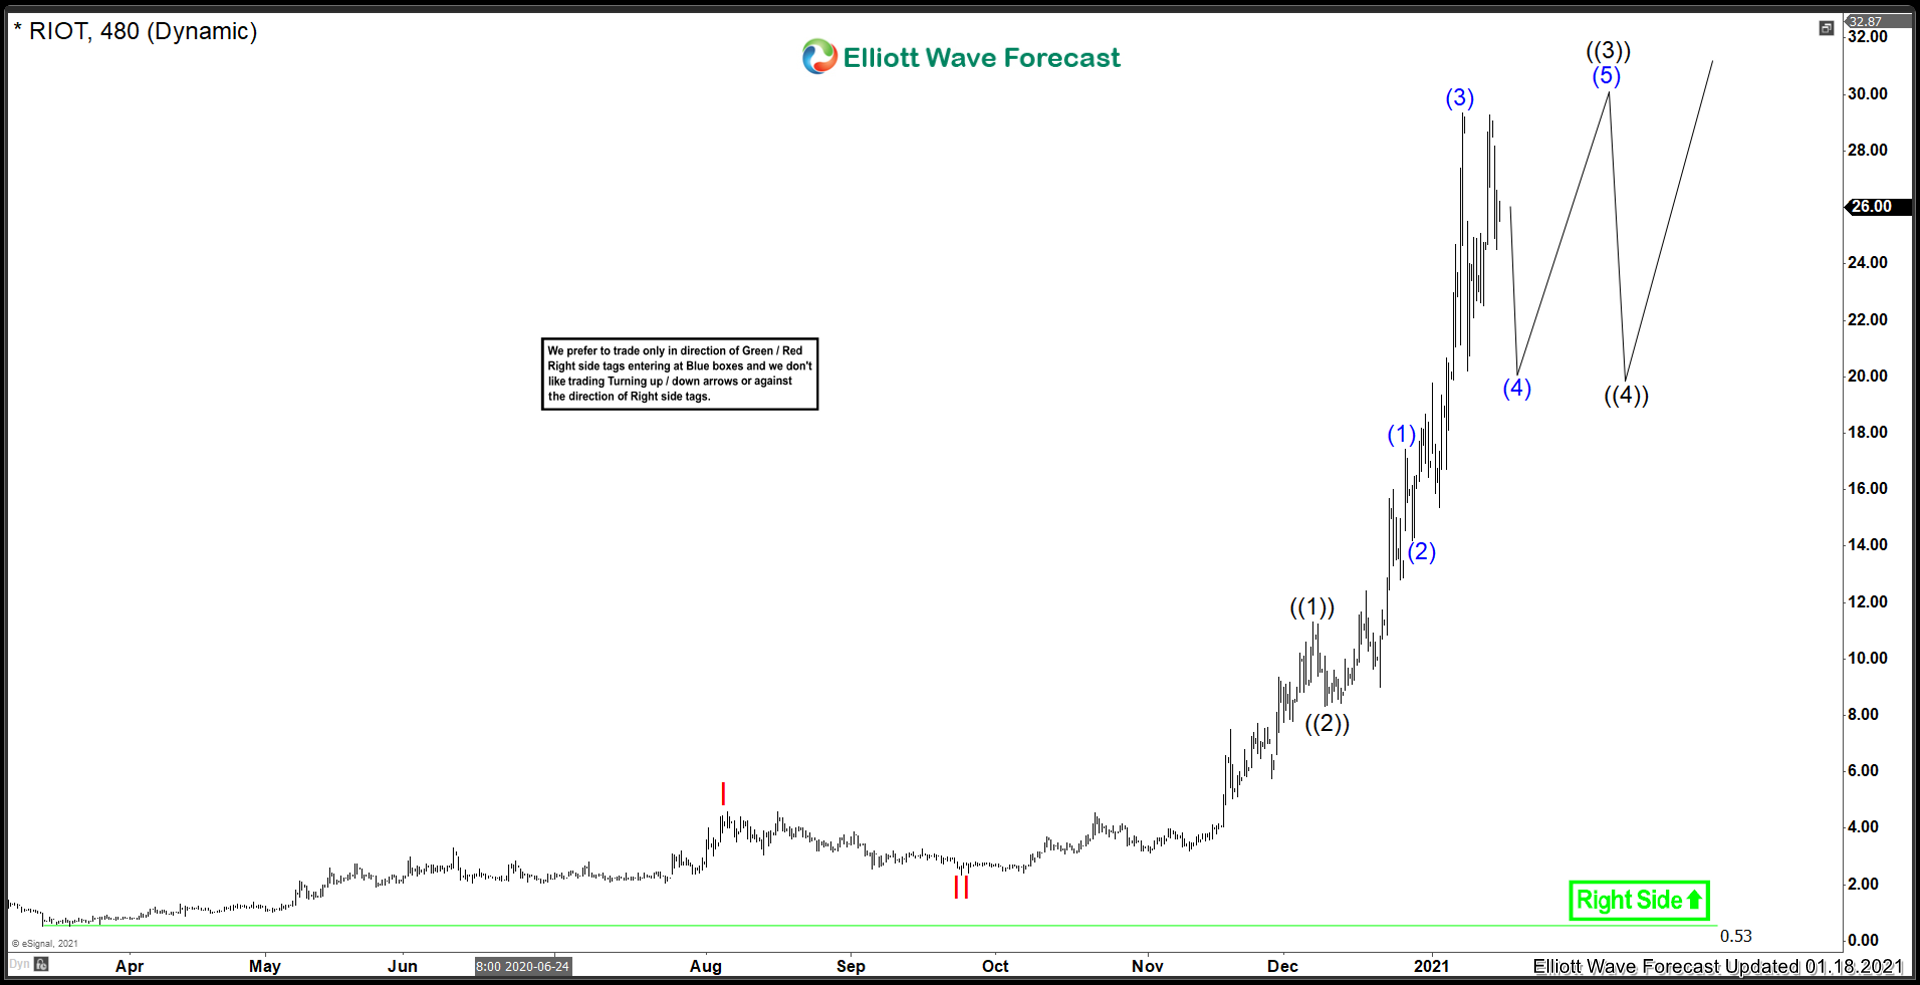
Riot Blockchain ($RIOT) Further Extension Higher
Read MoreWith Bitcoin recently breaking out to new all time highs the Crypto and Blockchain market has reached fever pitch. Riot is a stock that has been consolidating since it peaked from January 8th. One more swing lower may be coming before further upside takes place. lets take a look at what they do: “Riot Blockchain […]