

The Power of 3-7-11 and the Grand Super Cycle: How We Saw the Bullish Turn in April 2025 Back on April 9, 2025, while World Indices were dropping sharply and global sentiment had turned overwhelmingly bearish, we published an article that challenged the fear-driven narrative. We explained why selling was not the right approach and […]
-
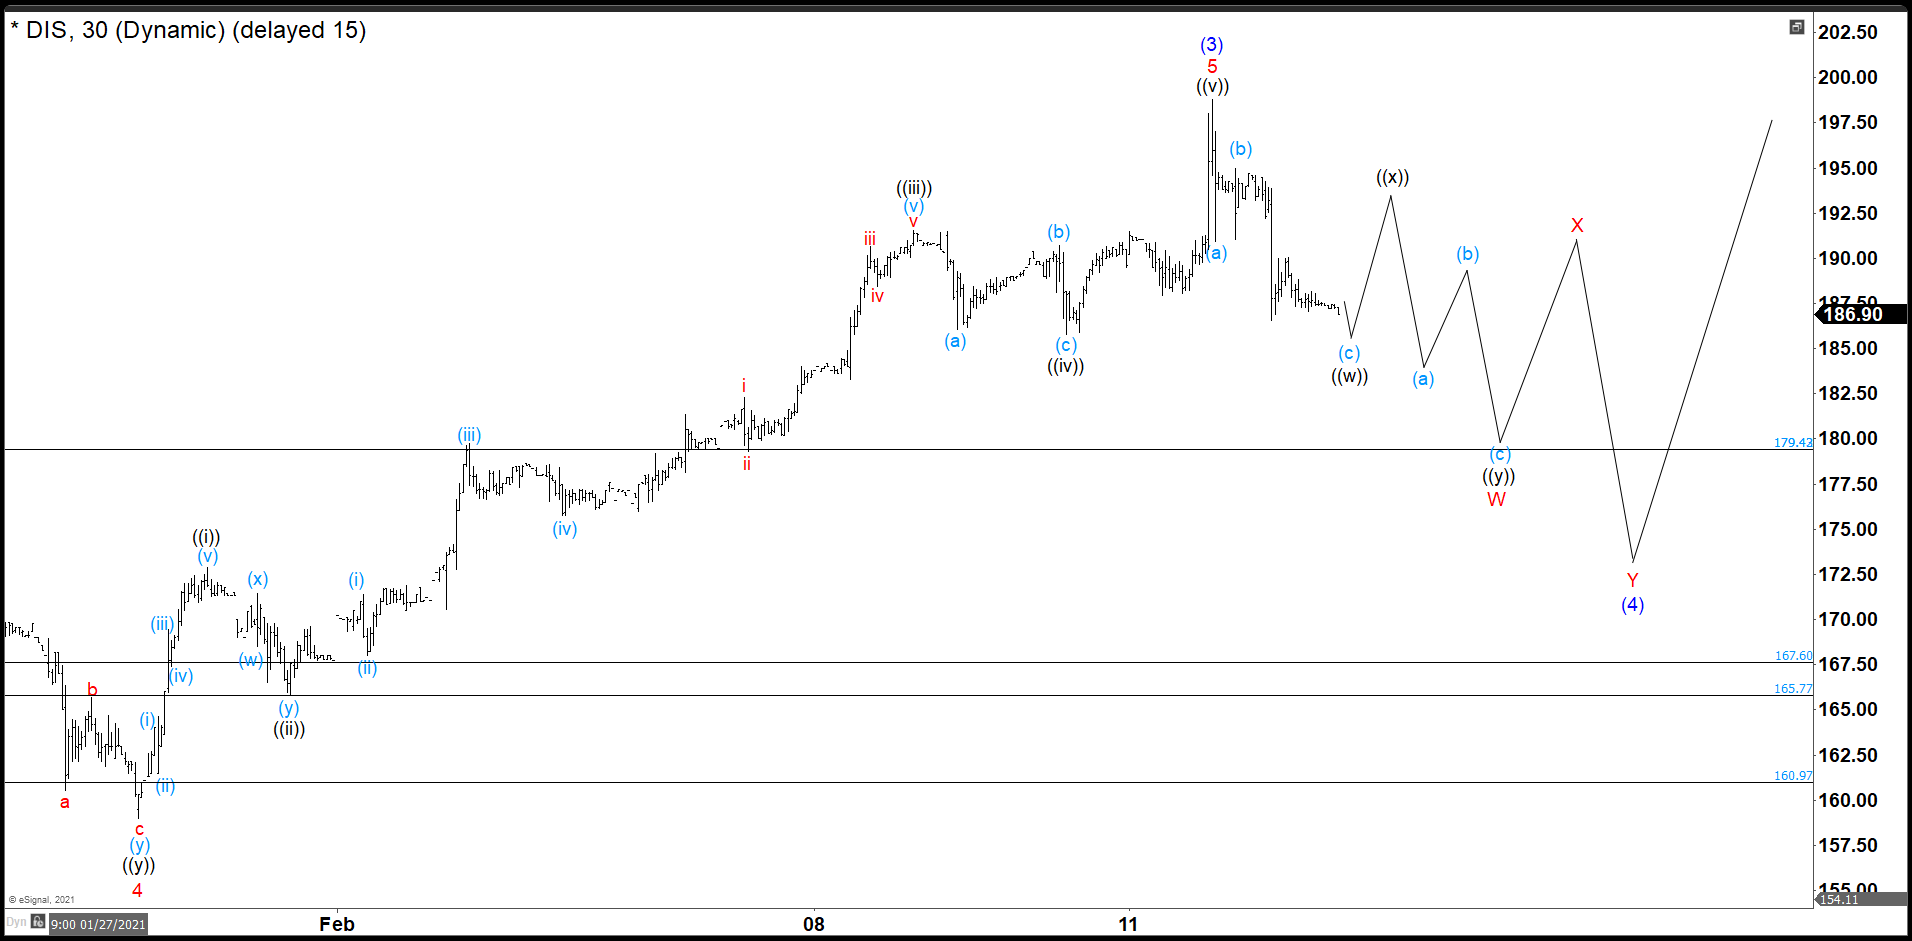
Disney Hit First Target +18.58% Return In 12 Days. Now What?
Read MoreSince the crash of March 2020, all stocks have tried to recover what they lost and Disney was no exception. Disney did not only recover the lost, but It also reached historic highs. Now, we are going to try to build an impulse from the March 2020 lows with a target around $230. Target measured […]
-
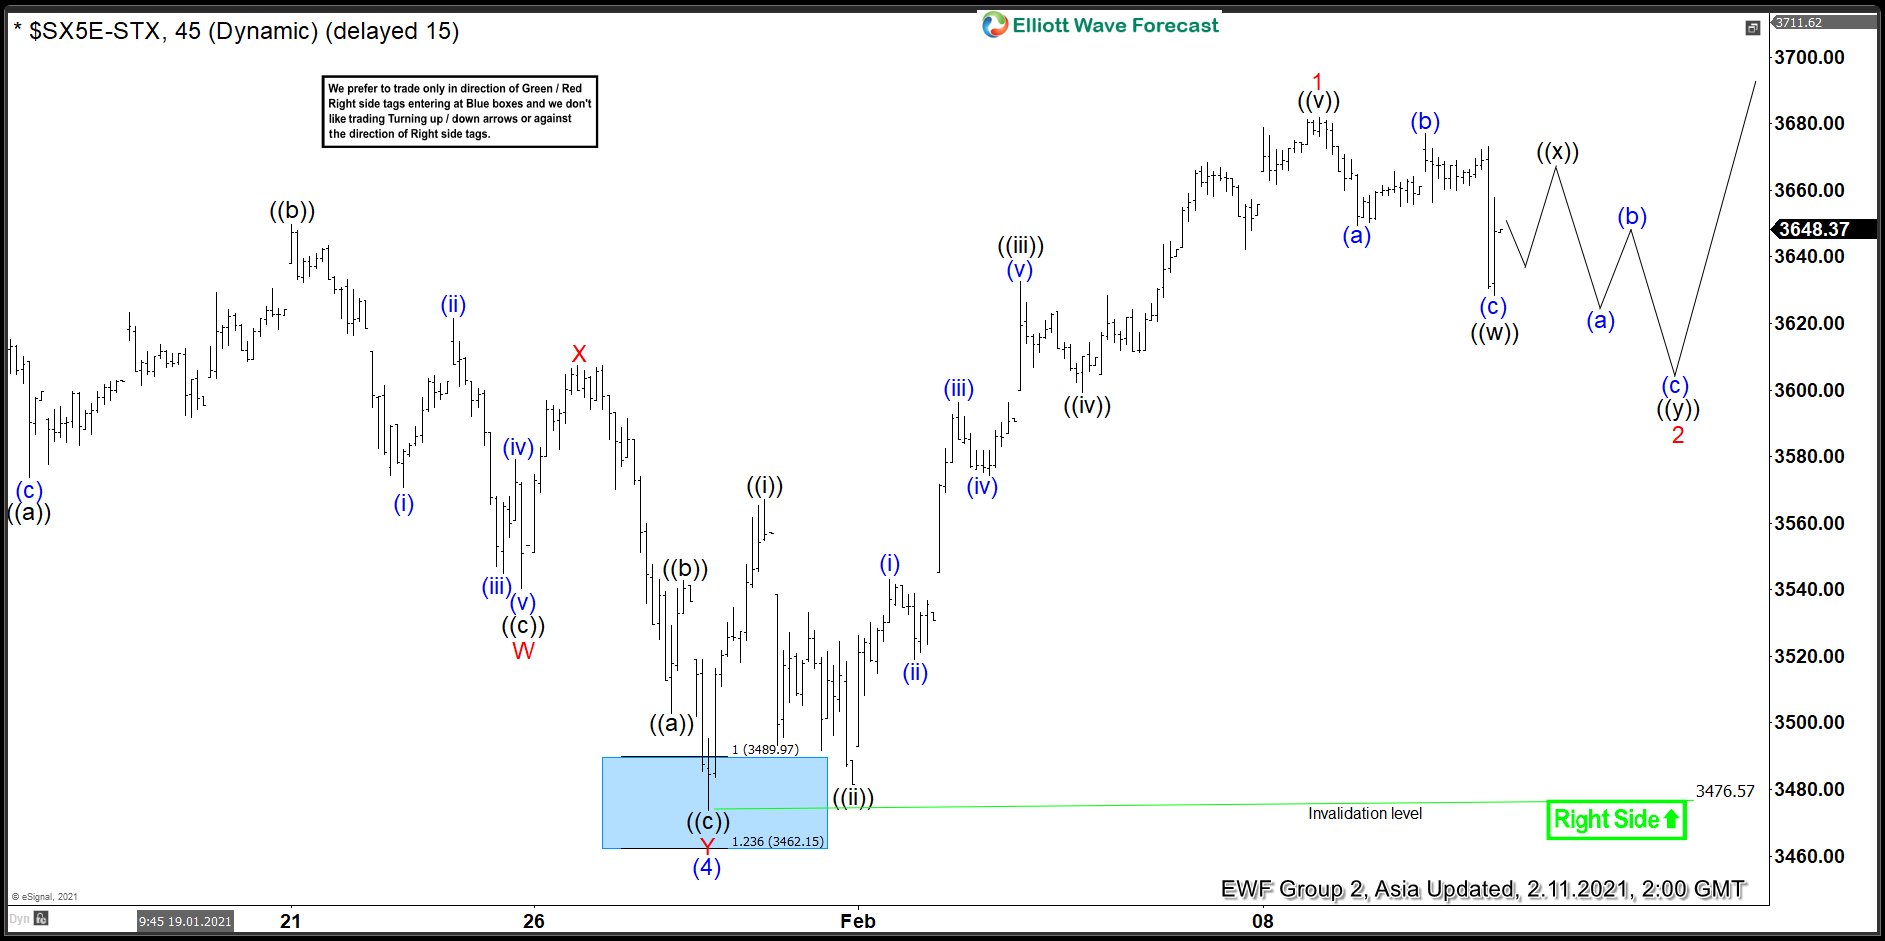
Eurostoxx Showing 5 Waves From March Lows Favoring More Strength
Read MoreThe cycle from March 2020 low in Eurostoxx remains incomplete and Index should see further upside. This article and video look at the Elliott Wave path.
-
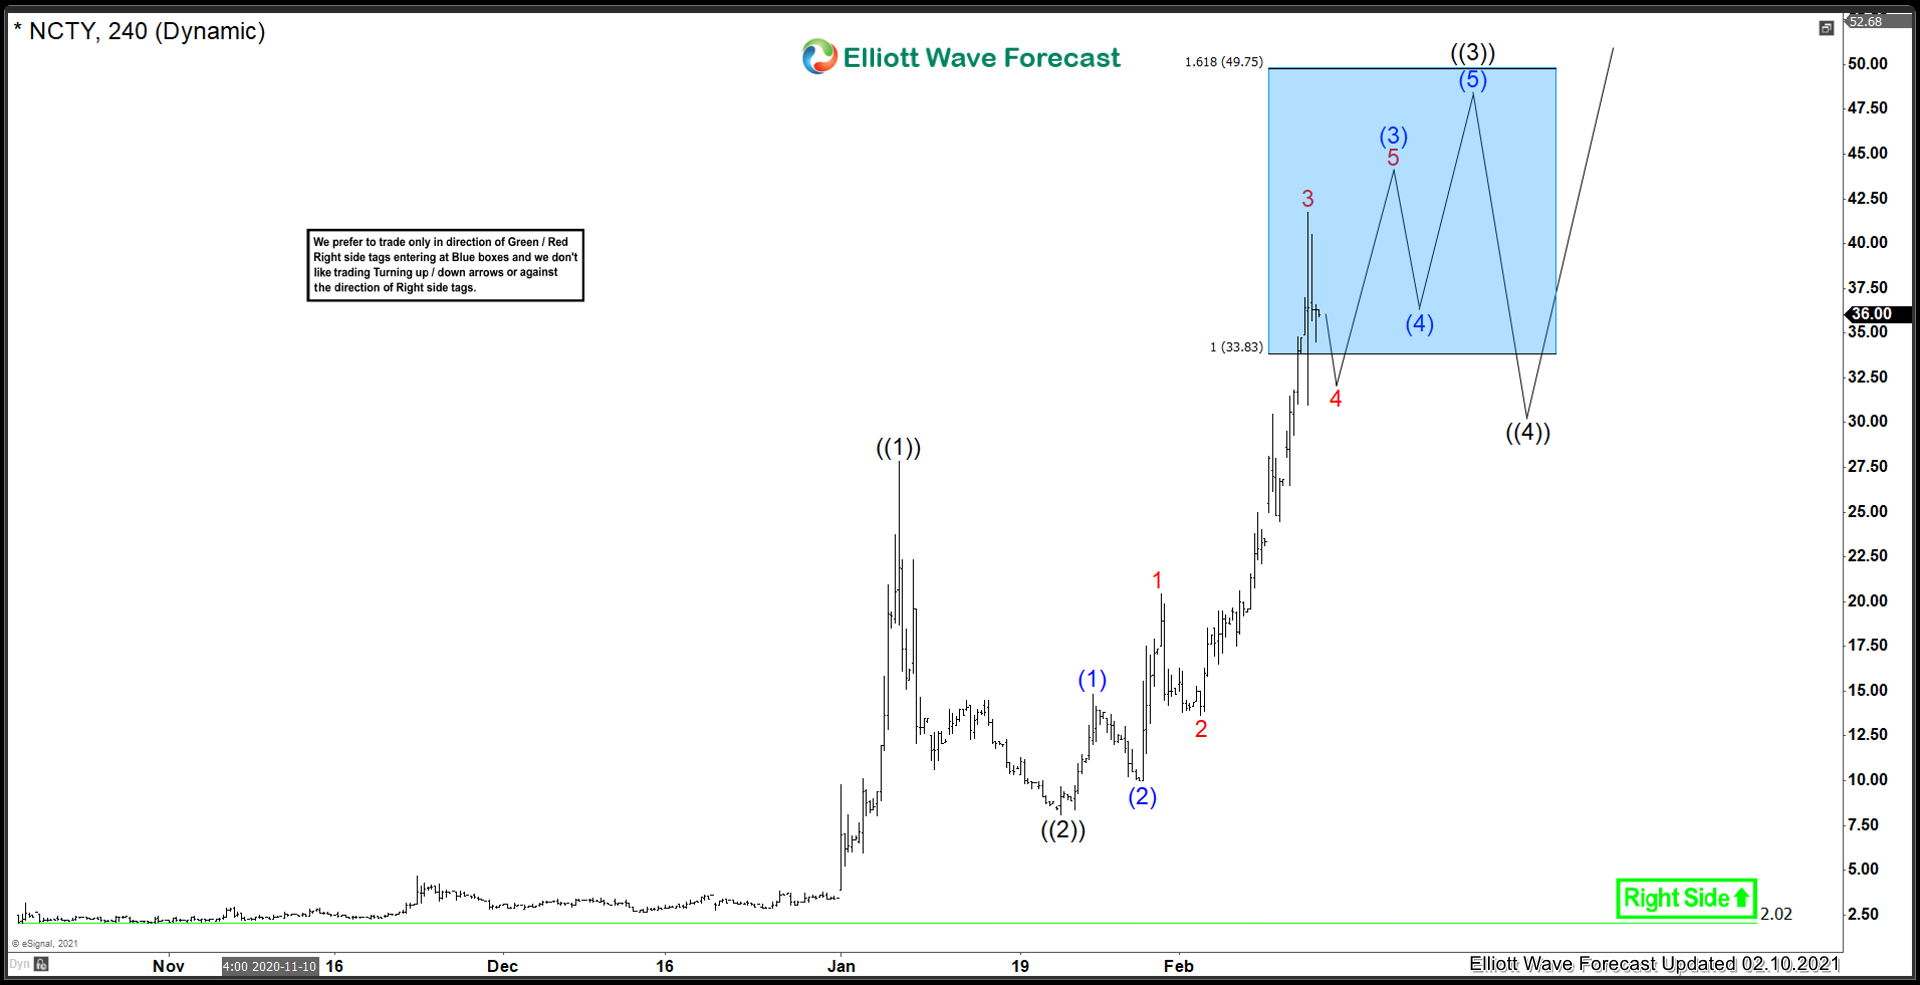
The9 ($NCTY) Charging Higher
Read MoreWhat do you get when you combine a Chinese based online game operator, with Bitcoin mining? You get a powerful trending stock called The9! This stock is currently on a high momentum run. Before we move further, lets take a look at the company profile: “The9 Ltd. is a Shanghai-based online game operator which had the exclusive licence […]
-
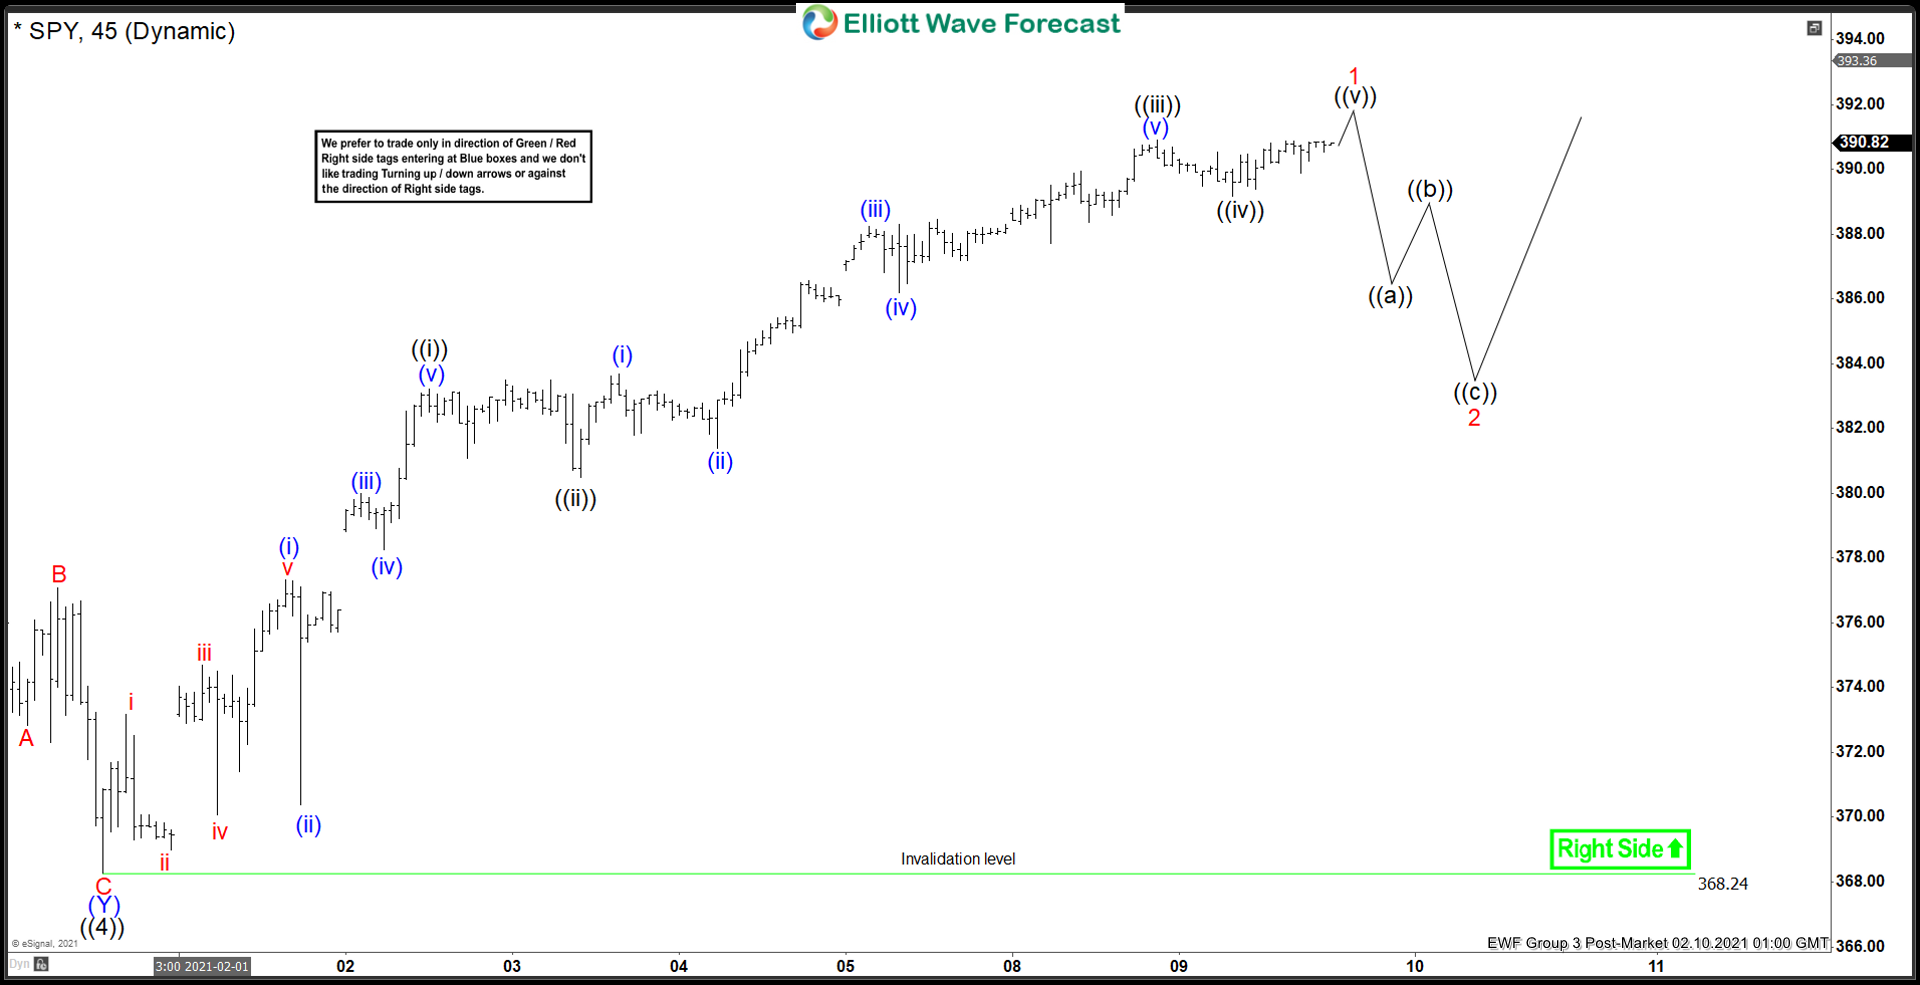
Elliott Wave View: SPY Looking for a Pullback
Read MoreSPY cycle from January 30 low is close to completion and pullback is expected. This article and video look at the Elliott Wave path.
-
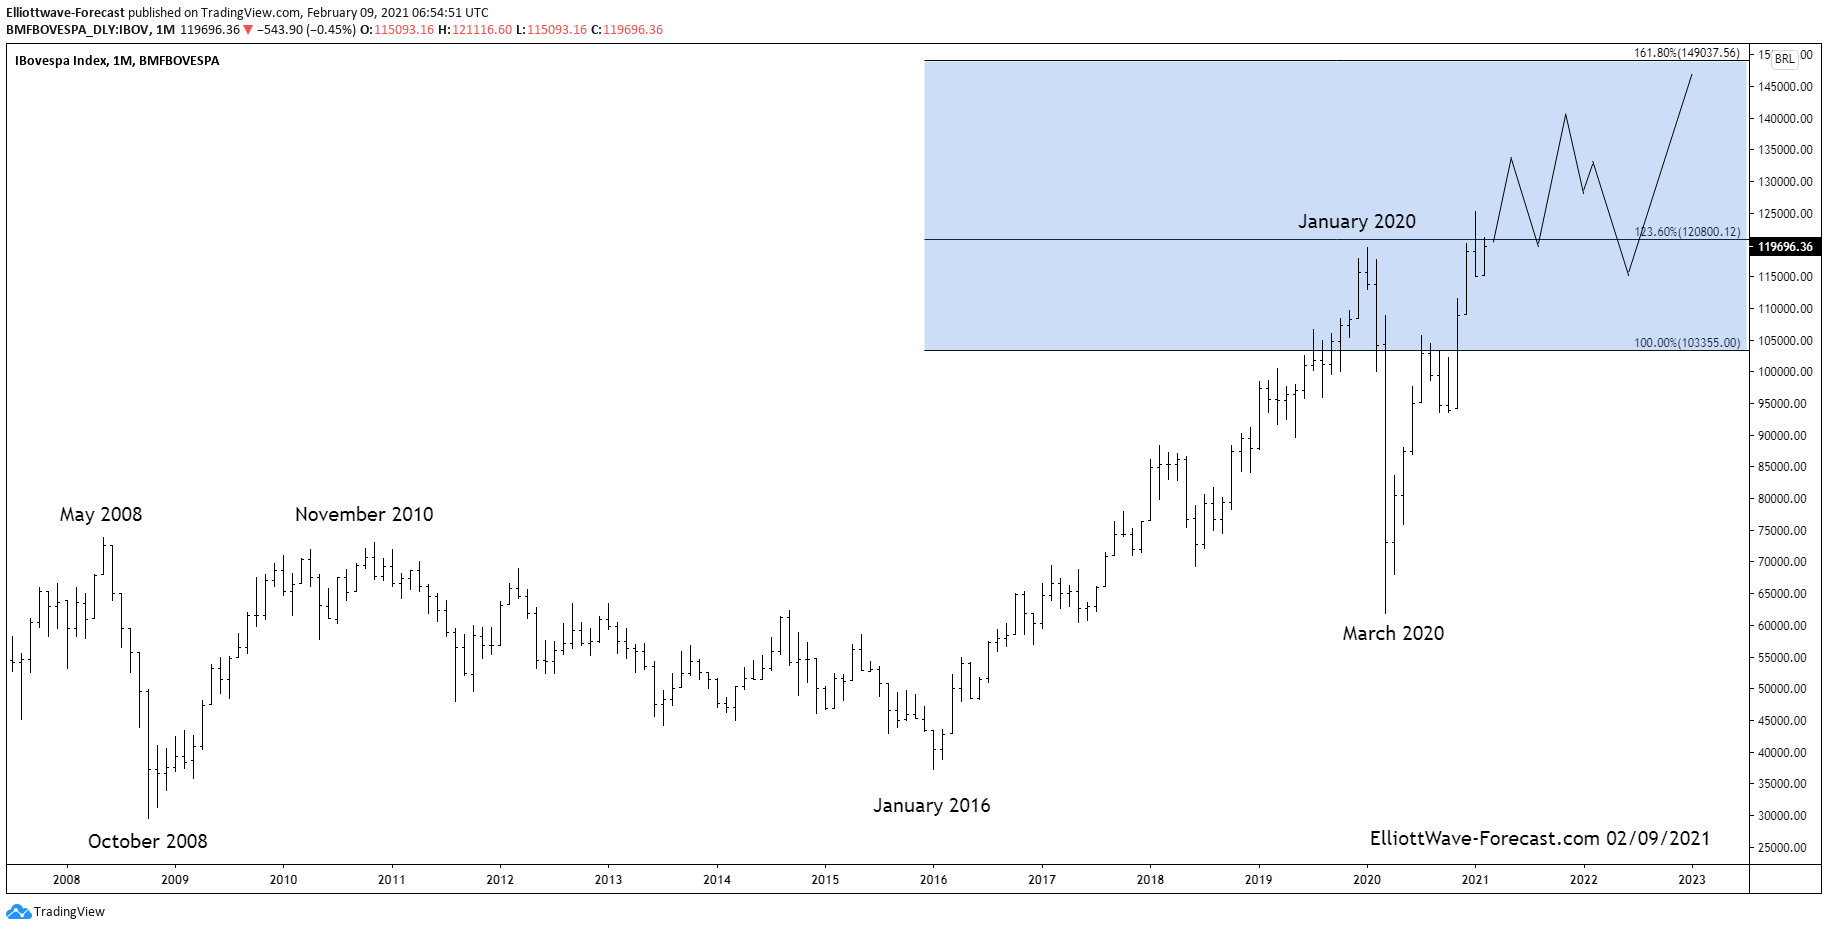
Bovespa Brazil Index Long Term Cycles and Bullish Trend
Read MoreBovespa Brazil Index Long Term Cycles and Bullish Trend The Bovespa Index has been trending higher with other world indices. Since inception the cycles have shown a bullish trend. In early years not seen on this chart it rallied with other world indices trending higher into the May 2008 highs. It then corrected the whole bullish cycle […]
-
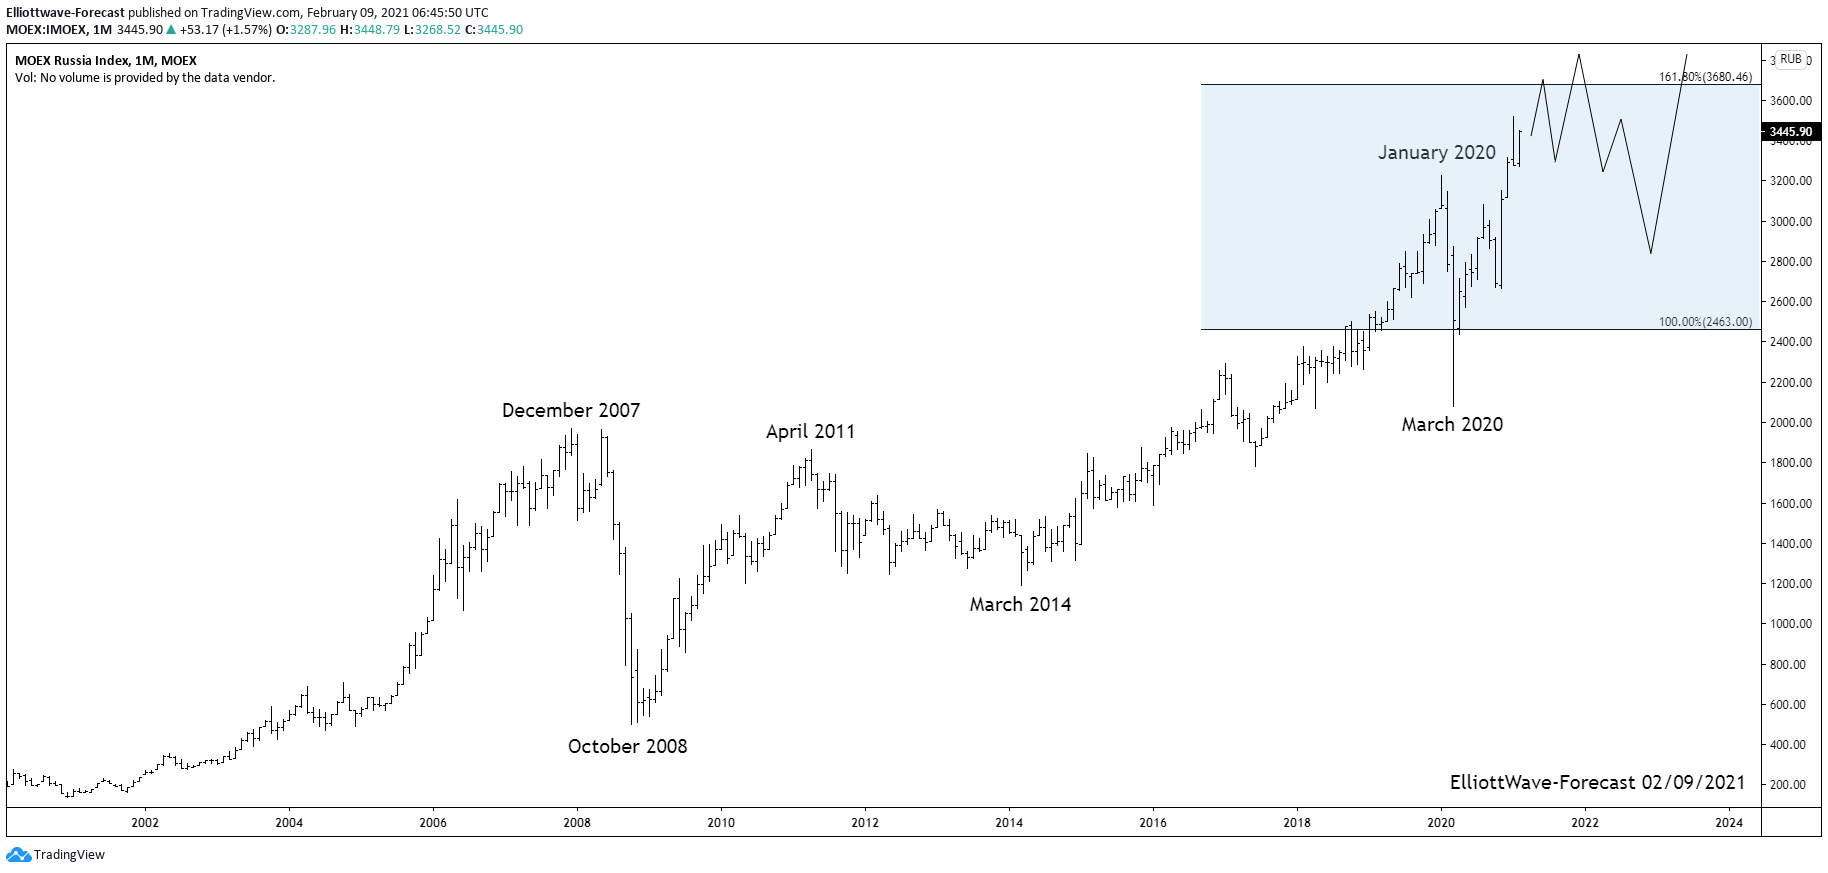
MOEX Russian Index Long Term Cycles and Bullish Trend
Read MoreMOEX Russian Index Long Term Cycles and Bullish Trend The MOEX Russian index has trended higher with other world indices since inception. The index remained in a long term bullish trend cycle into the December 2007 highs. It made a sharp correction lower in 2008 that lasted until October 2008 similar to other world indices. […]