

The Power of 3-7-11 and the Grand Super Cycle: How We Saw the Bullish Turn in April 2025 Back on April 9, 2025, while World Indices were dropping sharply and global sentiment had turned overwhelmingly bearish, we published an article that challenged the fear-driven narrative. We explained why selling was not the right approach and […]
-
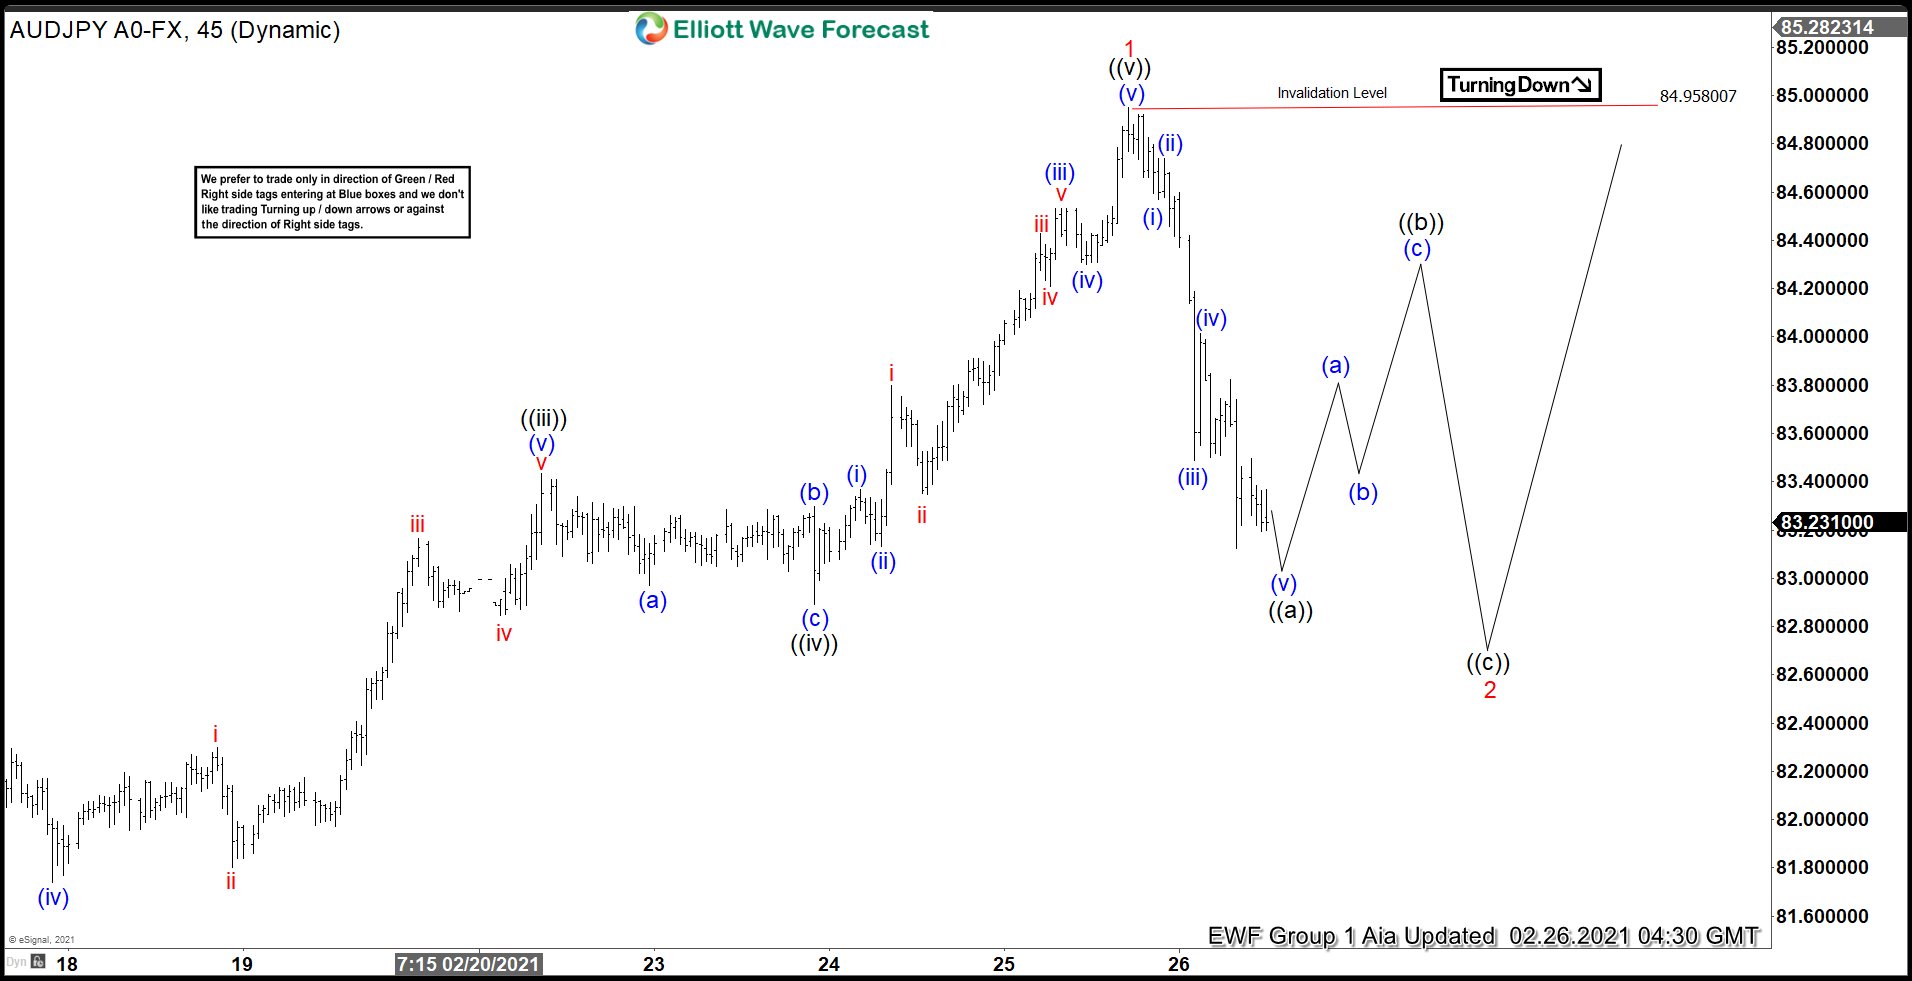
Elliott Wave View: AUDJPY Looking For 3 Waves Pullback
Read MoreAUDJPY is correcting cycle from January 29 low in a larger 3 waves. This article and video look at the Elliott Wave path for the pair.
-
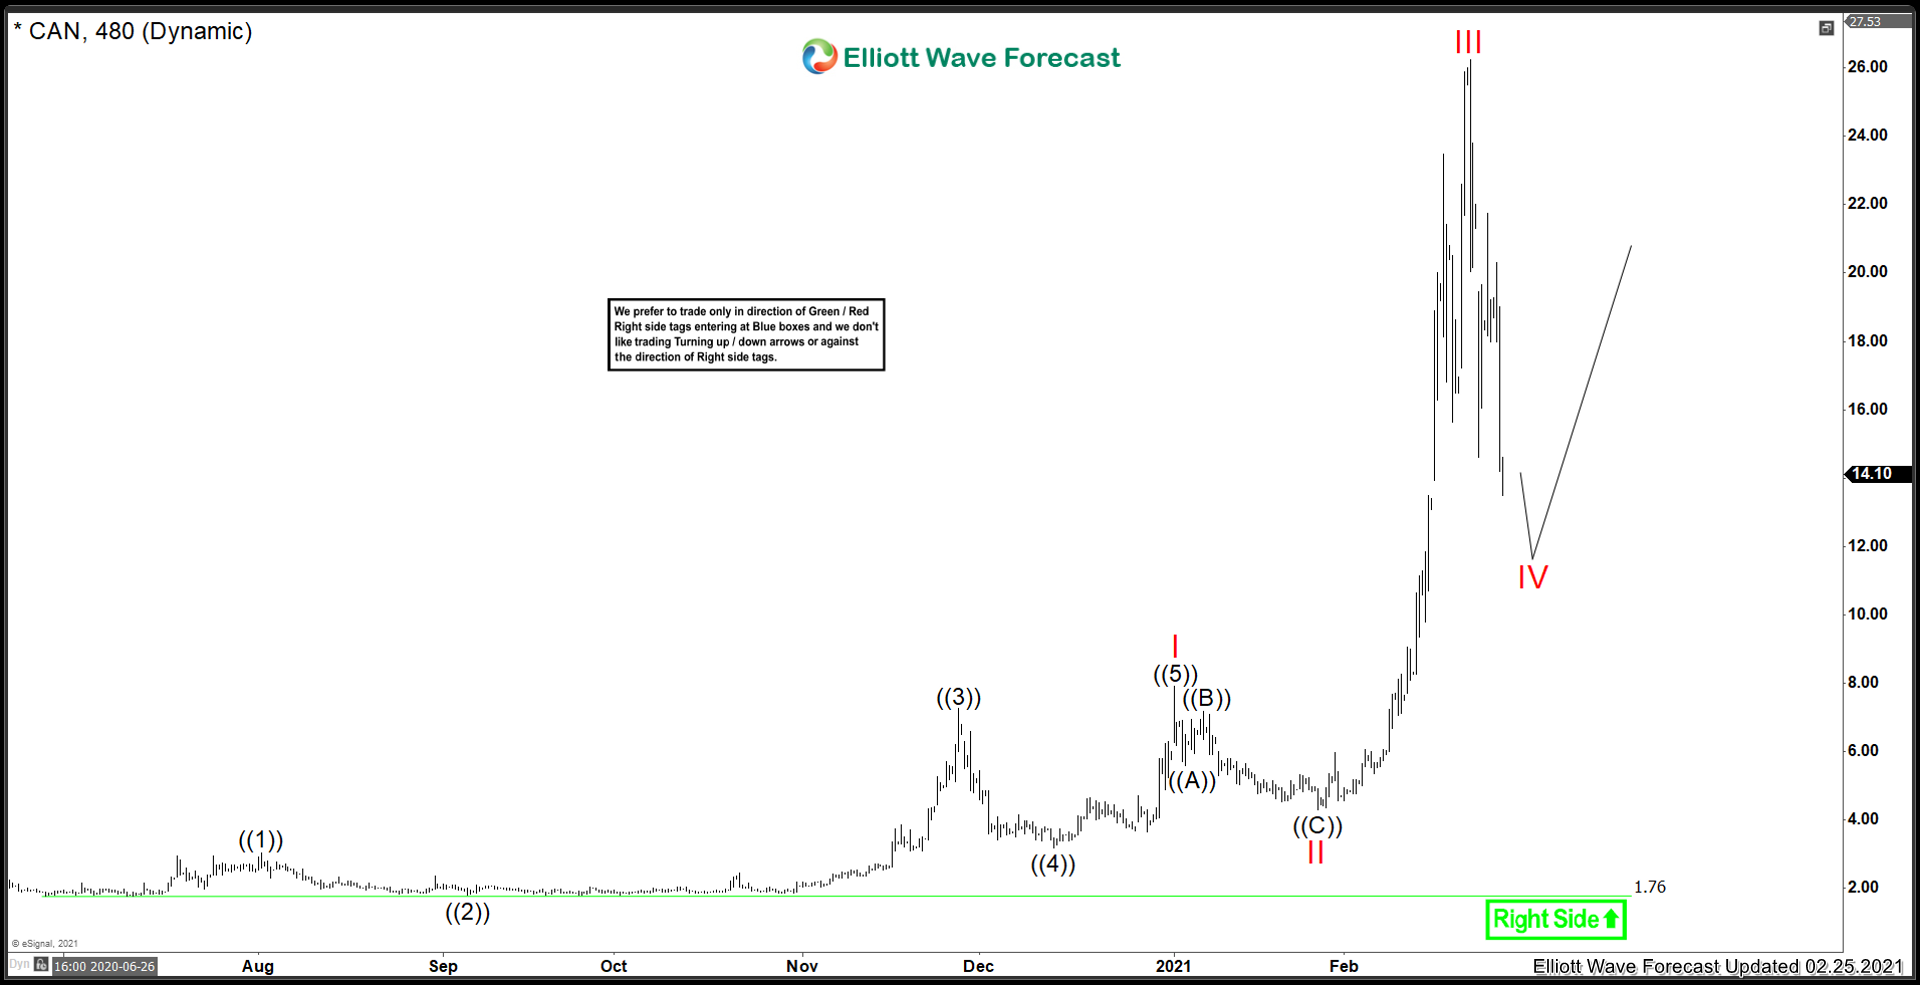
Canaan Creative ($CAN) More Upside In Store?
Read MoreBitcoin miners and hardware makers have had a breathtaking January and February. But is there more upside still to be had? Today we’ll be taking a look at Canaan Creative ($CAN). They are a hardware manufacturer who makes Bitcoin mining equipment. Lets take a look at the company profile: “Canaan Creative, known simply as Canaan, is […]
-
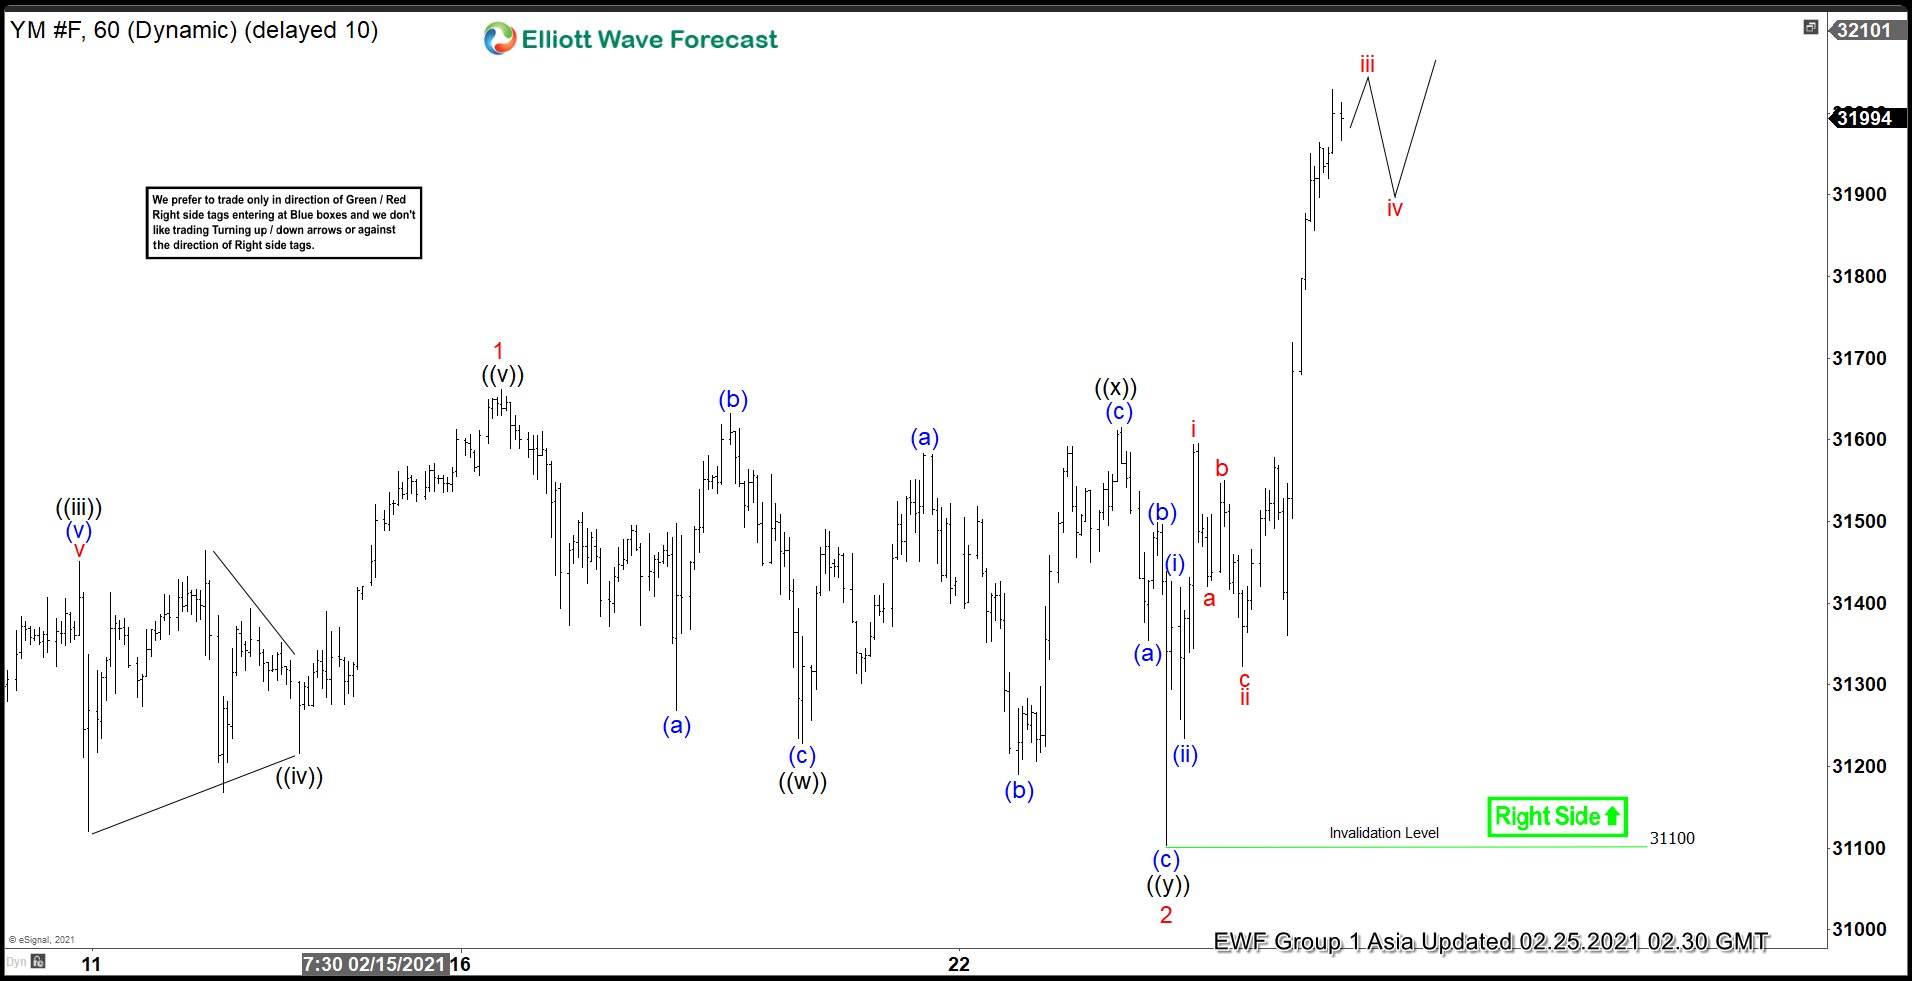
Elliott Wave View: Dow Futures (YM) Should Continue to Print All-Time High
Read MoreDow Futures has made an all time high and should continue higher. This article and video look at the Elliott Wave path of the Index.
-
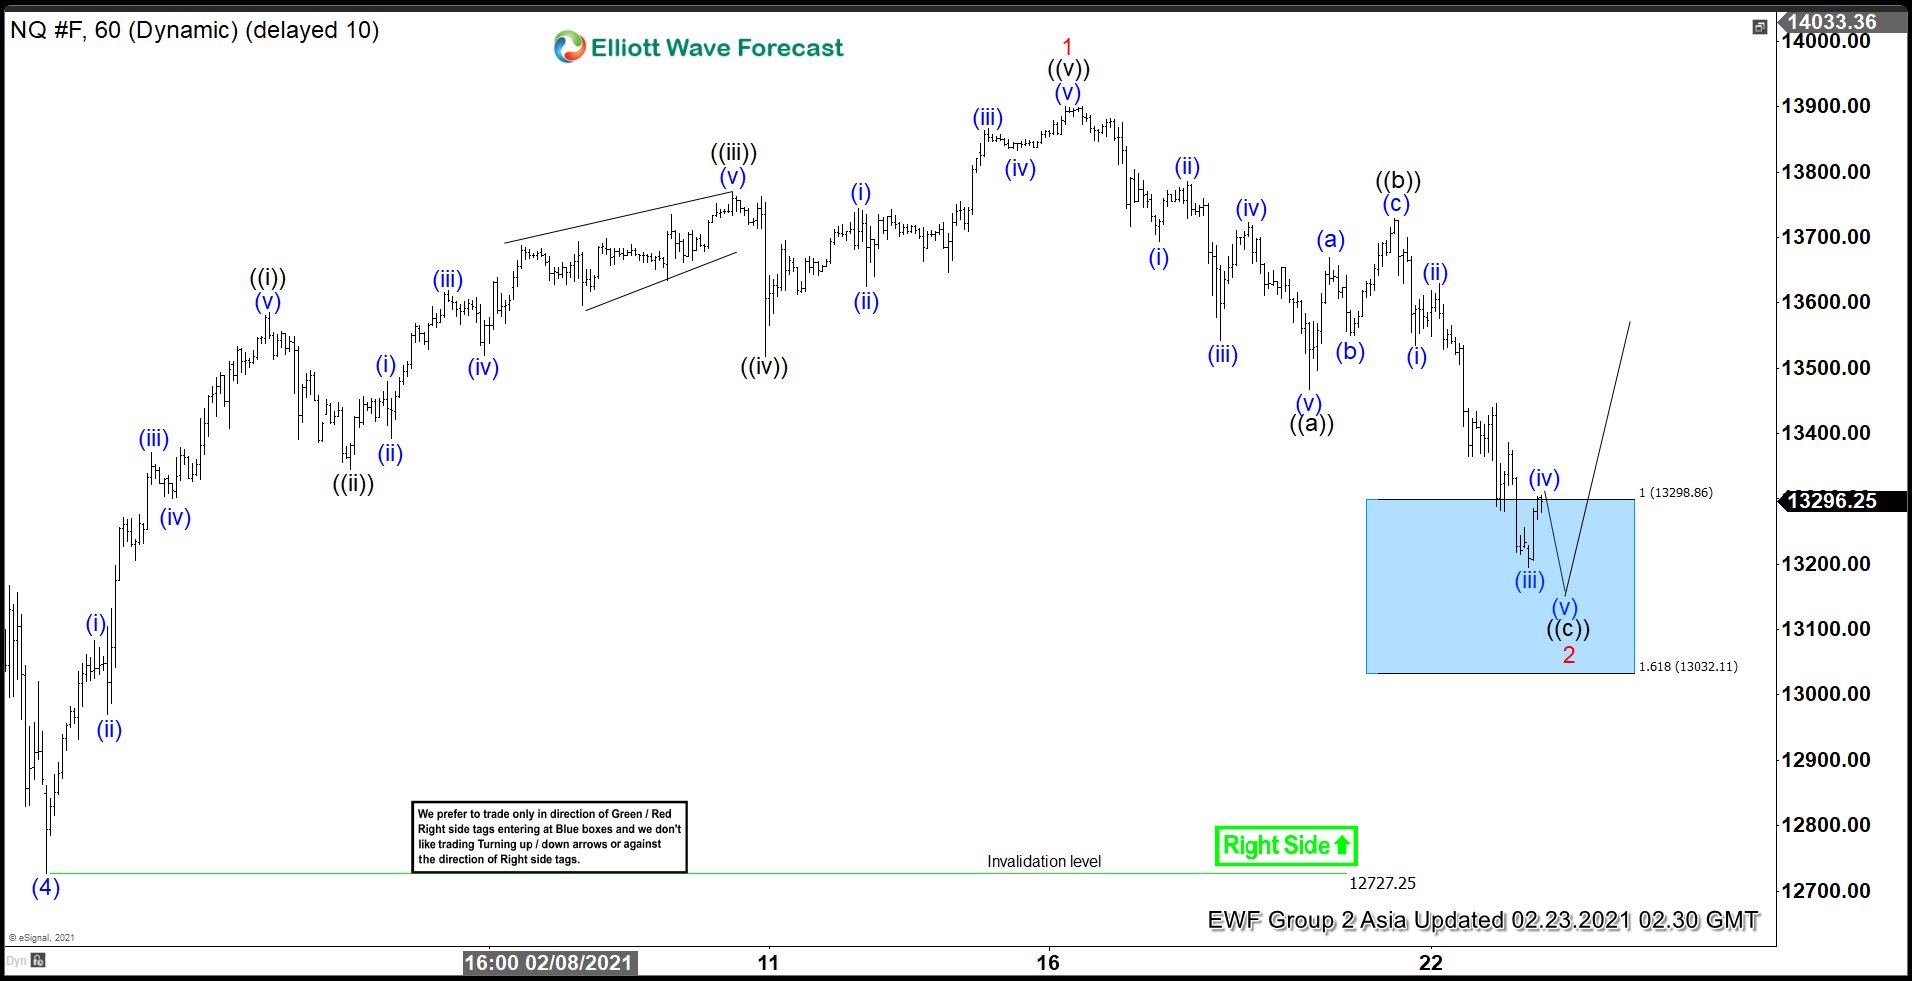
Elliott Wave View: Nasdaq at Support Area
Read MoreNasdaq has reached the support area from February 16 high and soon can see buyers for more upside. This article and video look at the Elliott Wave path.
-
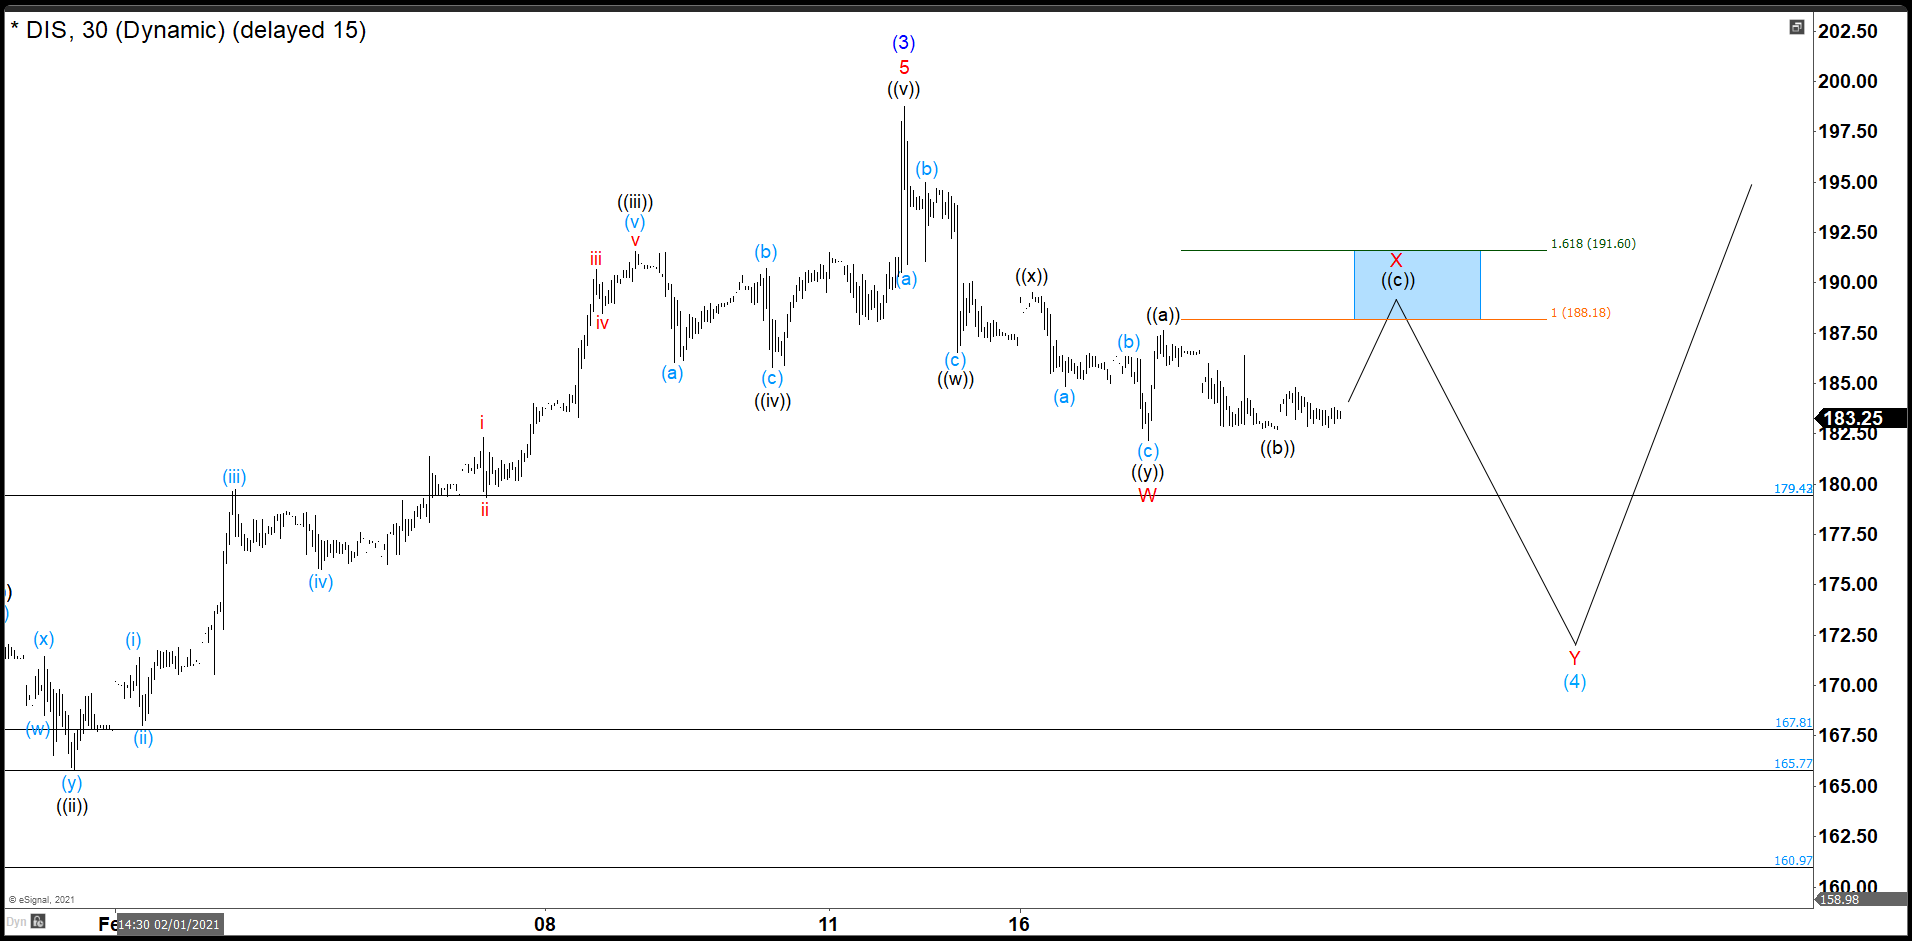
Disney Completed Wave W and Still It is in Corrective Mode
Read MoreSince the crash of March 2020, all stocks have tried to recover what they lost and Disney was no exception. Disney did not only recover the lost, but It also reached historic highs. Now, we are going to try to build an impulse from the March 2020 lows with a target around $230. Target measured […]
-
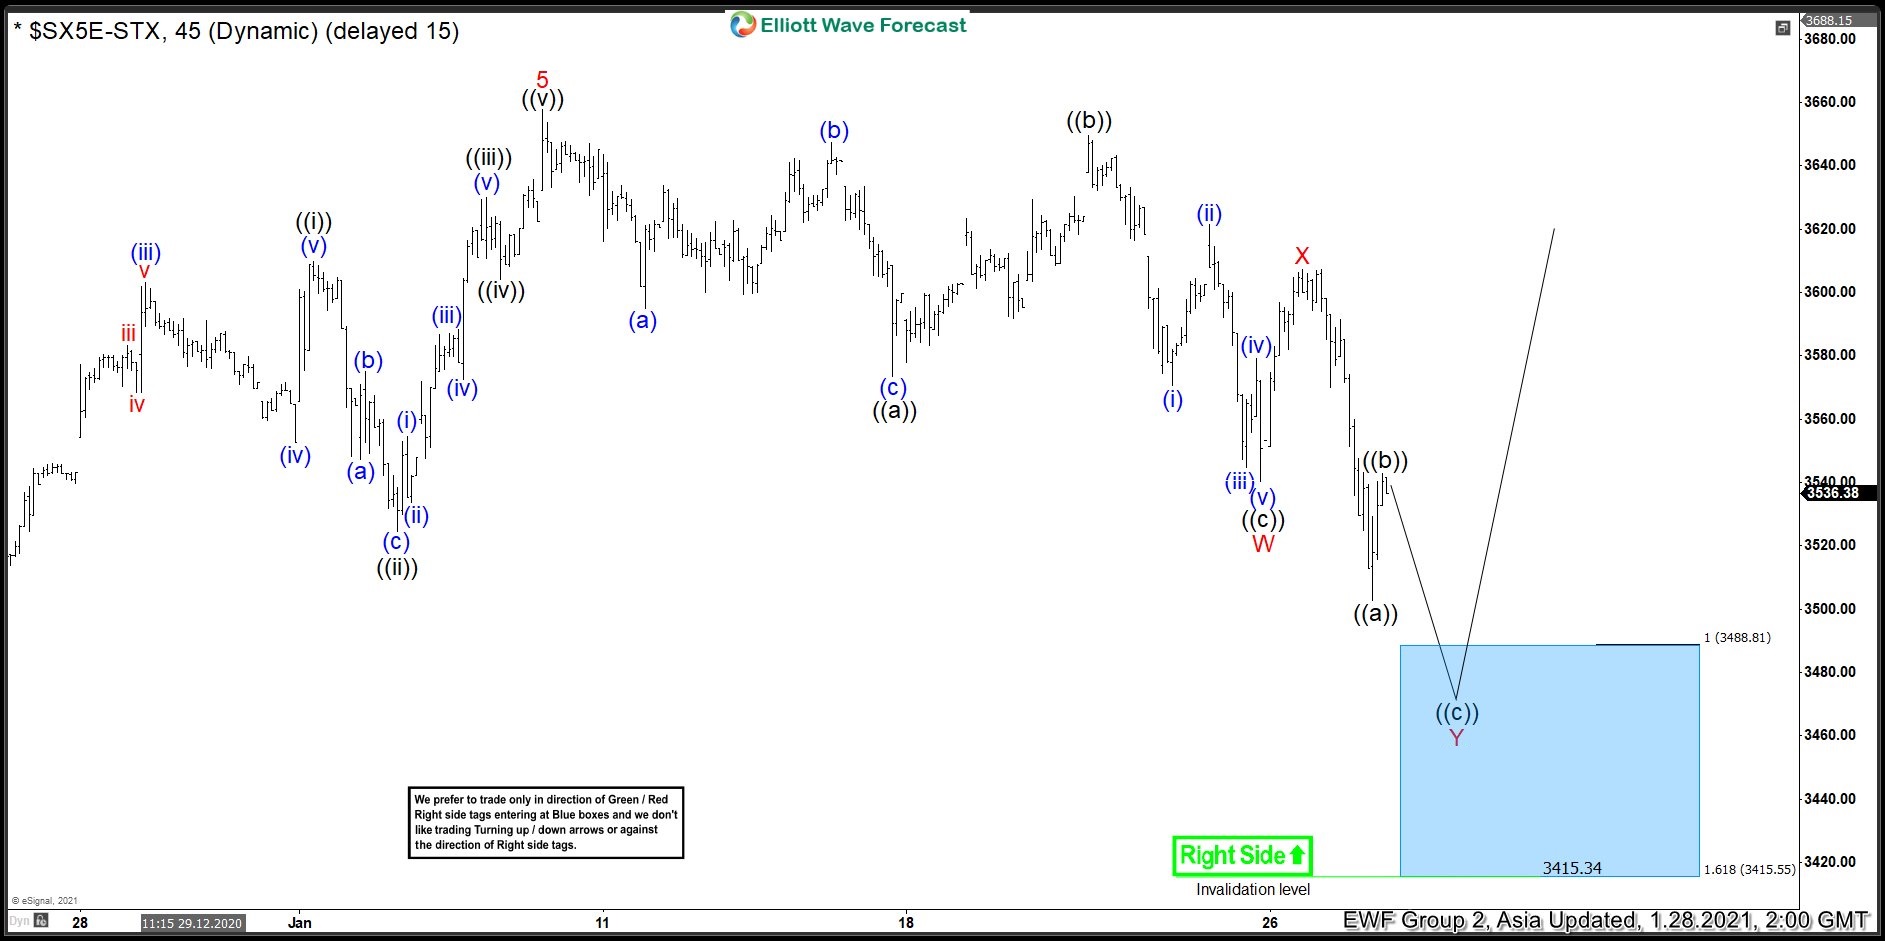
EuroStoxx Buying The Dip After Double Correction Lower
Read MoreIn this blog, we take a look at the past performance of 1 hour Elliott Wave charts of EuroStoxx In which our members took advantage of the blue box areas.