

The Power of 3-7-11 and the Grand Super Cycle: How We Saw the Bullish Turn in April 2025 Back on April 9, 2025, while World Indices were dropping sharply and global sentiment had turned overwhelmingly bearish, we published an article that challenged the fear-driven narrative. We explained why selling was not the right approach and […]
-
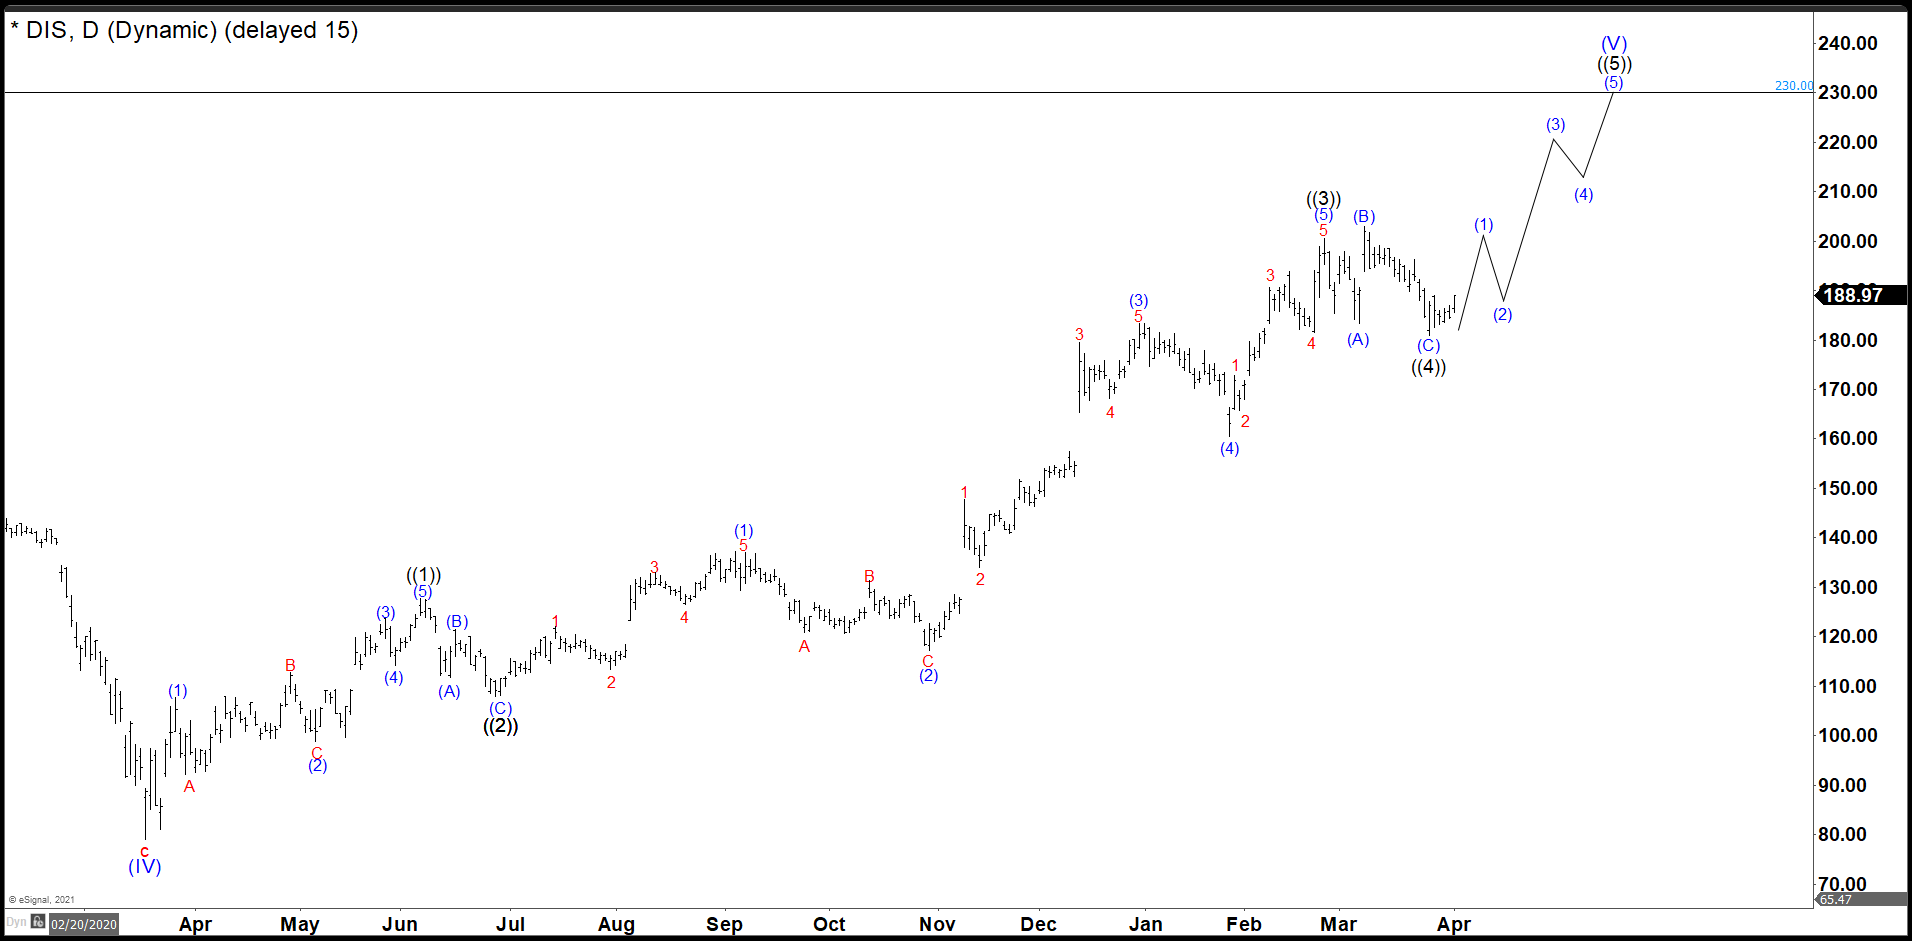
Disney Failed the Diagonal And The Irregular Flat Played Out
Read MoreSince the crash of March 2020, all stocks have tried to recover what they lost, and Disney was no exception. Disney did not only recover the lost, but It also reached historic highs. Now, we are going to try to build an impulse from the March 2020 lows with a target around $230. Target measured […]
-
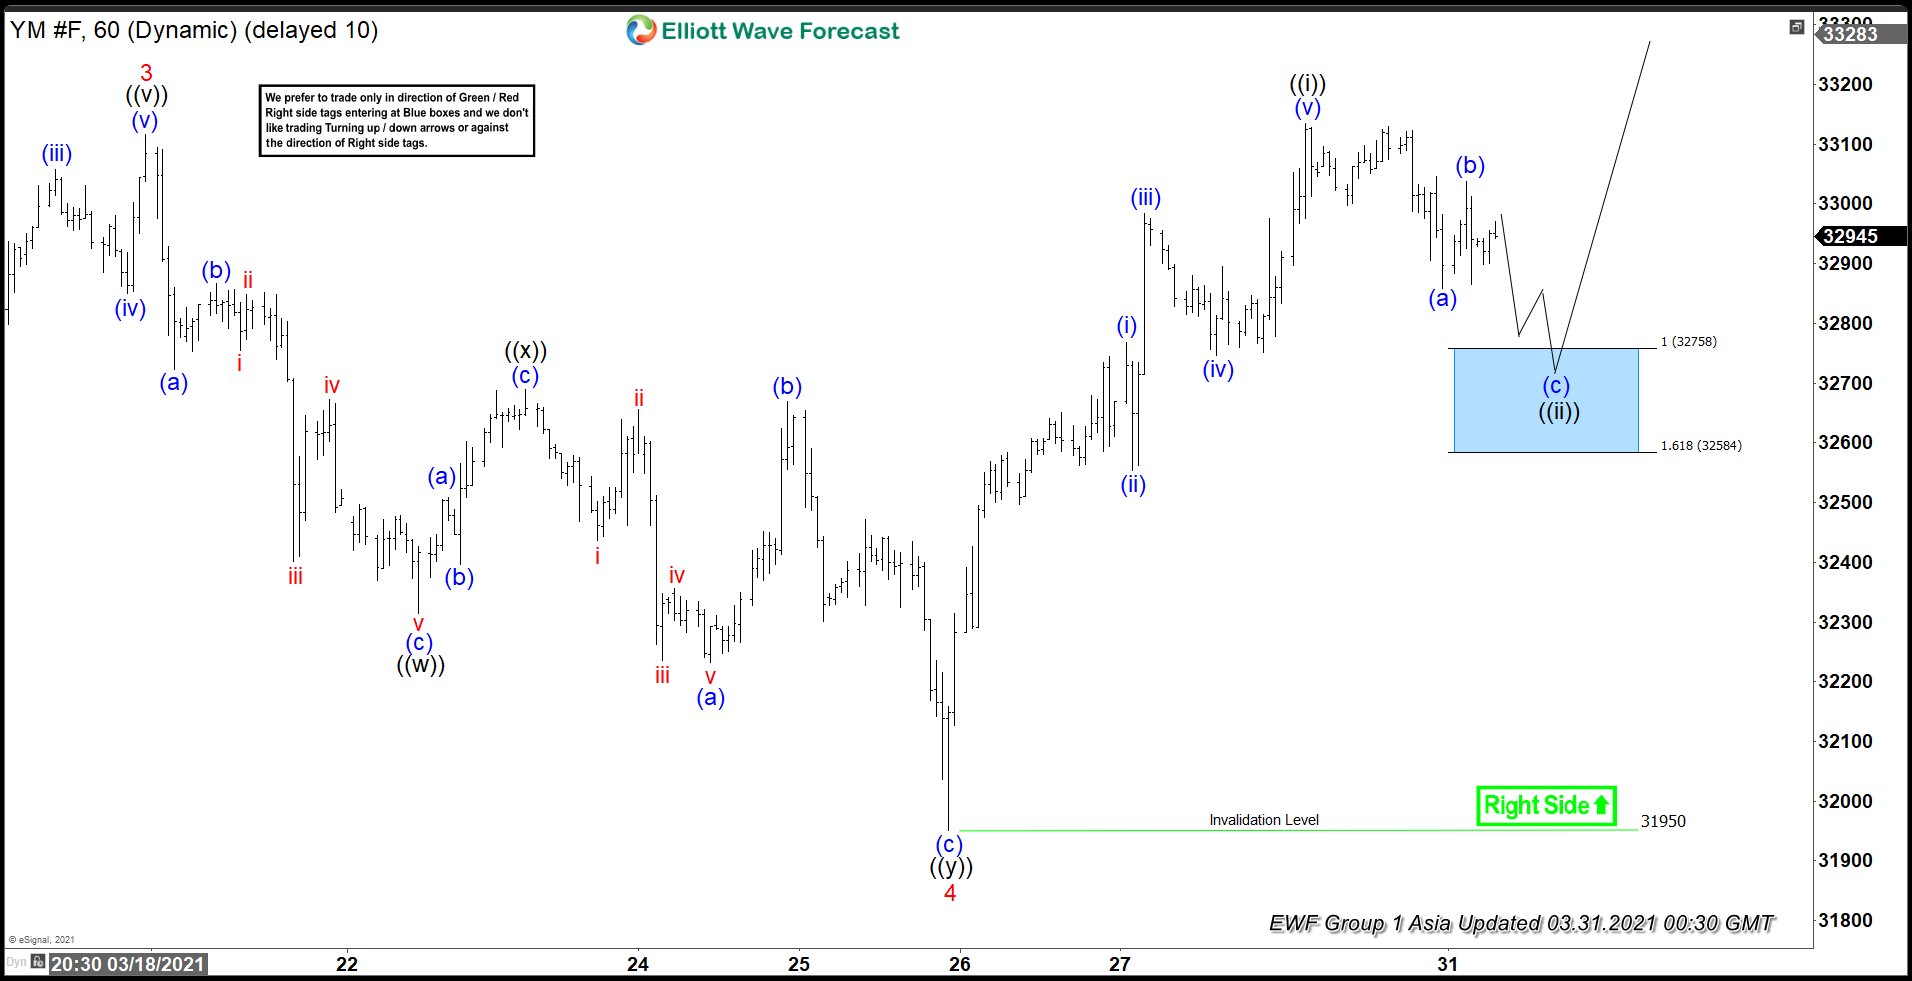
Elliott Wave View: Dow Futures (YM) Extends Higher
Read MoreDow Futures (YM) has extended to new high and dips should find support in 3, 7, or 11 swing. This article and video look at the Elliott Wave path.
-
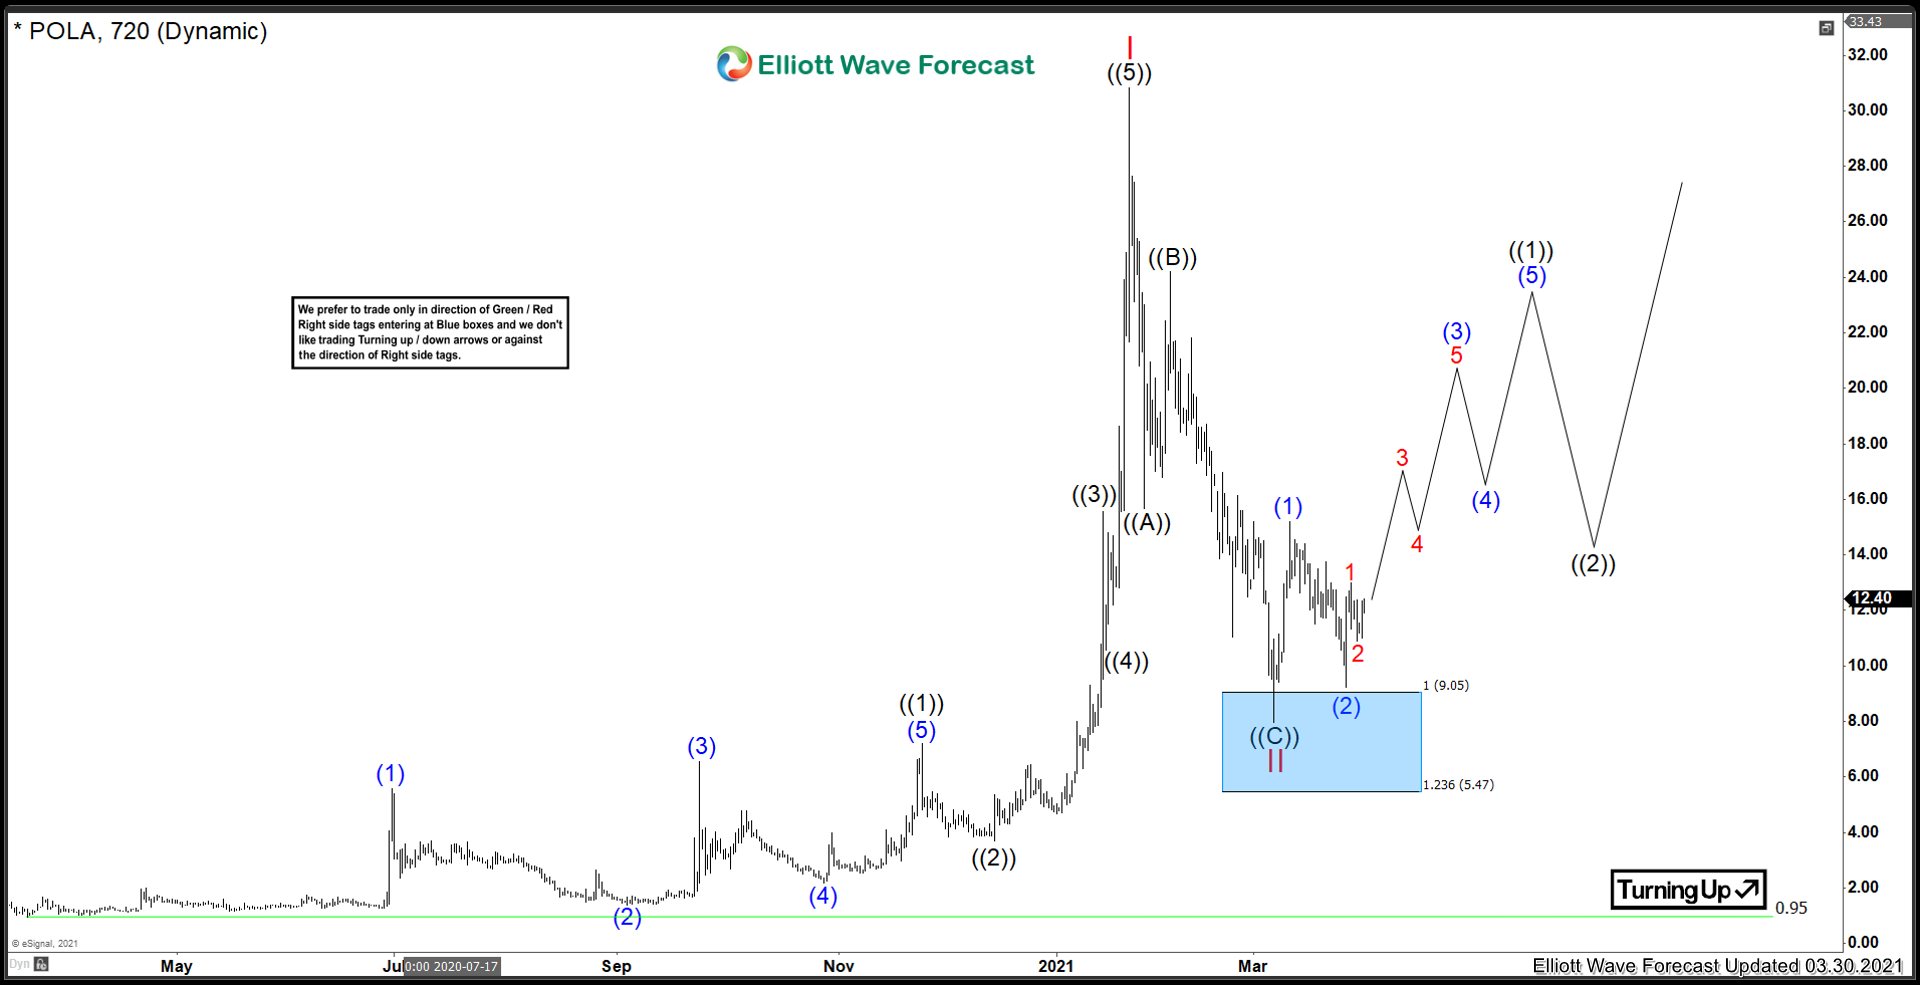
Polar Power ($POLA) Ready To Move Higher
Read MoreThe Clean Energy sector has been just as hot as the EV sector in 2020. Both sectors appear to move together in some degrees. Polar Power is one of those companies that has exploded off the March 2020 low, moving from 95 cents to a high of 30.82 in early 2021. This represents a 3300% […]
-
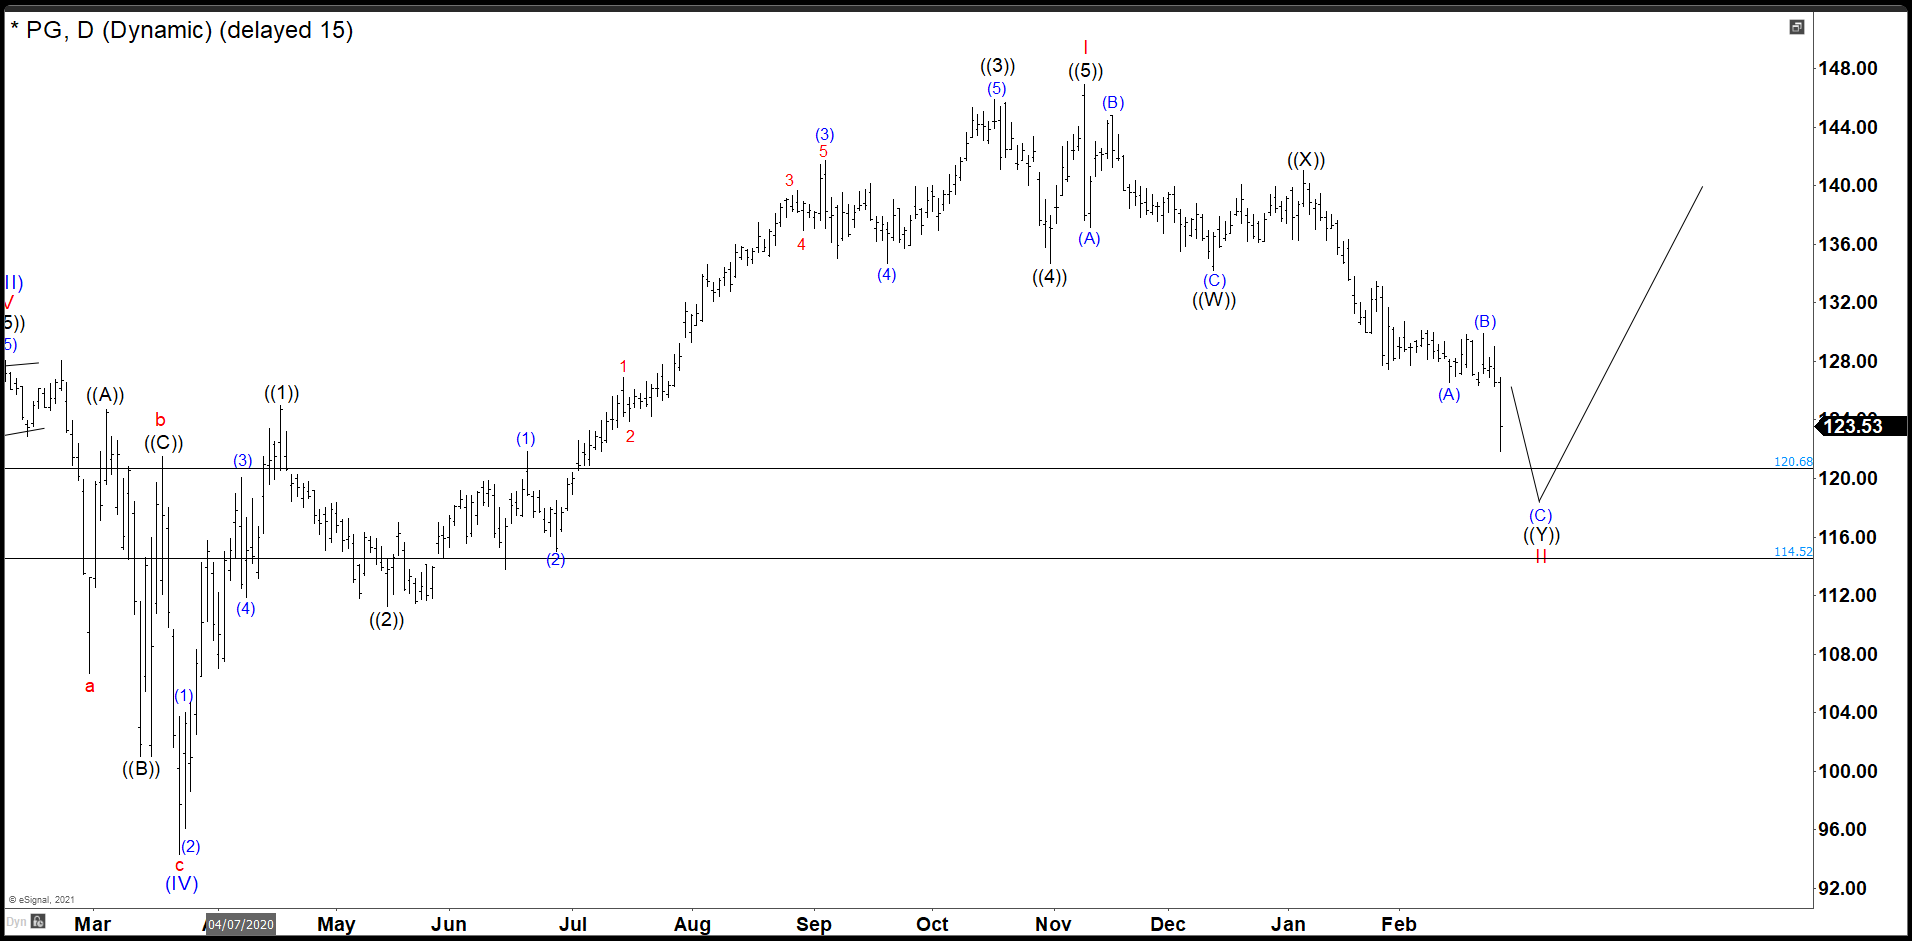
P&G Bounced Nicely Missing The Ideal Entry Area By Cents
Read MoreSince the crash of March 2020, all stocks have tried to recover what they lost and P&G was no exception. P&G did not only recover the lost, but It also reached historic highs. Now, we are going to try to build an impulse from wave II with a first target to $154.00 next $167.50 and […]
-

Top 15 Most Volatile Stocks for 2024
Read MoreThe stock market has always been volatile. Economic ups and downs, political activities, and changes in government rules and regulations always give a jolt to the stock market. In addition to the market’s volatility, there are always a set of stocks that have greater price movements and make them amongst the most volatile stocks to […]
-
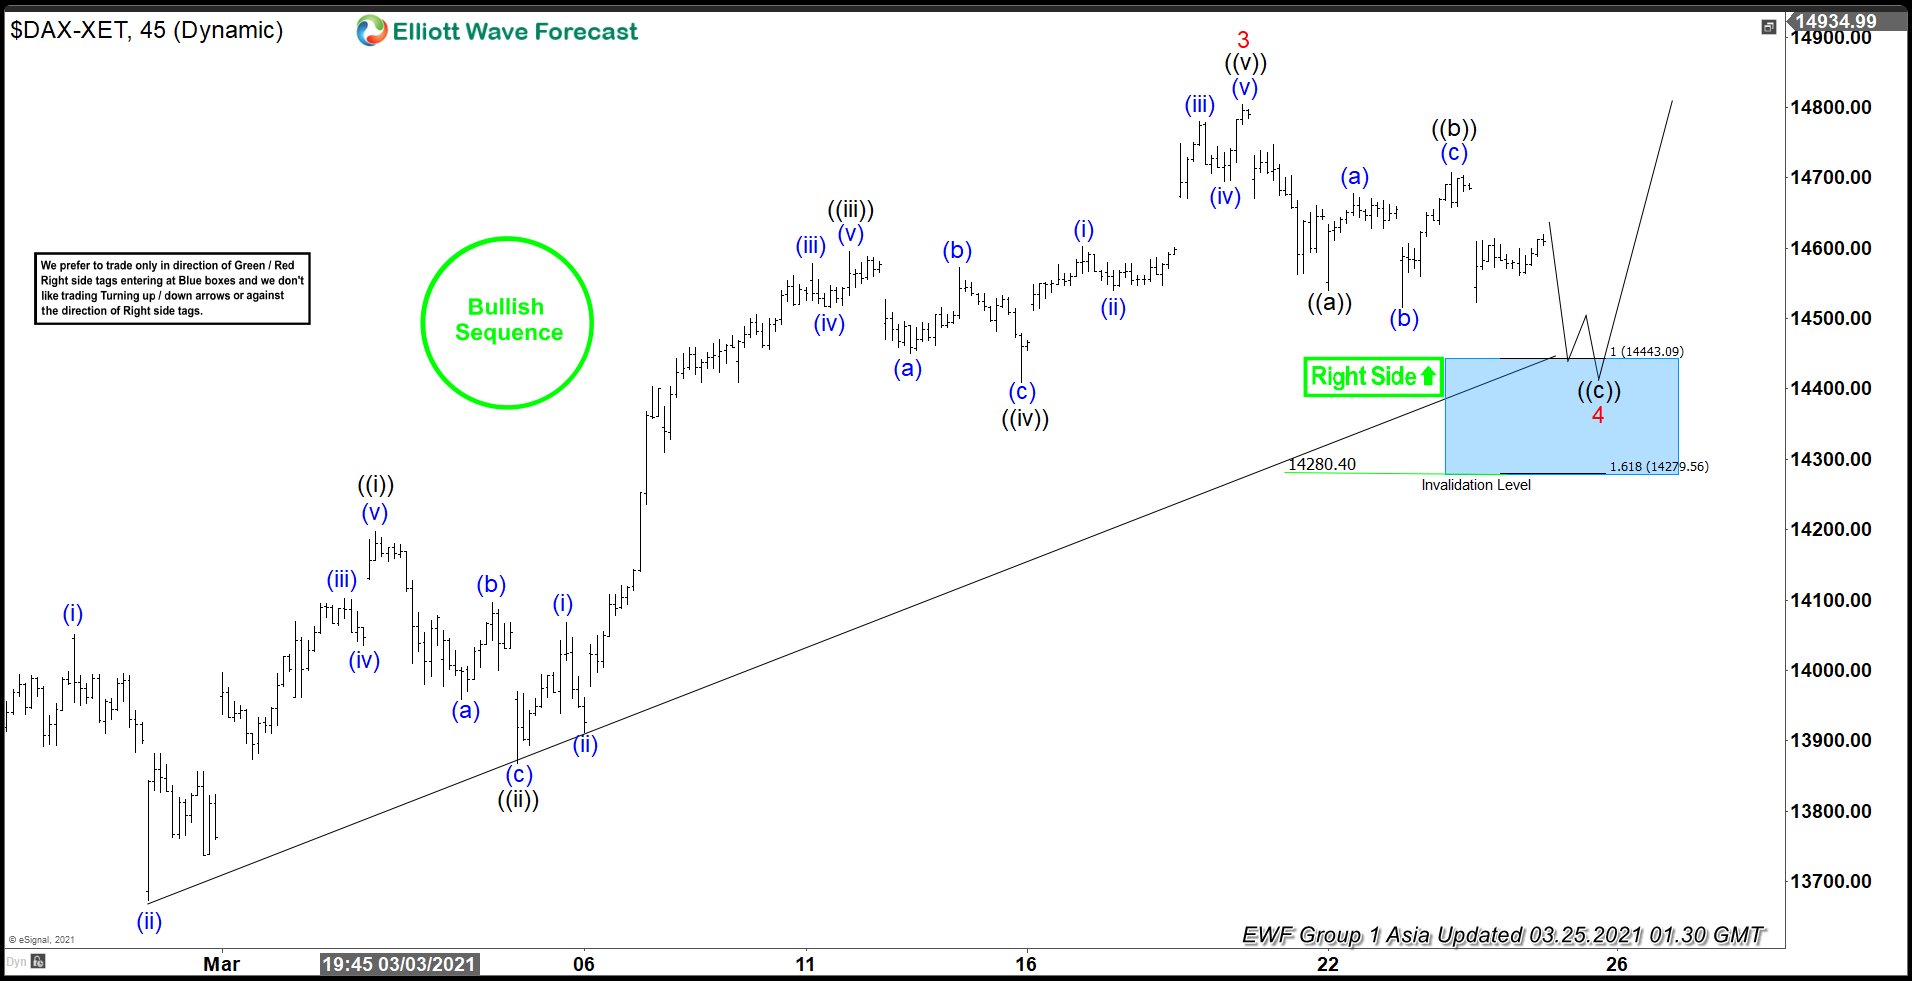
Elliott Wave View: DAX Correction Near Complete
Read MoreDAX is correcting cycle from February 23 low and can see support soon. This article and video look at the Elliott Wave path.