

The Power of 3-7-11 and the Grand Super Cycle: How We Saw the Bullish Turn in April 2025 Back on April 9, 2025, while World Indices were dropping sharply and global sentiment had turned overwhelmingly bearish, we published an article that challenged the fear-driven narrative. We explained why selling was not the right approach and […]
-
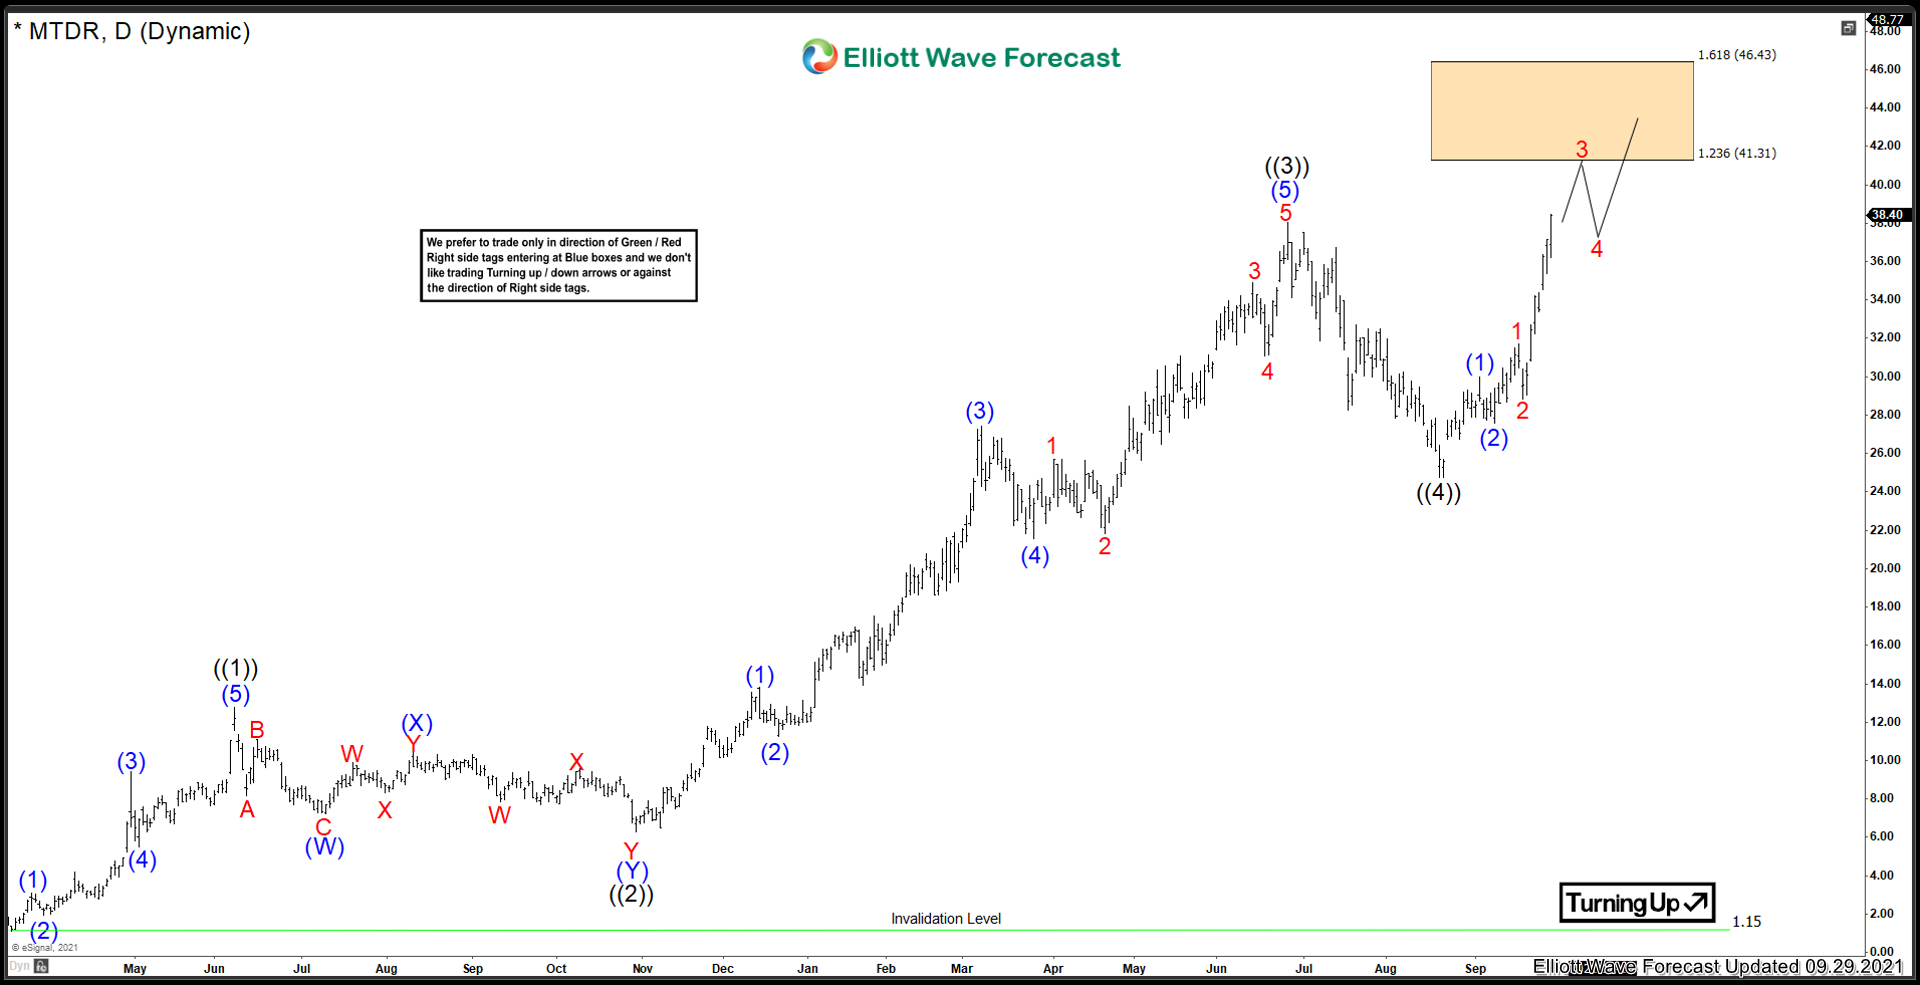
Matador Resources Co ($MTDR) Advancing in 5th Wave
Read MoreThe last time I analyzed this company (article can be found here), it was close to setting a low in wave ((2)) before moving higher in a wave ((3)). Before I get into the charts, lets check out the company profile: “Matador Resources Company is an independent energy company engaged in the exploration, development, production […]
-

LUV (Southwest Airlines) shows a nice Elliott wave structure
Read MoreLUV (Soutwest Airlines) shows a very constructive price action since the all-time lows. We can see a very nice impulse or five waves into the peak in 2017. The Elliott Wave Theory’s main message is that the trend advances in five waves and then a pullback in three waves. The following chart is a representation […]
-
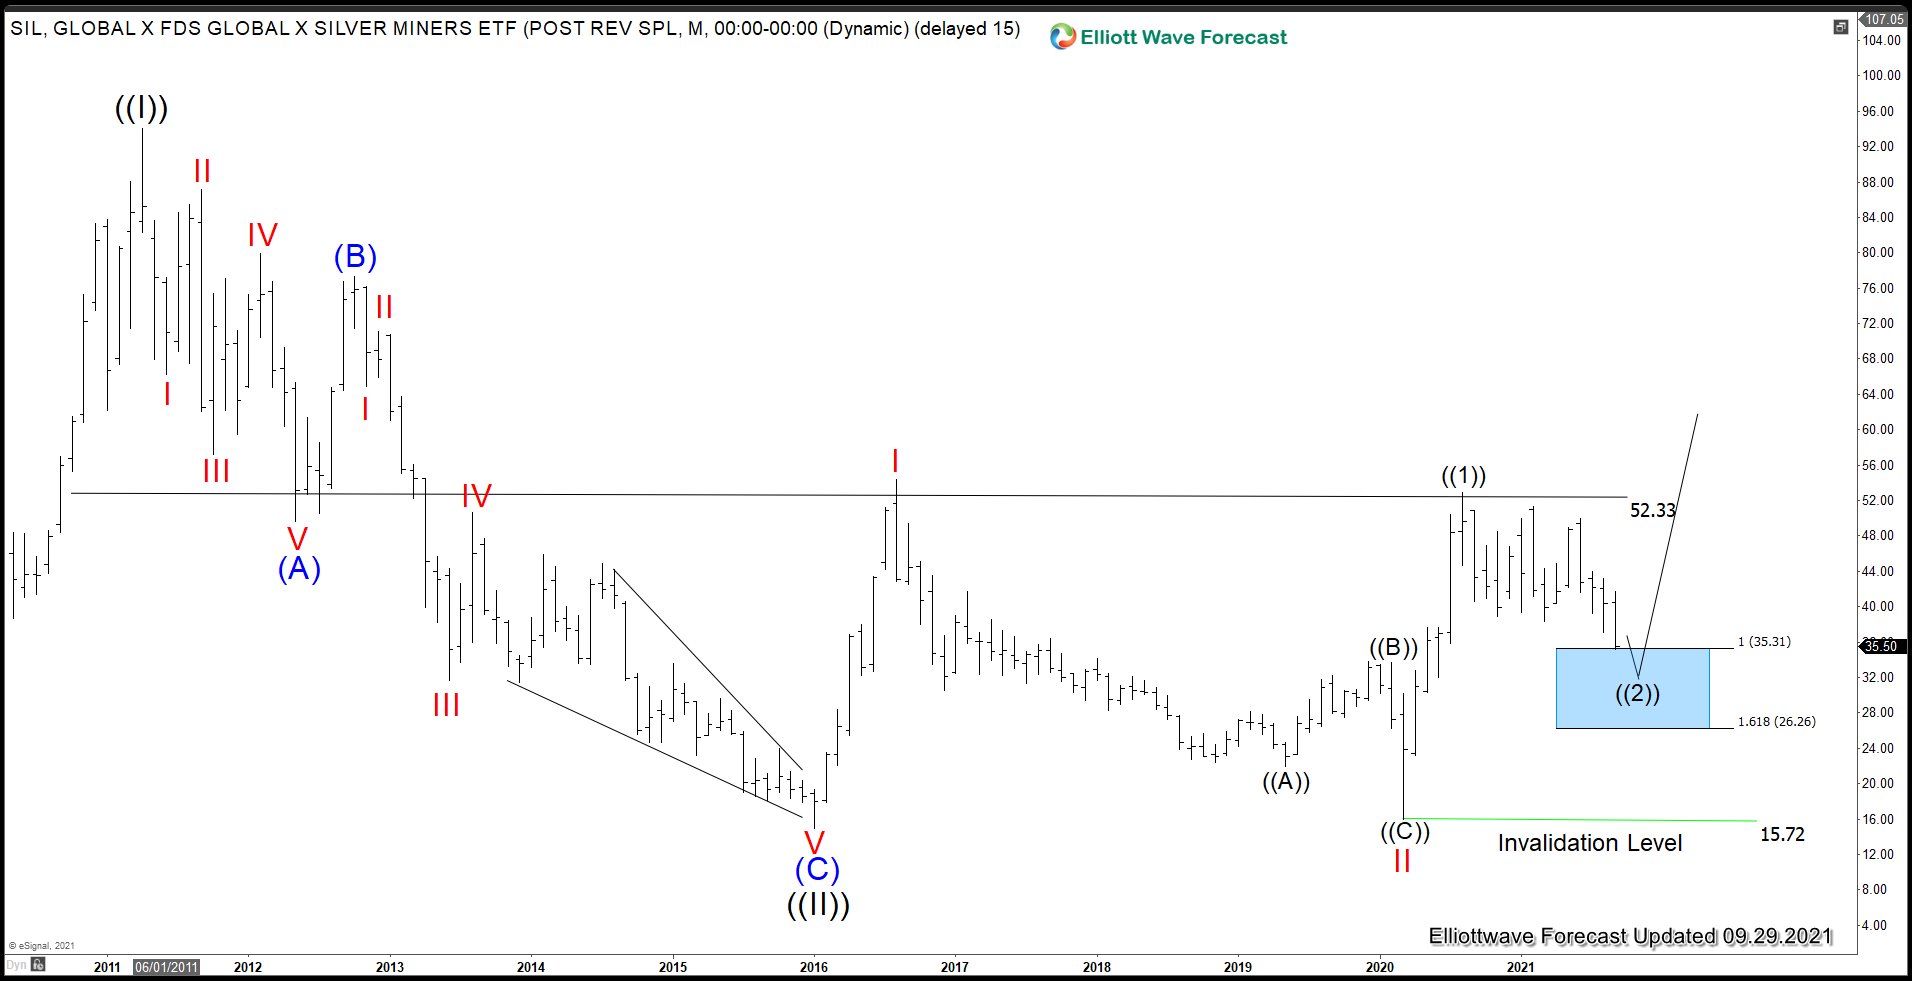
Silver Miners ETF (SIL) Has Reached Support Area
Read MoreSilver Miners ETF (SIL) has been consolidating since bottoming on January 2016 low at 14.94. Presently, it has reached 100% fibonacci extension from August 2020 peak at $26.2 – 35.3. This means the instrument can soon see support and rally in 3 waves at least if not resuming higher. Let’s take a look at the […]
-
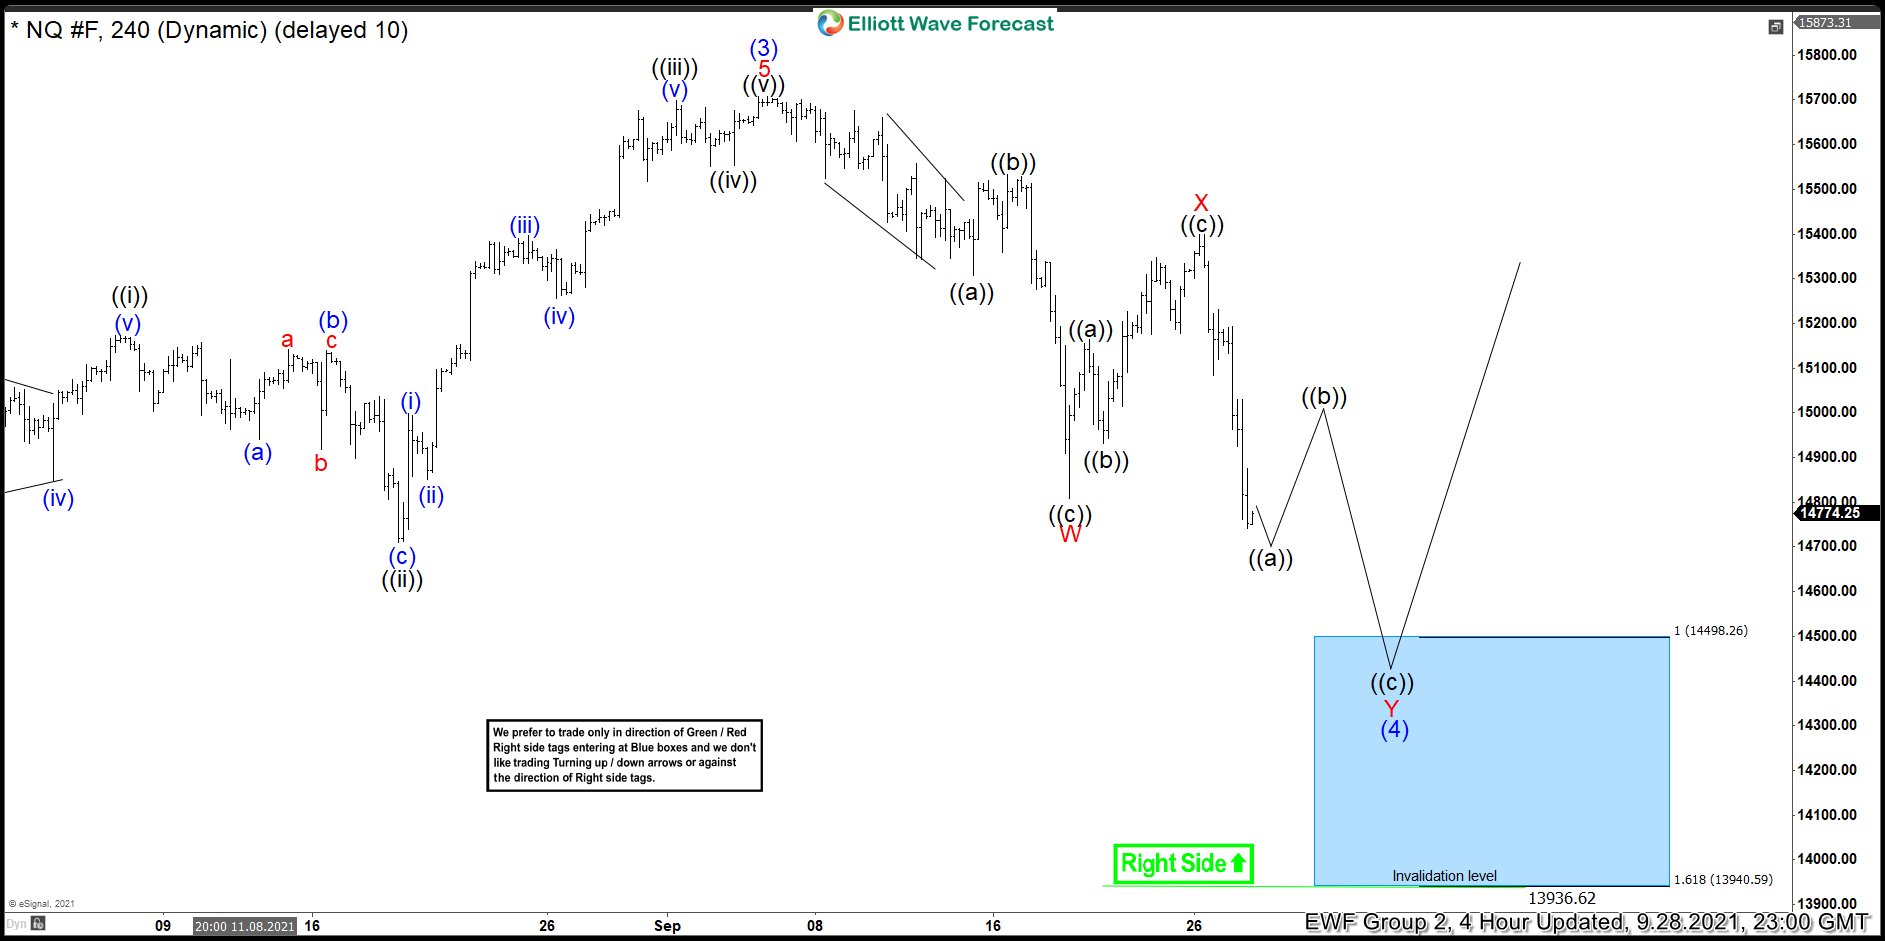
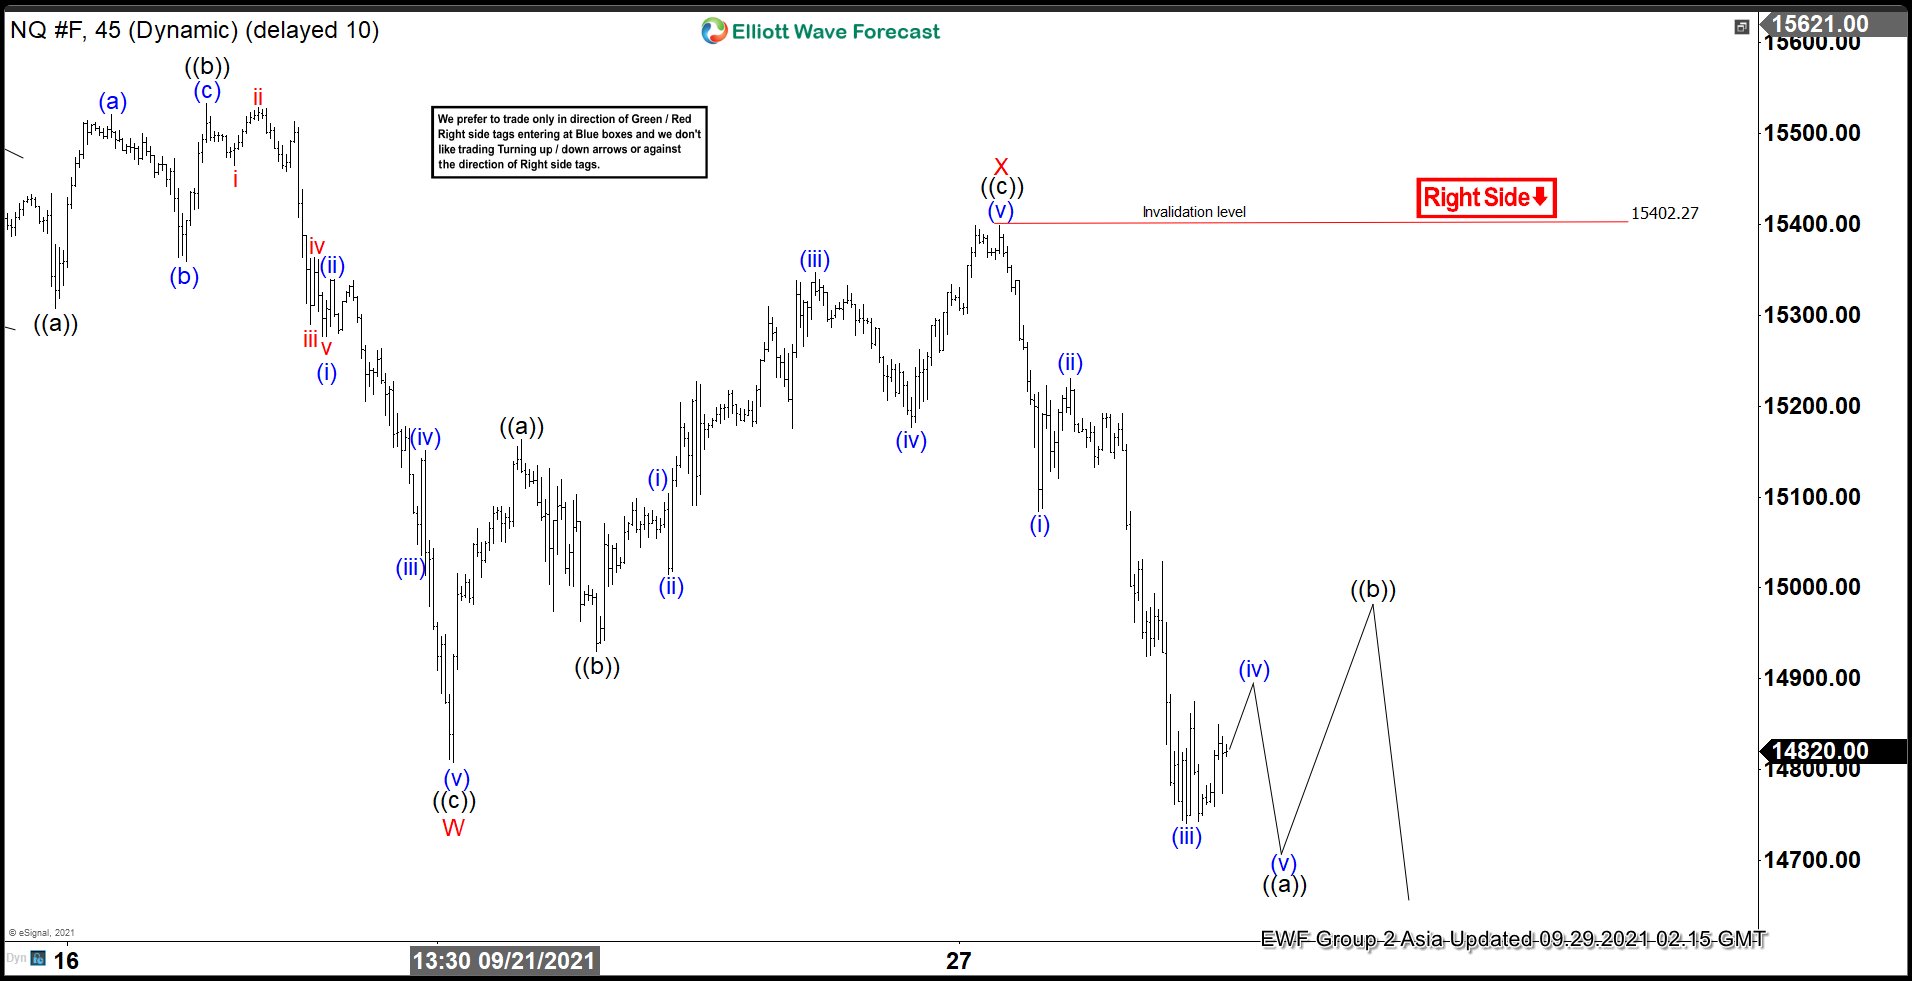
Nasdaq Futures: Forecasting the Decline and Next Blue Box Area
Read MoreNasdaq futures dropped from a peak of 15710.42 on September 6, 2021 to a low of 14711 on September 29, 2021 which is a drop of 997.75 points in just over 3 weeks and reflects a 6.36% drop. In this blog, we will look at how we forecasted the decline in Nasdaq Futures (NQ #F) based […]
-
Royal Gold ( RGLD) : The stock might show the path for Gold
Read MoreRoyal Gold is an ETF with a higher degree correlation with Gold and might show a path for an expected move higher in Gold into the $2700.00 area. The Symbol shows five swings or waves since the all-time lows, which is a bullish structure. In the Elliott wave Theory, every time five waves or swings […]
-
Elliott Wave View: Nasdaq (NQ_F) 5 Swing Bearish Sequence Favors More Downside
Read MoreNasdaq (NQ_F) shows 5 swing bearish sequence from September 6, 2021 high favoring more downside. This article and video look at the Elliott Wave path.