
The Power of 3-7-11 and the Grand Super Cycle: How We Saw the Bullish Turn in April 2025 Back on April 9, 2025, while World Indices were dropping sharply and global sentiment had turned overwhelmingly bearish, we published an article that challenged the fear-driven narrative. We explained why selling was not the right approach and […]
-

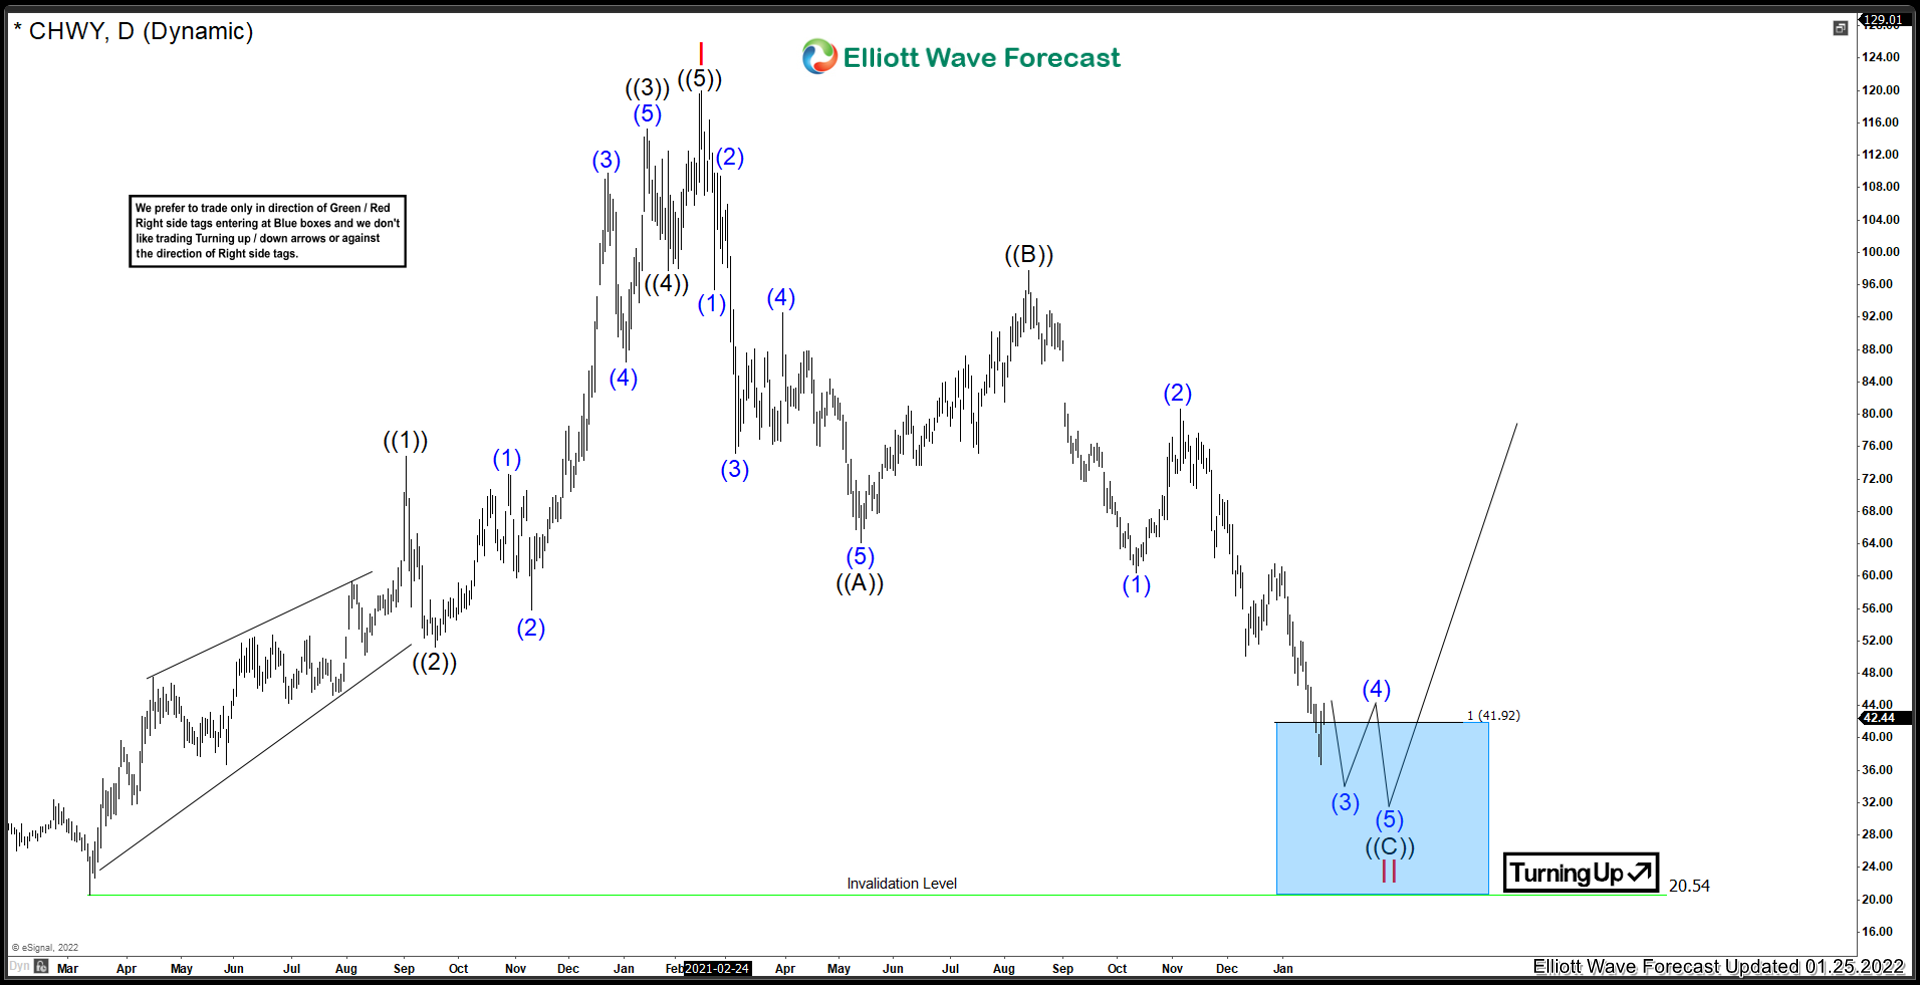
Chewy.com ($CHWY) Inside The Blue Box
Read MoreChewy.com is an e-commerce company that specializes in pet food. Along with many other stocks, prices started a new cycle higher in March 2020. Chewy is now correcting that cycle. Lets take a look at the company profile and see what they do: “Chewy, Inc. is an American online retailer of pet food and other pet-related products based […]
-

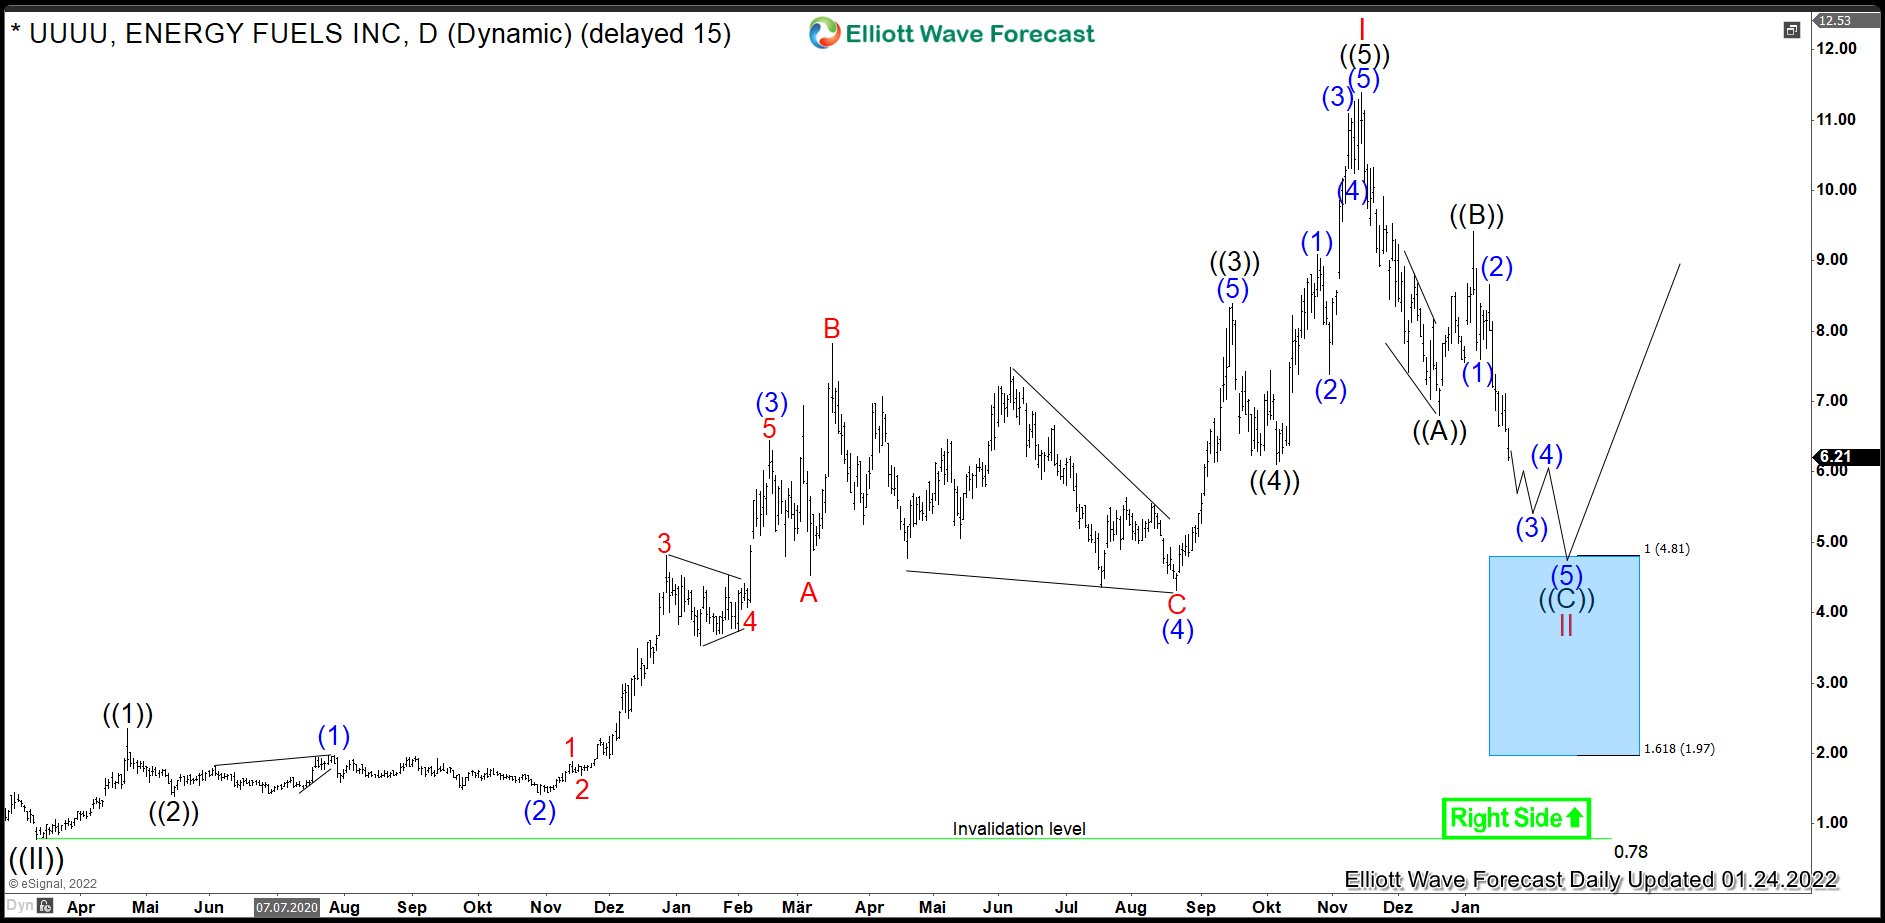
$UUUU : Uranium Producer Energy Fuels Provides an Opportunity
Read MoreEnergy Fuels is the largest US miner of the uranium. It produces the uranium both in form of triuranium octoxide and uranium hexafluoride. Besides the core business, the secondary products of Energy Fuels are rare earth elements and vanadium. Founded in 2006, the company has its headquarters in Lakewood, Colorado. One can trade it under […]
-

Top Buzzing Stocks for 2024
Read MoreEvery investor nowadays is asking himself/herself the same question repeatedly, “What’s going to happen in 2024”. For investors, this is a vital query as lots of money is involved. Before making investment decisions, investors like me seek valuable insight on which sectors and/or which stocks will be giving high returns. Let’s have a broad look […]
-

Top Robotics Stocks to Buy in 2024
Read MoreThe breakthrough of technology has led to an increase in automated processes in every organization. Companies have also shifted their production to automated processes. Spending on robotics and drones is expected to reach $128.7 billion in 2020. Robotic spending alone is expected to reach $112.4 billion, as per IDC. This offers an exciting investment opportunity […]
-

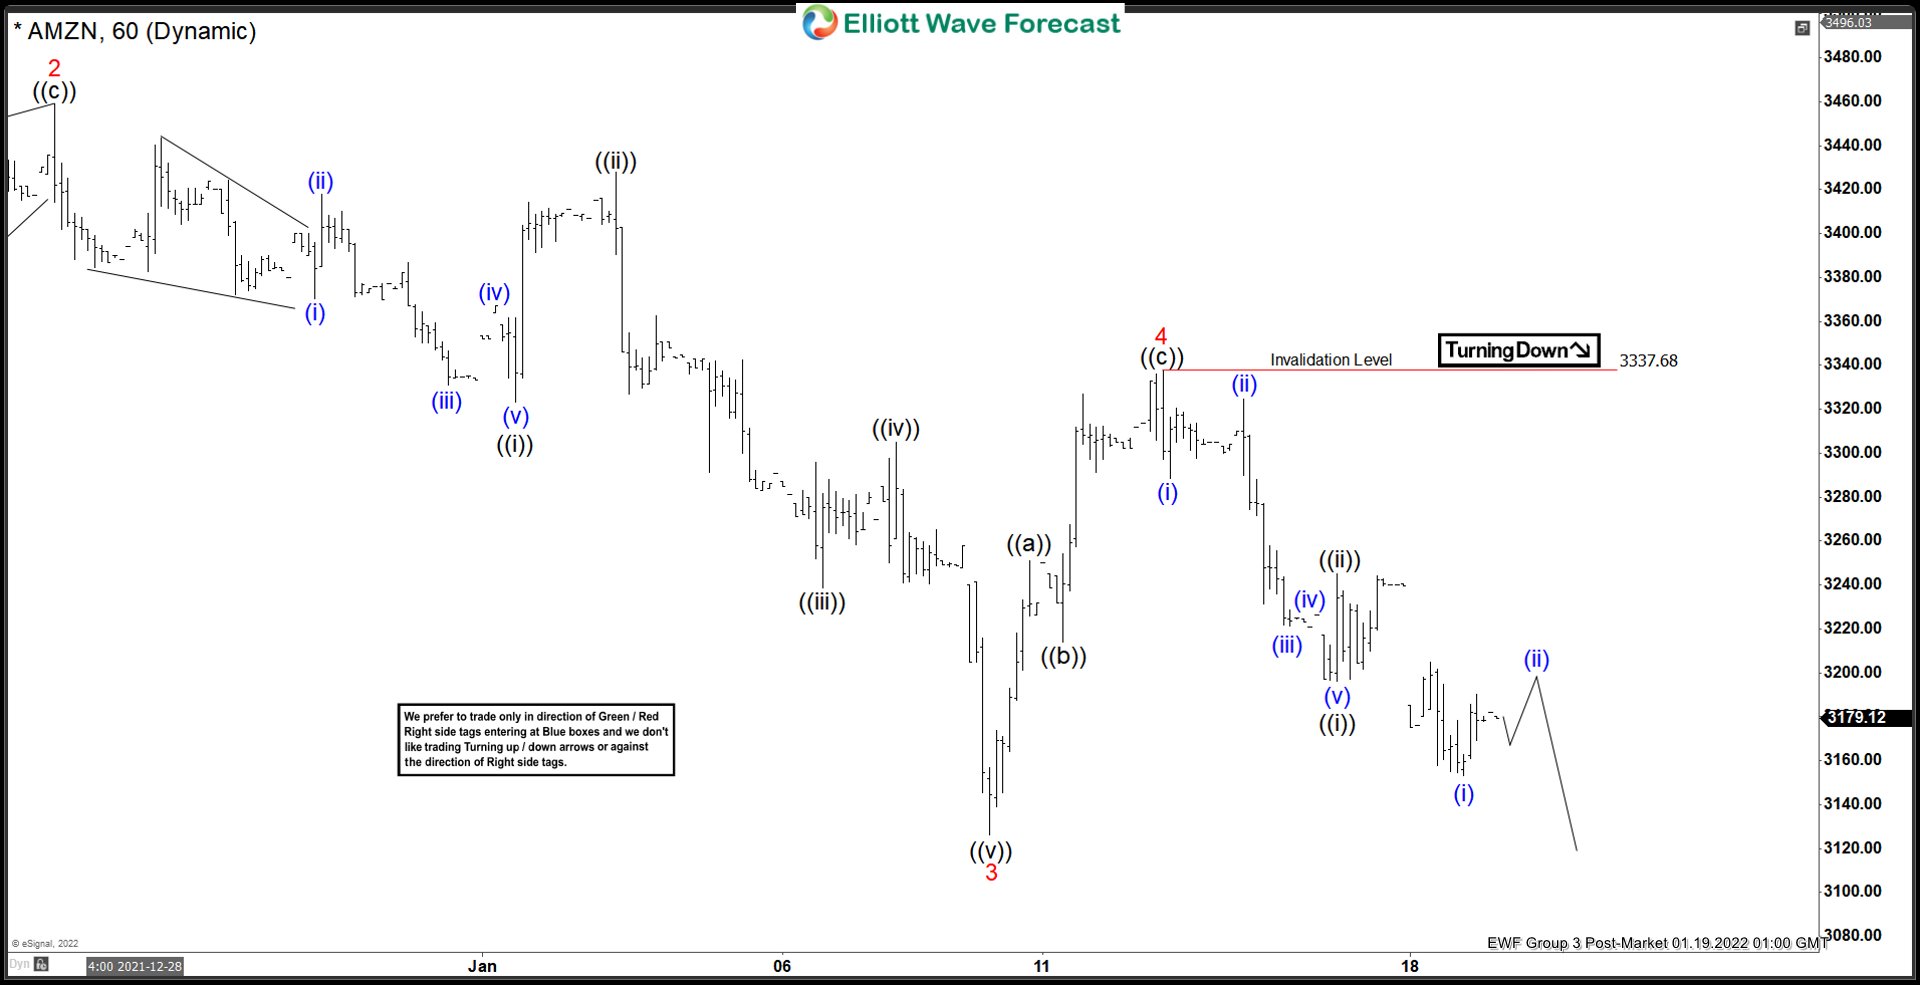
Elliott Wave View: Amazon (AMZN) Should See Further Downside
Read MoreAmazon (AMZN) cycle from November 19, 2021 is in progress as an impulse looking lower. This article and video look at the Elliott Wave path.
-

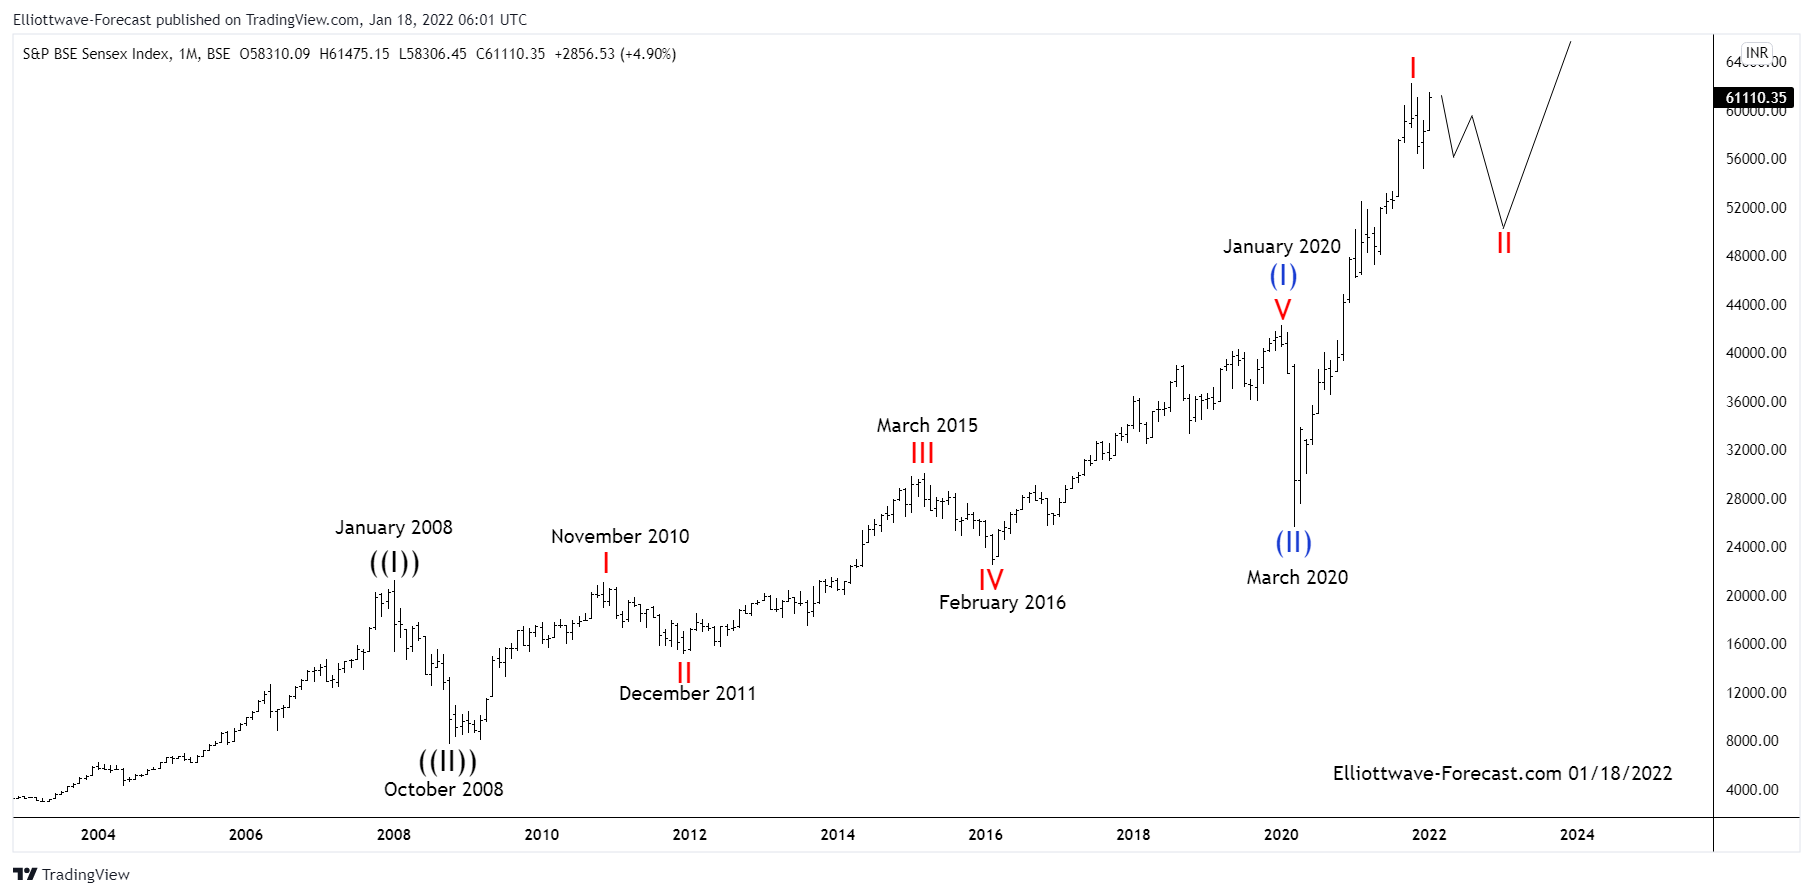
S&P BSE Sensex Index Long Term Bullish Cycles & Elliott Wave
Read MoreS&P BSE Sensex Index Long Term Bullish Cycles & Elliott Wave The Sensex Index has been trending higher with other world indices. Firstly in it’s base year 1978 to 1979 the index’s point value was set at 100. From there it rallied with other world indices trending higher into the January 2008 highs. It then corrected […]