

The Power of 3-7-11 and the Grand Super Cycle: How We Saw the Bullish Turn in April 2025 Back on April 9, 2025, while World Indices were dropping sharply and global sentiment had turned overwhelmingly bearish, we published an article that challenged the fear-driven narrative. We explained why selling was not the right approach and […]
-
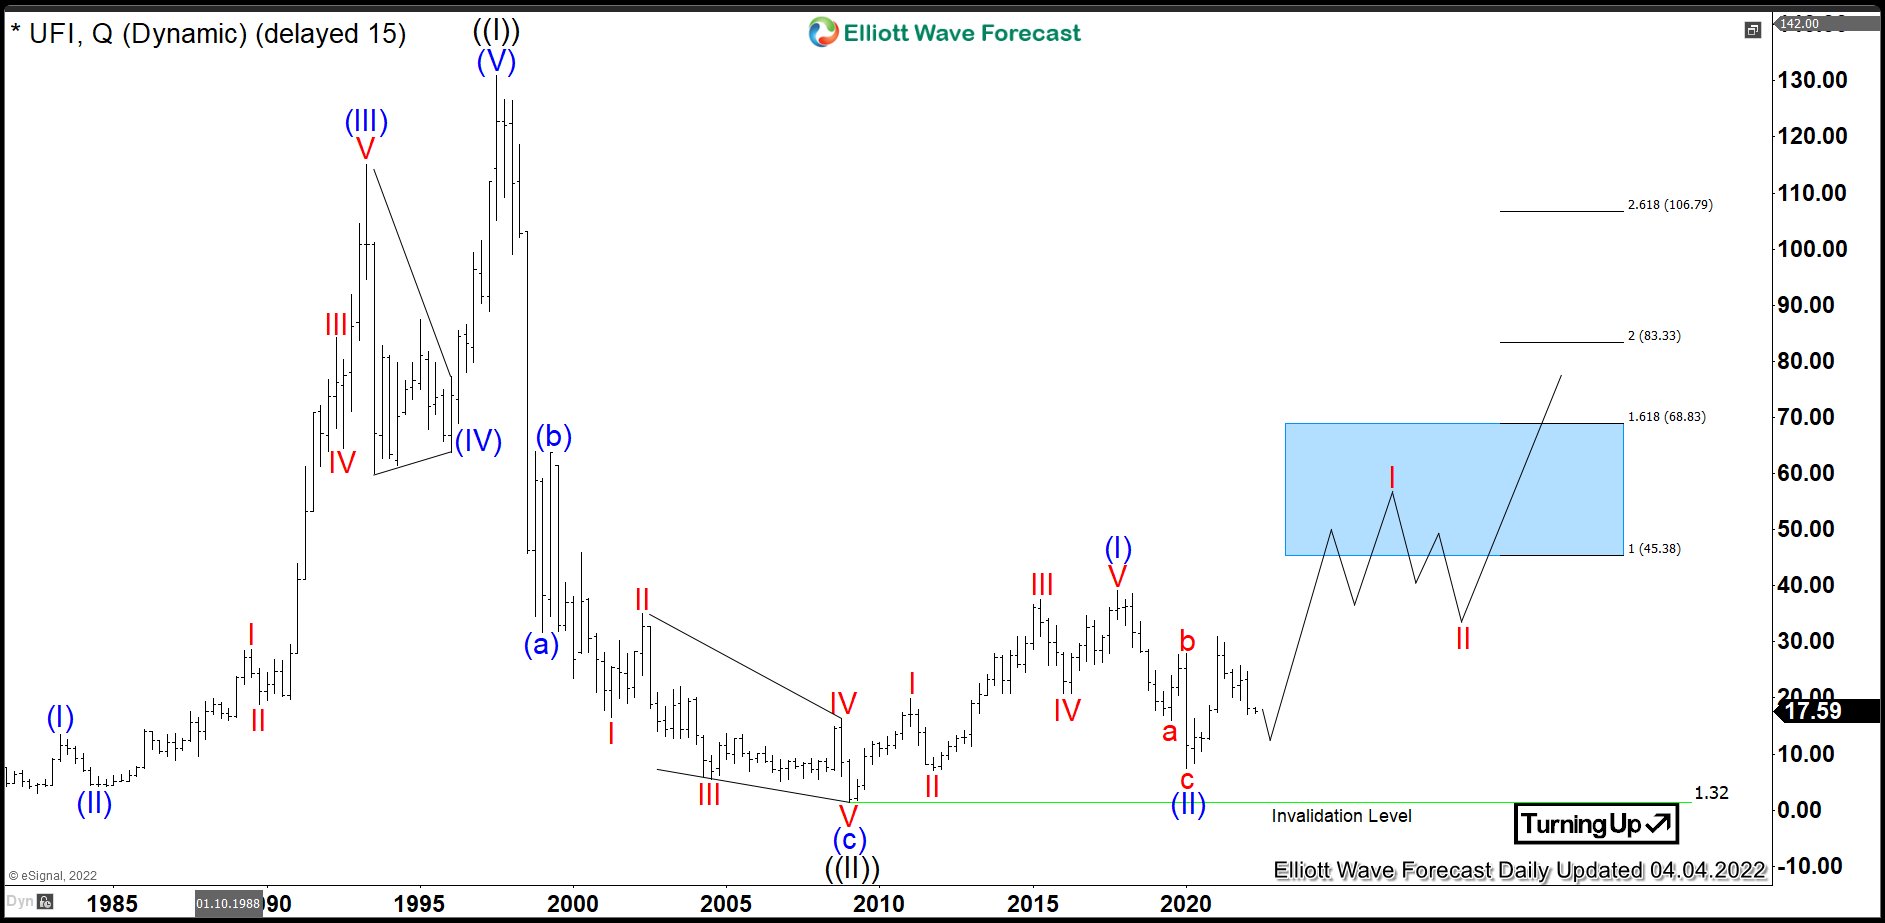
$UFI: Textile Stock Unifi to Accelerate Higher from Buying Area
Read MoreUnifi Inc. is a global textile solutions provider based in Greensboro, North Carolina, USA. The stock being a component of the Russel3000 index can be traded under ticker $UFI at NYSE. Unifi is one of the world’s leading innovators in manufacturing synthetic and recycled performance fibers. The company is in a possession of proprietary technologies and […]
-
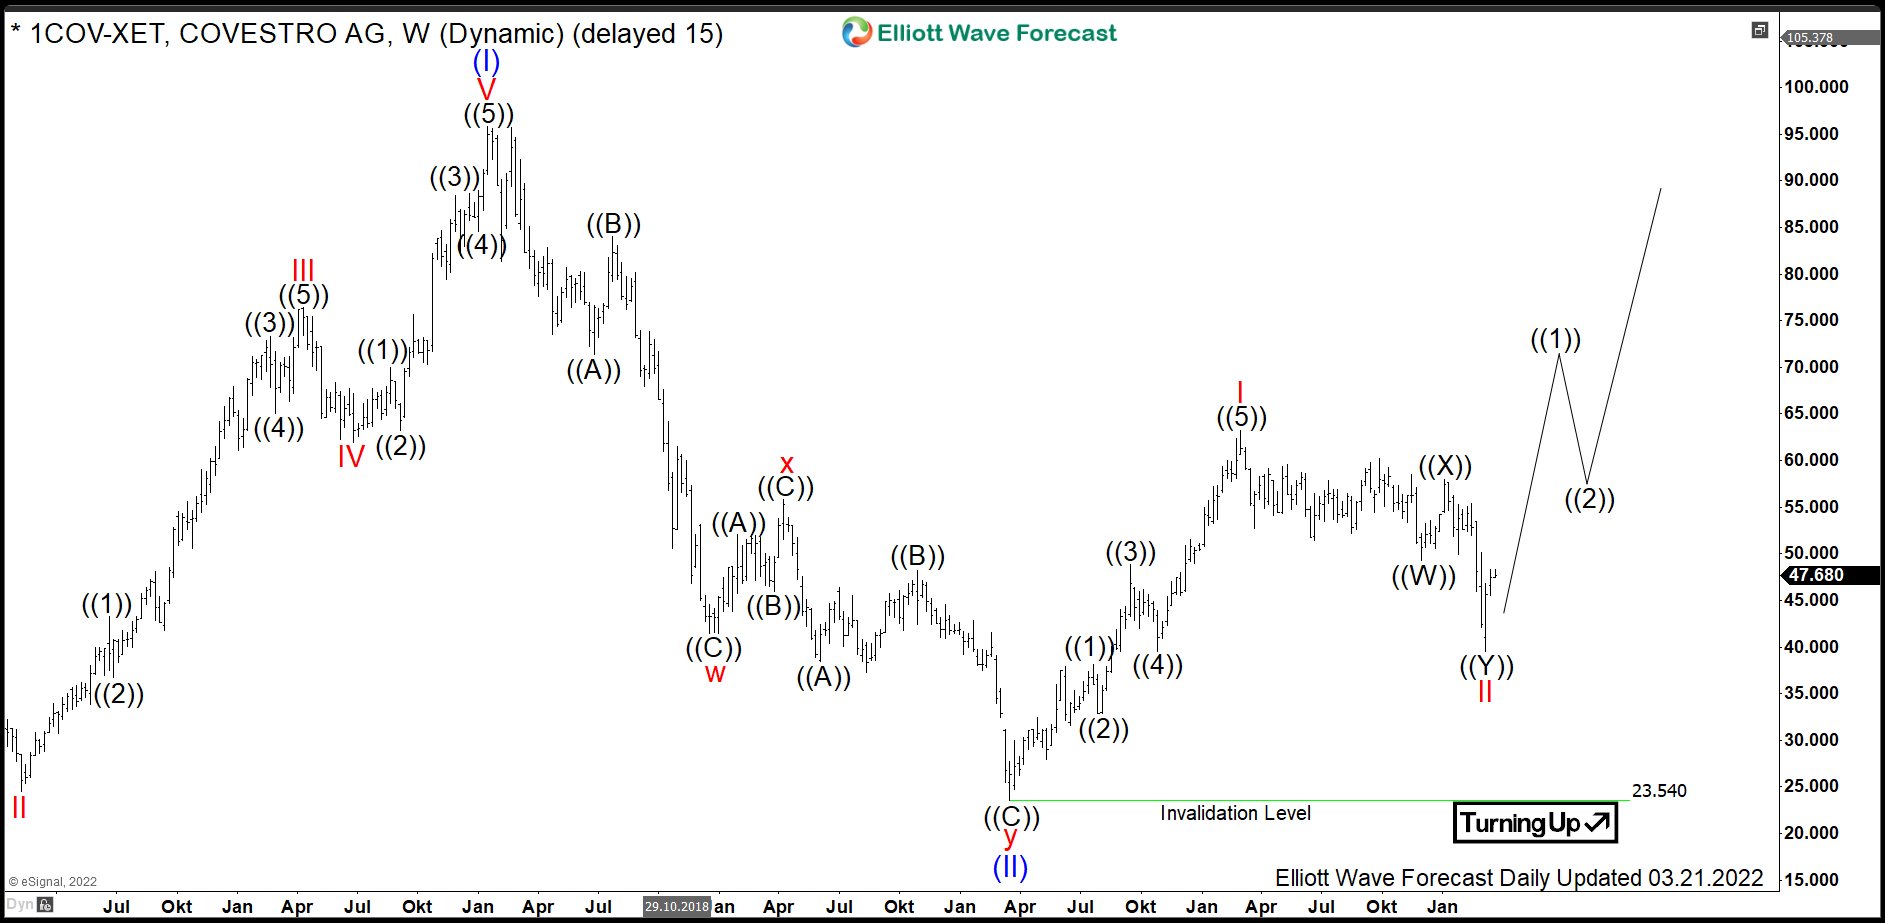
$1COV: Buying Material Science Stock Covestro in Pullback
Read MoreCovestro AG (formerly, Bayer MaterialScience) is a German company which produces a variety of polycarbonate and polyurethane based raw materials. The products include coatings and adhesives, polyurethanes for thermal insulation and electrical housings, polycarbonate based highly impact-resistant plastics (Makrolon) and more. Formed in 2015 as a spin off from Bayer, Covestro is headquartered in Leverkusen, […]
-

Best Performing Stocks in 2024
Read MoreThe stock market opened in 2024 amongst huge uncertainties and shaky ground. Rising inflation led to a record high inflation rate. Moreover, the political tension between Russia and Ukraine had an effect on the stock market. But amidst all this chaos, there are a handful of companies that have managed to grow ahead of the […]
-
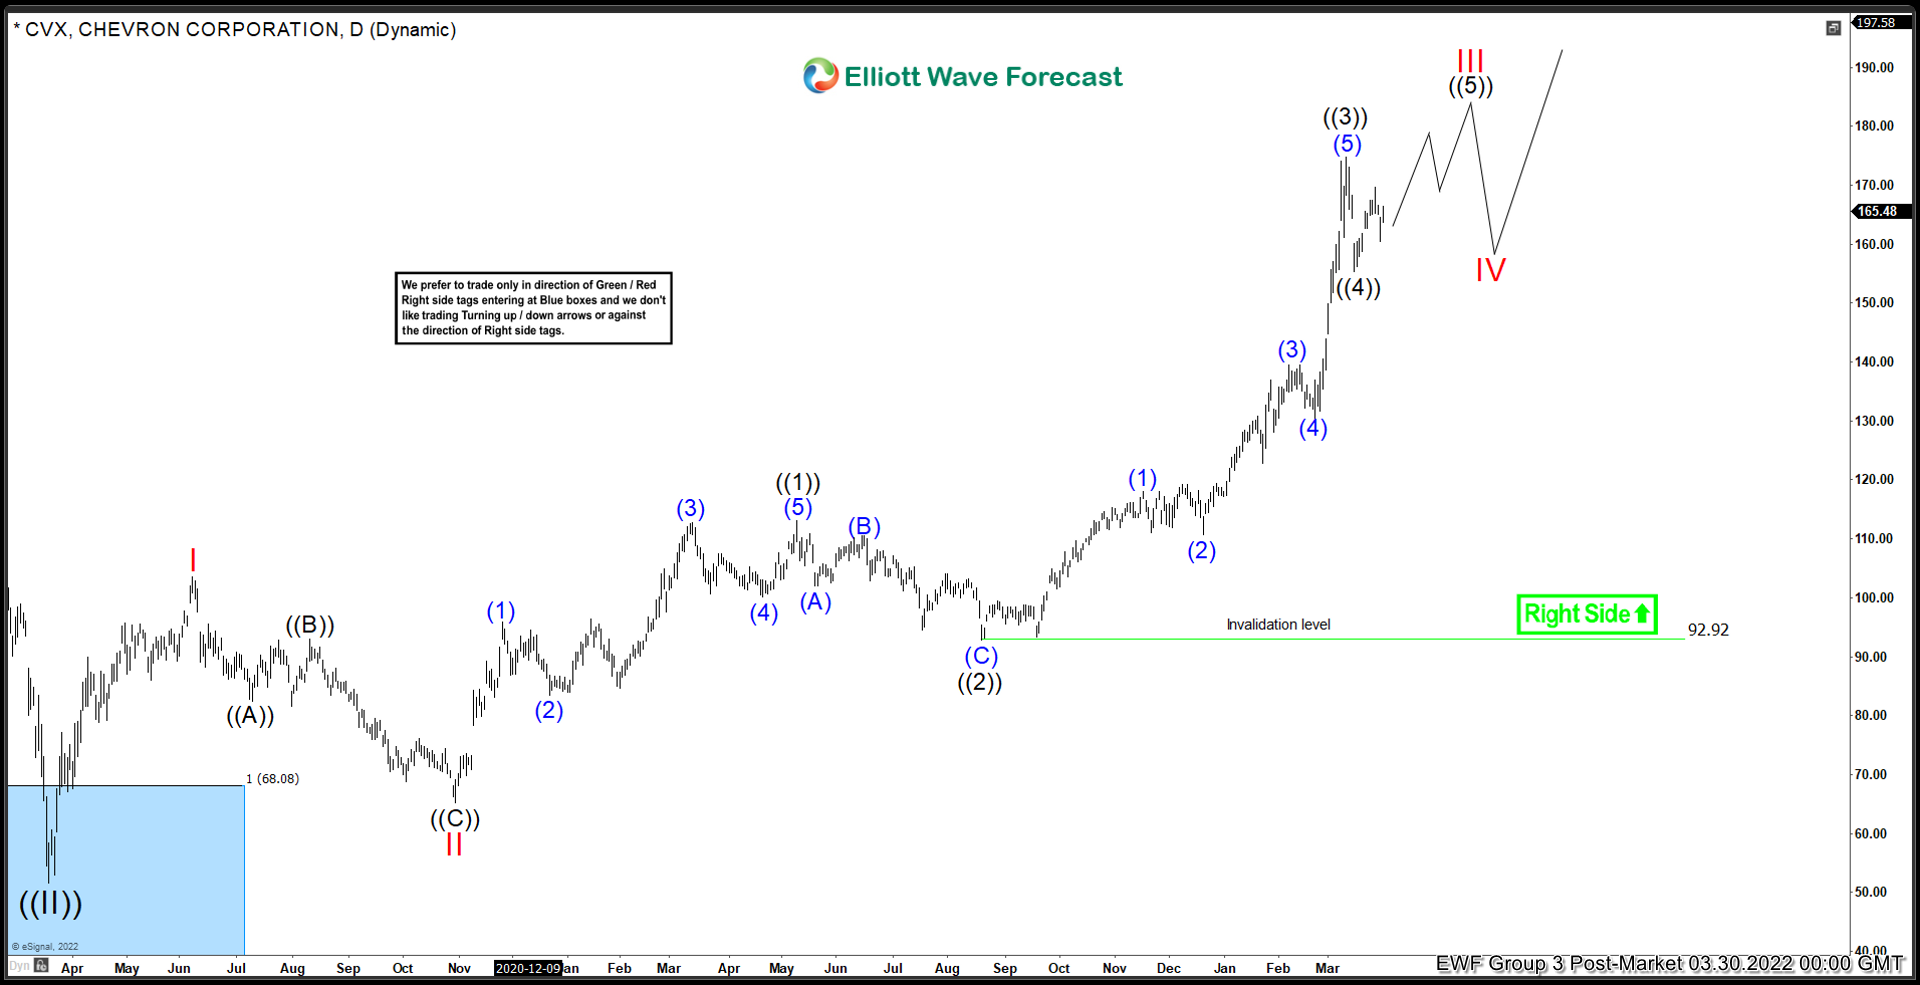
Chevron Corp ($CVX) Continues to Move Higher
Read MoreThe last time I covered Chevron was back in November 2021. And I was expecting a larger cycle to complete before pulling back against March 2020 low. Lets take a look at the view I was presenting back then and compare to what the market gave us. Chevron Elliottwave View November 2021: At the time, […]
-
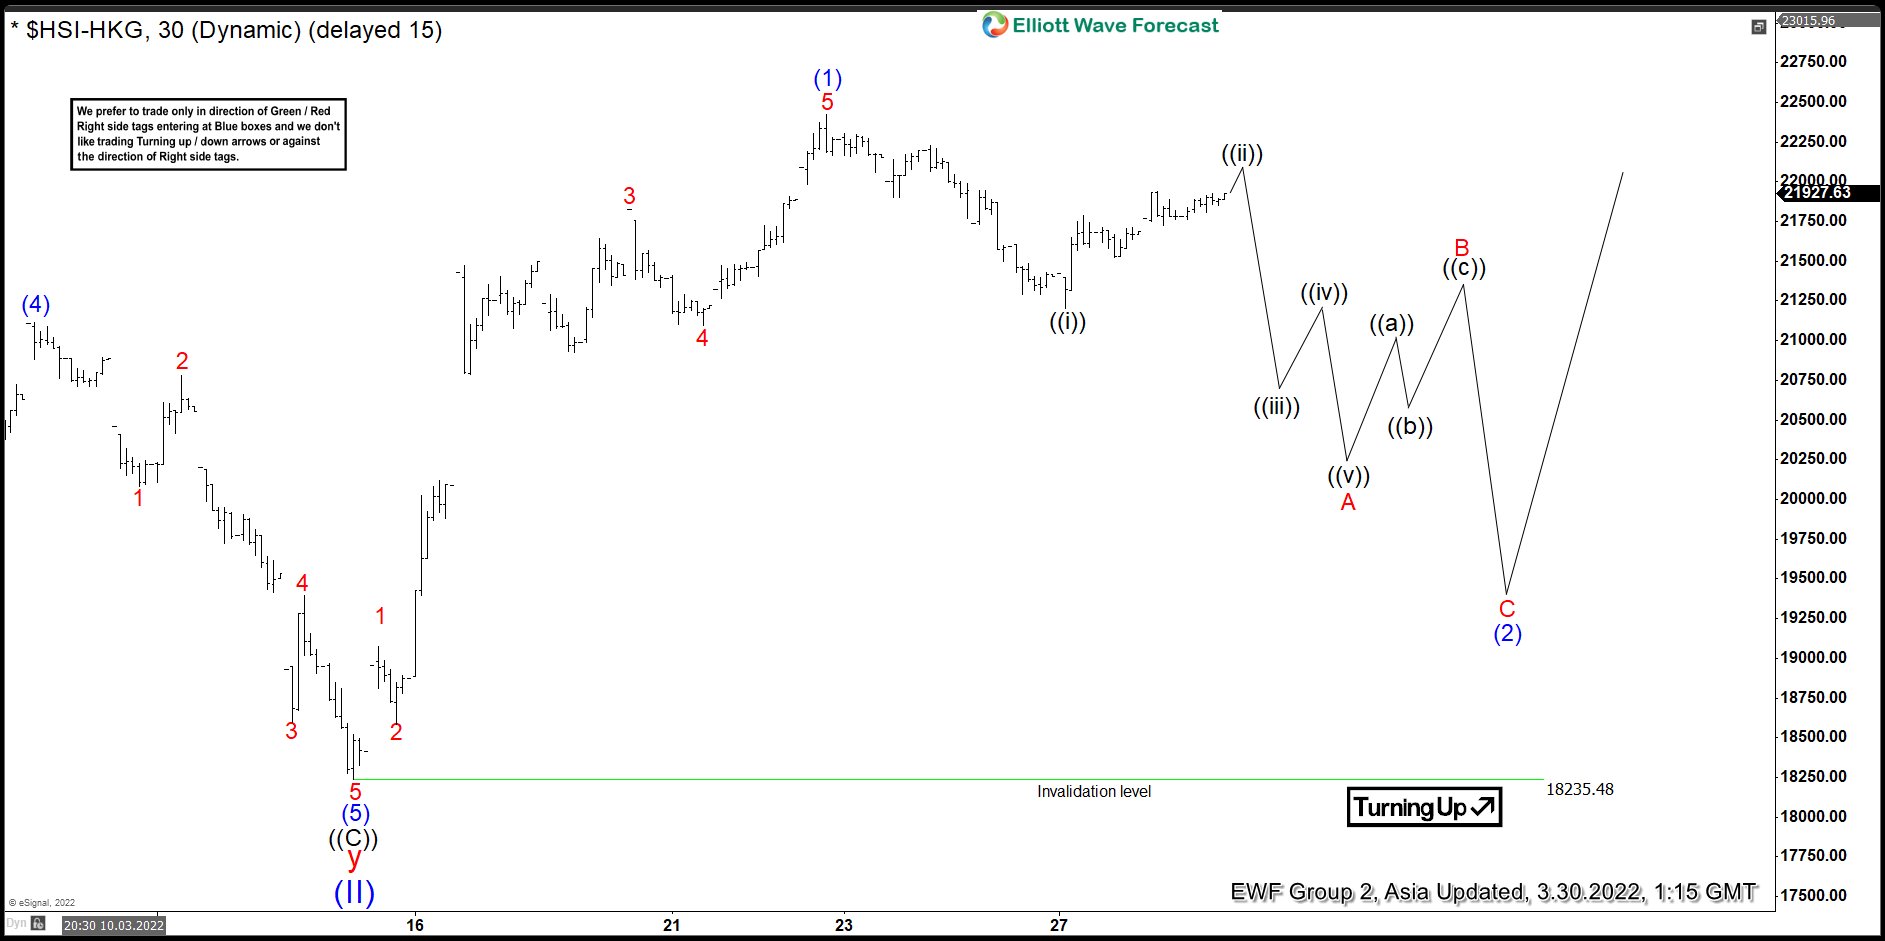
Elliott Wave View: Hangseng Index Pullback Should Find Support
Read MoreHangseng Index rallies as a 5 waves impulse from March 15, 2022 low. While dips stay above there, expect the Index to extend higher.
-
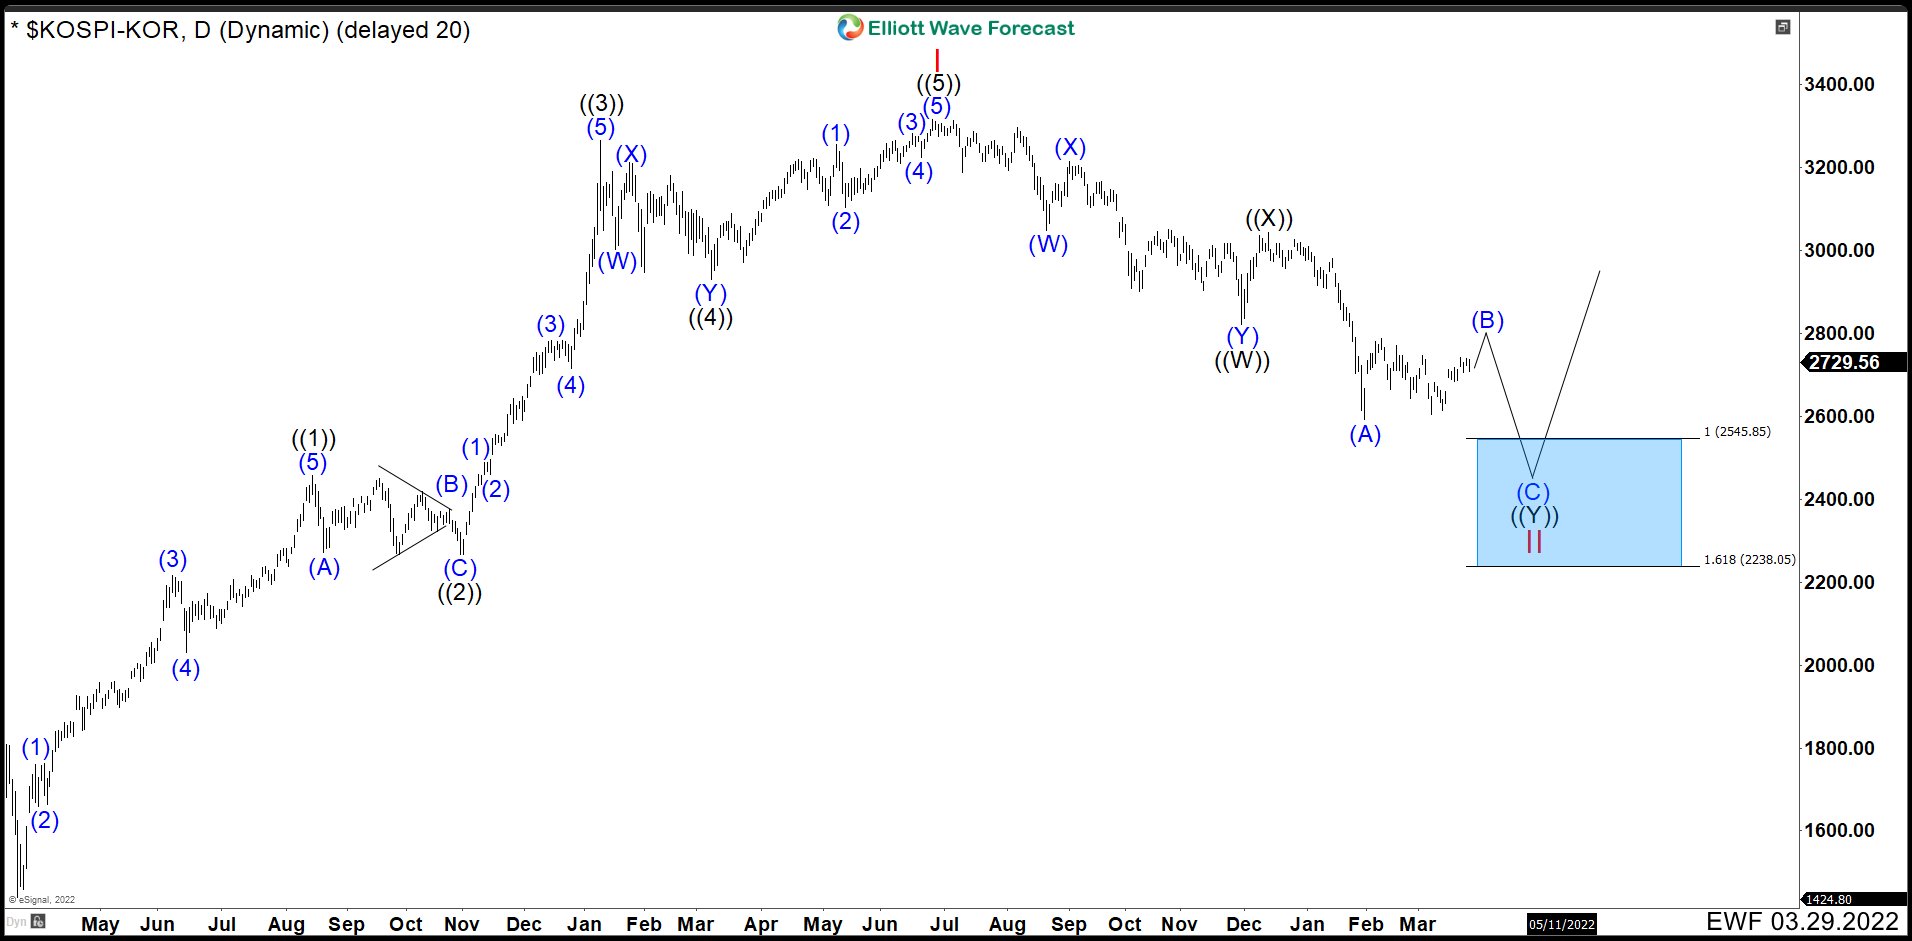
South Korean Stock Index (KOSPI) Is Near To Find Support
Read MoreThe Korea Composite Stock Price Index (KOSPI) is the index of all common stocks traded on the Korea Exchange. It is the representative stock market index of South Korea, like the S&P 500 in the United States. KOSPI Daily Chart March 2022 Since March 2020 low, KOSPI began to develop and impulse structure as we can see in the chart. Wave ((1)) ended at […]