

The Power of 3-7-11 and the Grand Super Cycle: How We Saw the Bullish Turn in April 2025 Back on April 9, 2025, while World Indices were dropping sharply and global sentiment had turned overwhelmingly bearish, we published an article that challenged the fear-driven narrative. We explained why selling was not the right approach and […]
-
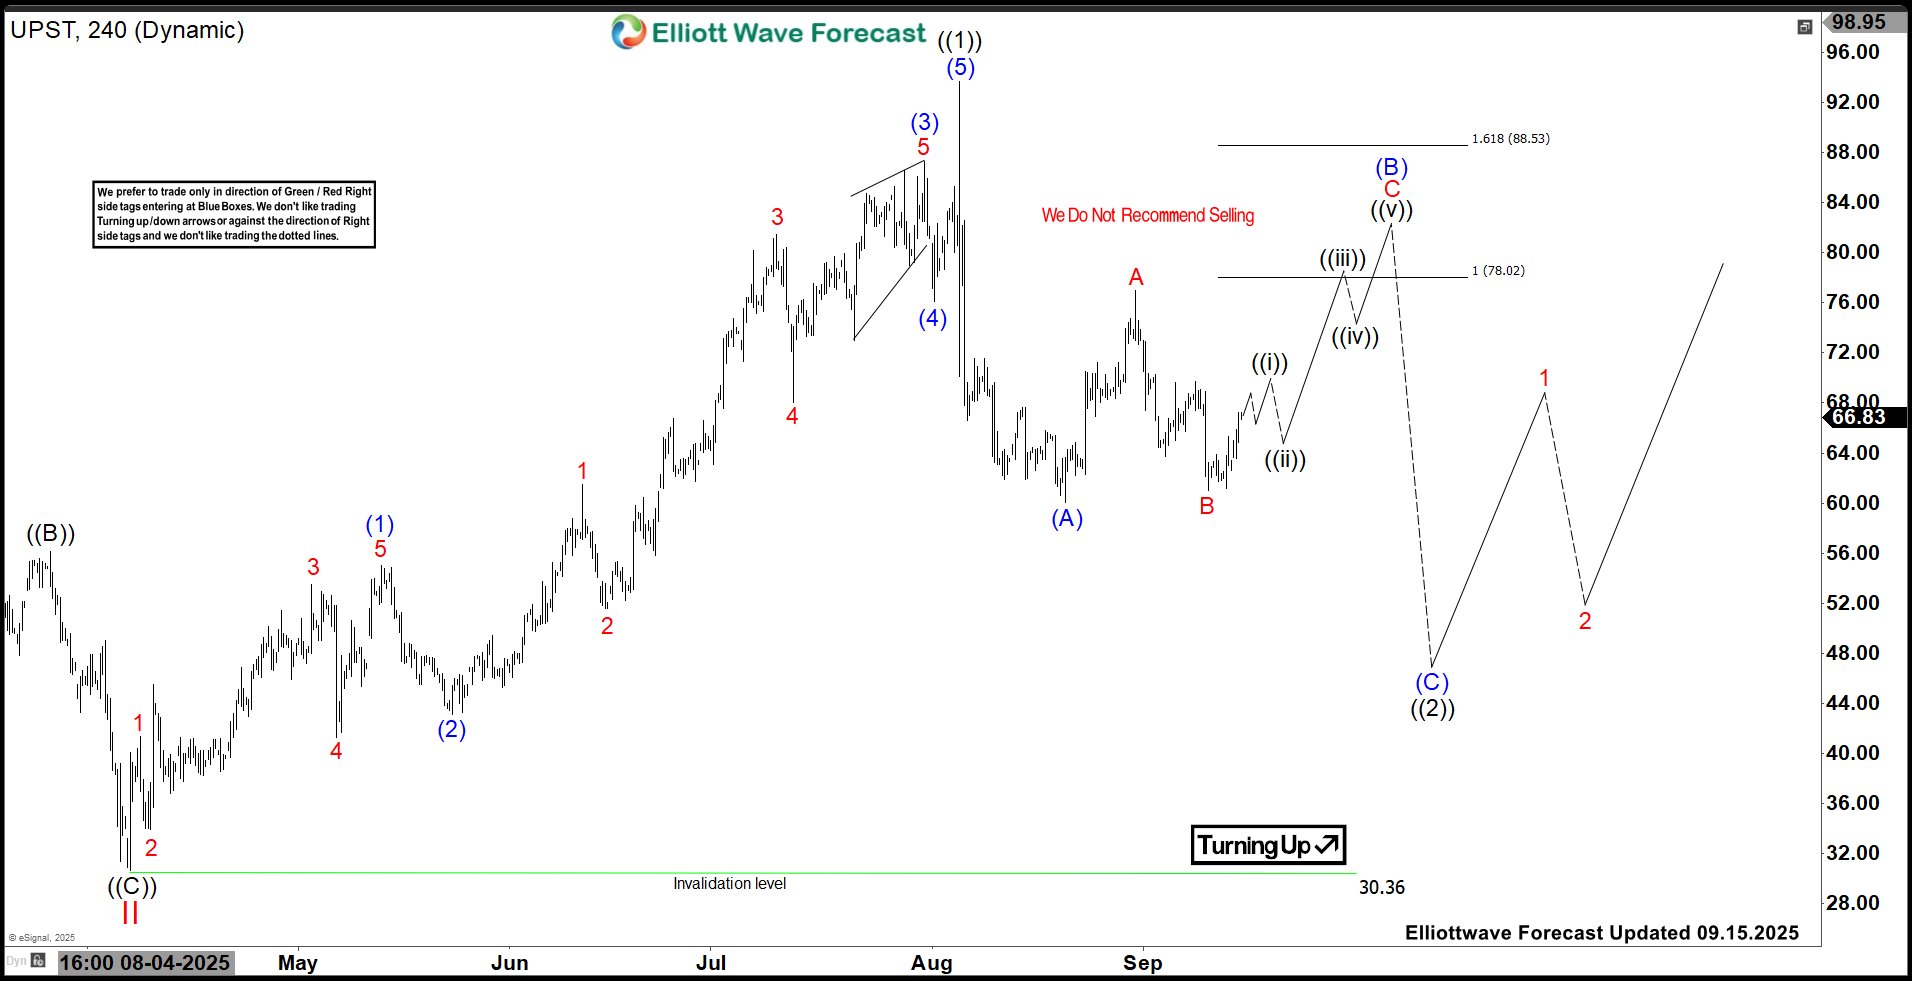
UPST Favors ((2)) Pullback – Bullish Structure Remains Intact
Read MoreUpstart Holdings, Inc., (UPST) operates a cloud-based artificial intelligence (AI) lending platform in the United States. The company operates through three segments: Personal lending, Auto lending & others. It comes under Financial services sector and trades as “UPST” ticker at Nasdaq. As expected in last article, UPST ended ((1)) impulse from April-2025 low at $93.67 […]
-
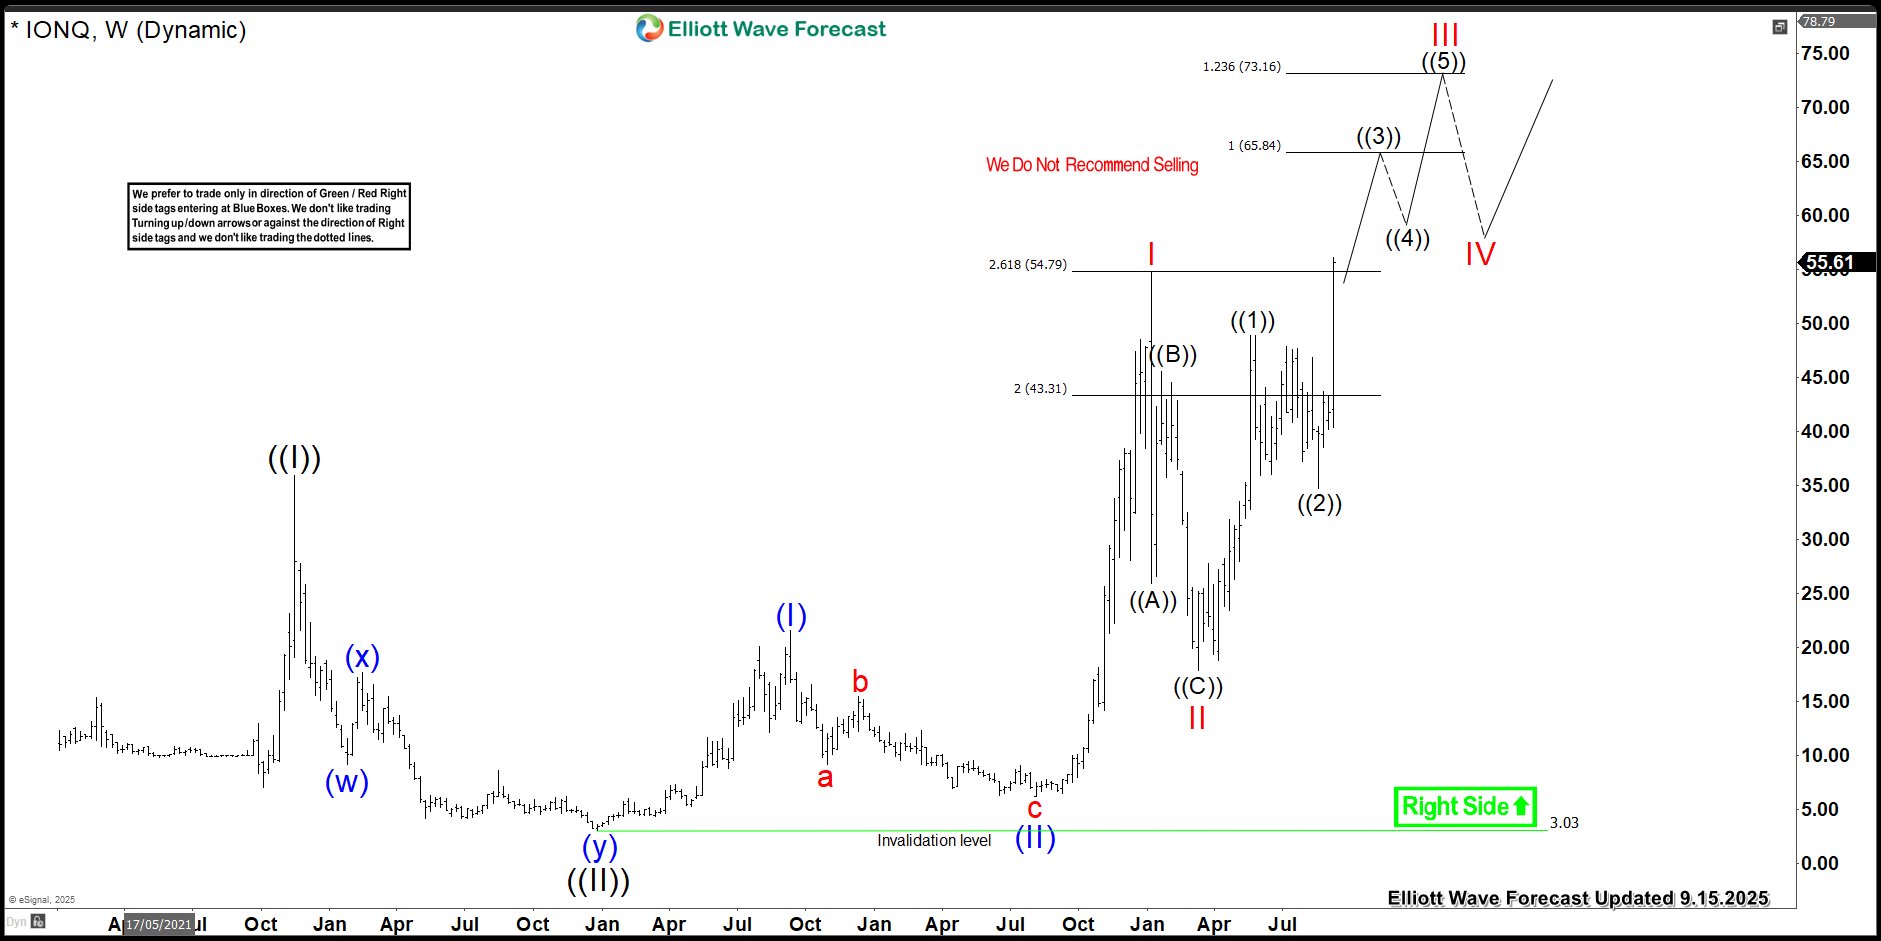
IONQ Stock Analysis: Resuming the Uptrend After a Brief Correction
Read MoreIONQ Inc., a trailblazer in quantum computing, specializes in developing and manufacturing quantum computers. Founded in 2015 by Christopher Monroe and Jung Sang Kim, the company is based in College Park, Maryland. This technical analysis of IONQ’s weekly stock chart reveals key insights: After a 3-wave pullback, the stock surged to new all-time highs. This […]
-

Robinhood (NASDAQ: HOOD) Enters Wave (III) Final Stage
Read MoreRobinhood (NASDAQ: HOOD) rallied more than 300% since April 2025 breaking into new all time highs. In our previous article, we explained the bullish sequence taking place within the weekly cycle leading to this strong surge. In today’s article, we explore the Elliott Wave structure, outlining potential paths and targets for its continued bullish momentum. Elliott Wave Analysis Robinhood […]
-
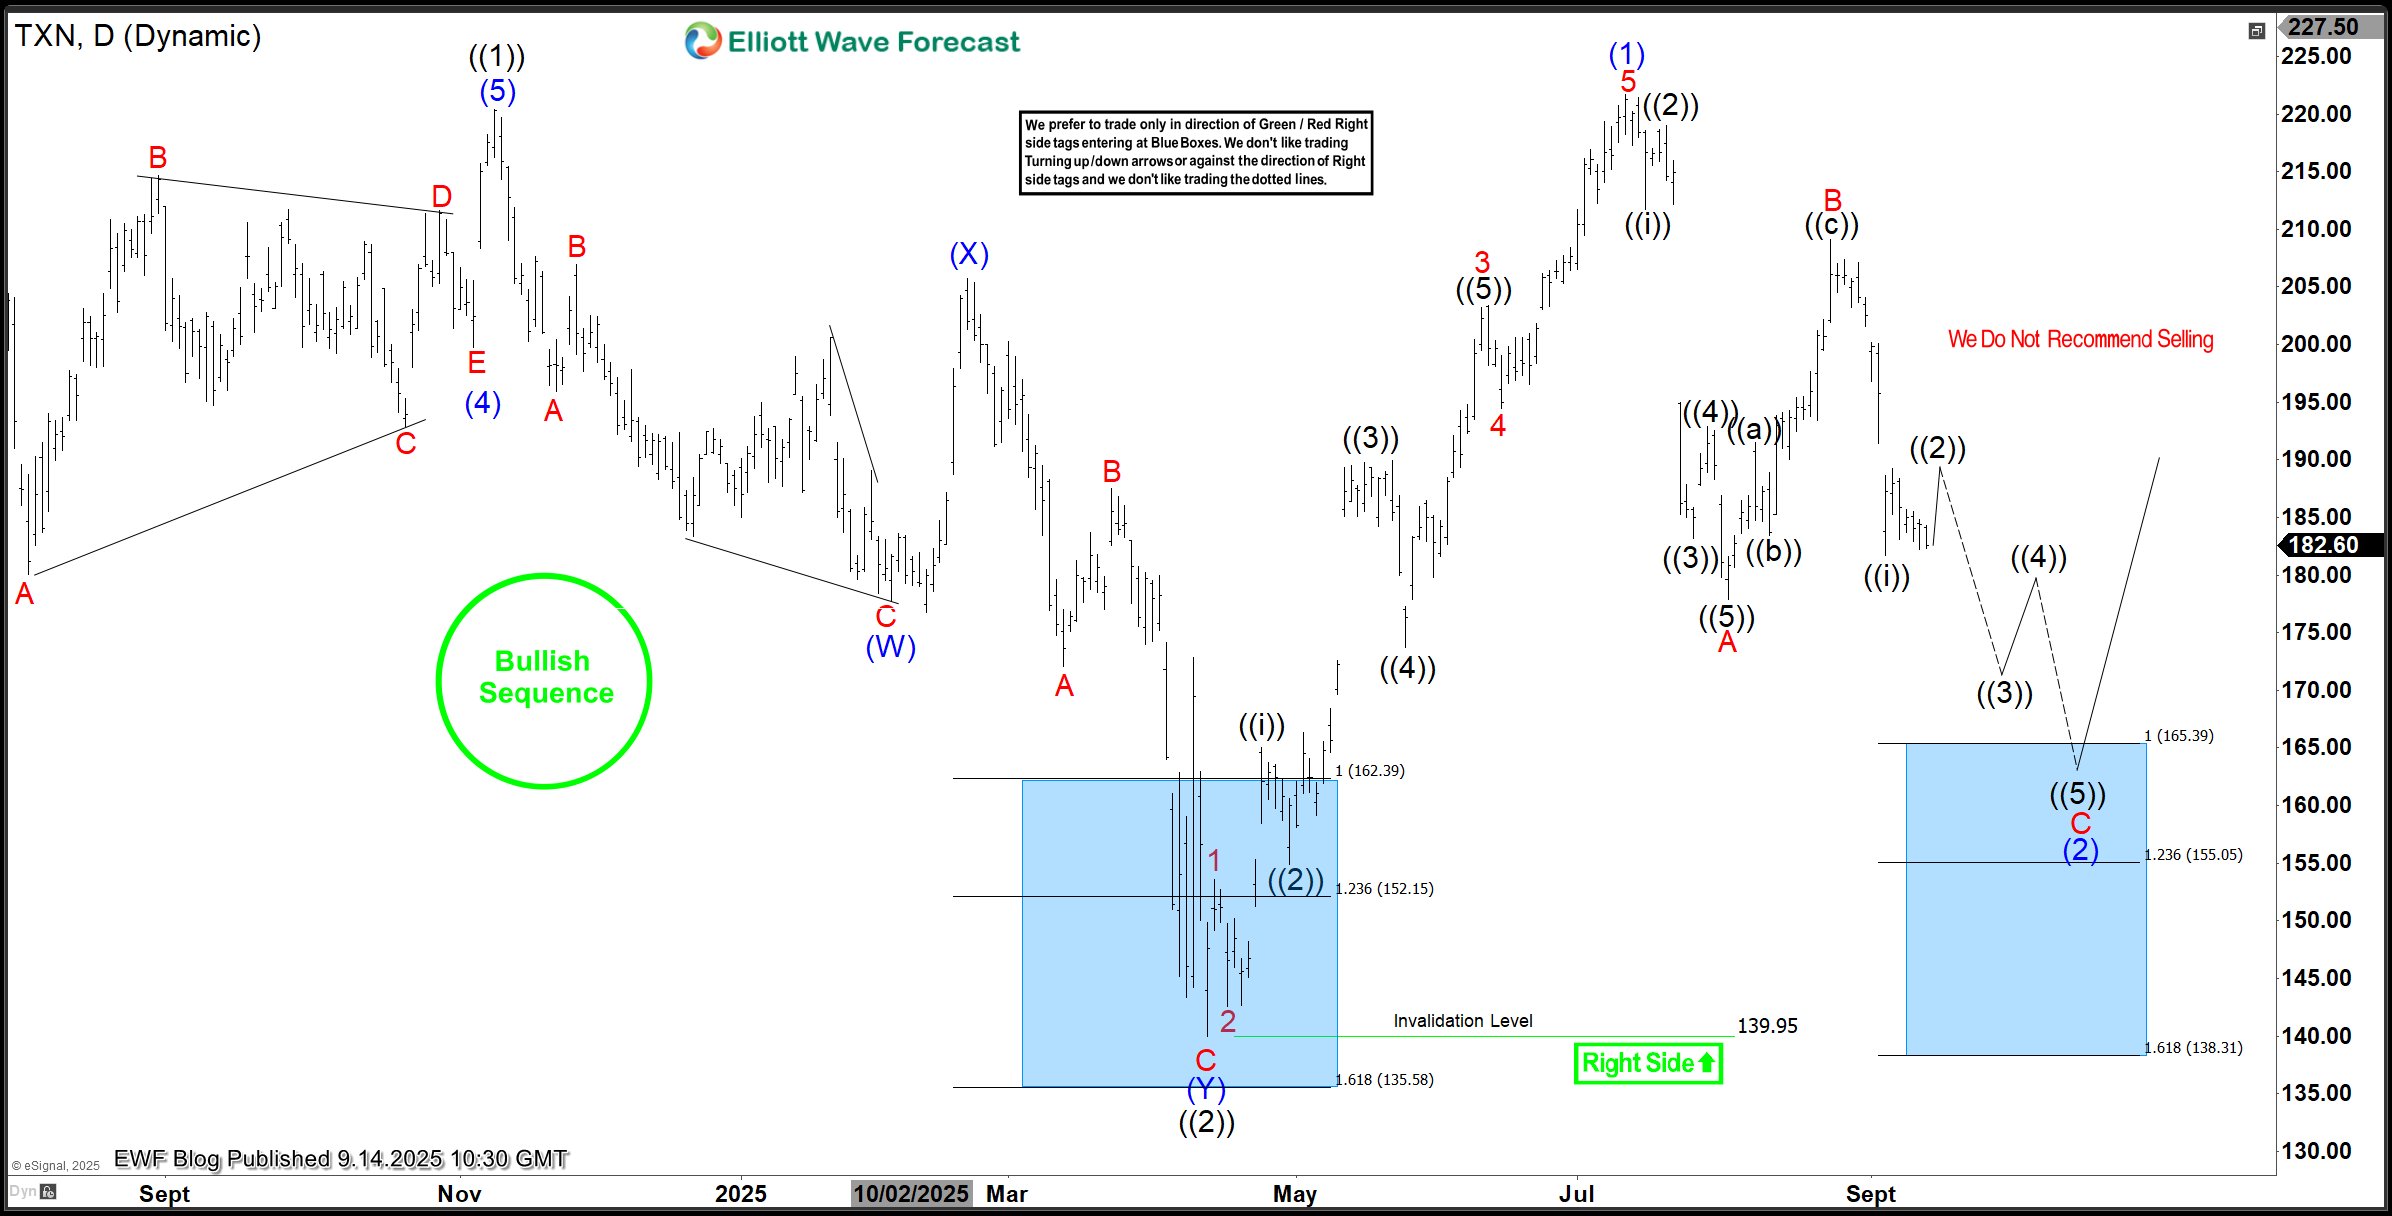
TXN Elliott Wave View: Dip Approaches Blue Box Buying Zone
Read MoreAfter it completed a 55% rally from April 2025 to July 2025, TXN is correcting the impulse rally. At the extreme of the current pullback, buyers can find new entry. What’s the buying zone? Check the rest of the post and be sure to read everything. Texas Instruments (TXN) is a global semiconductor company known for […]
-
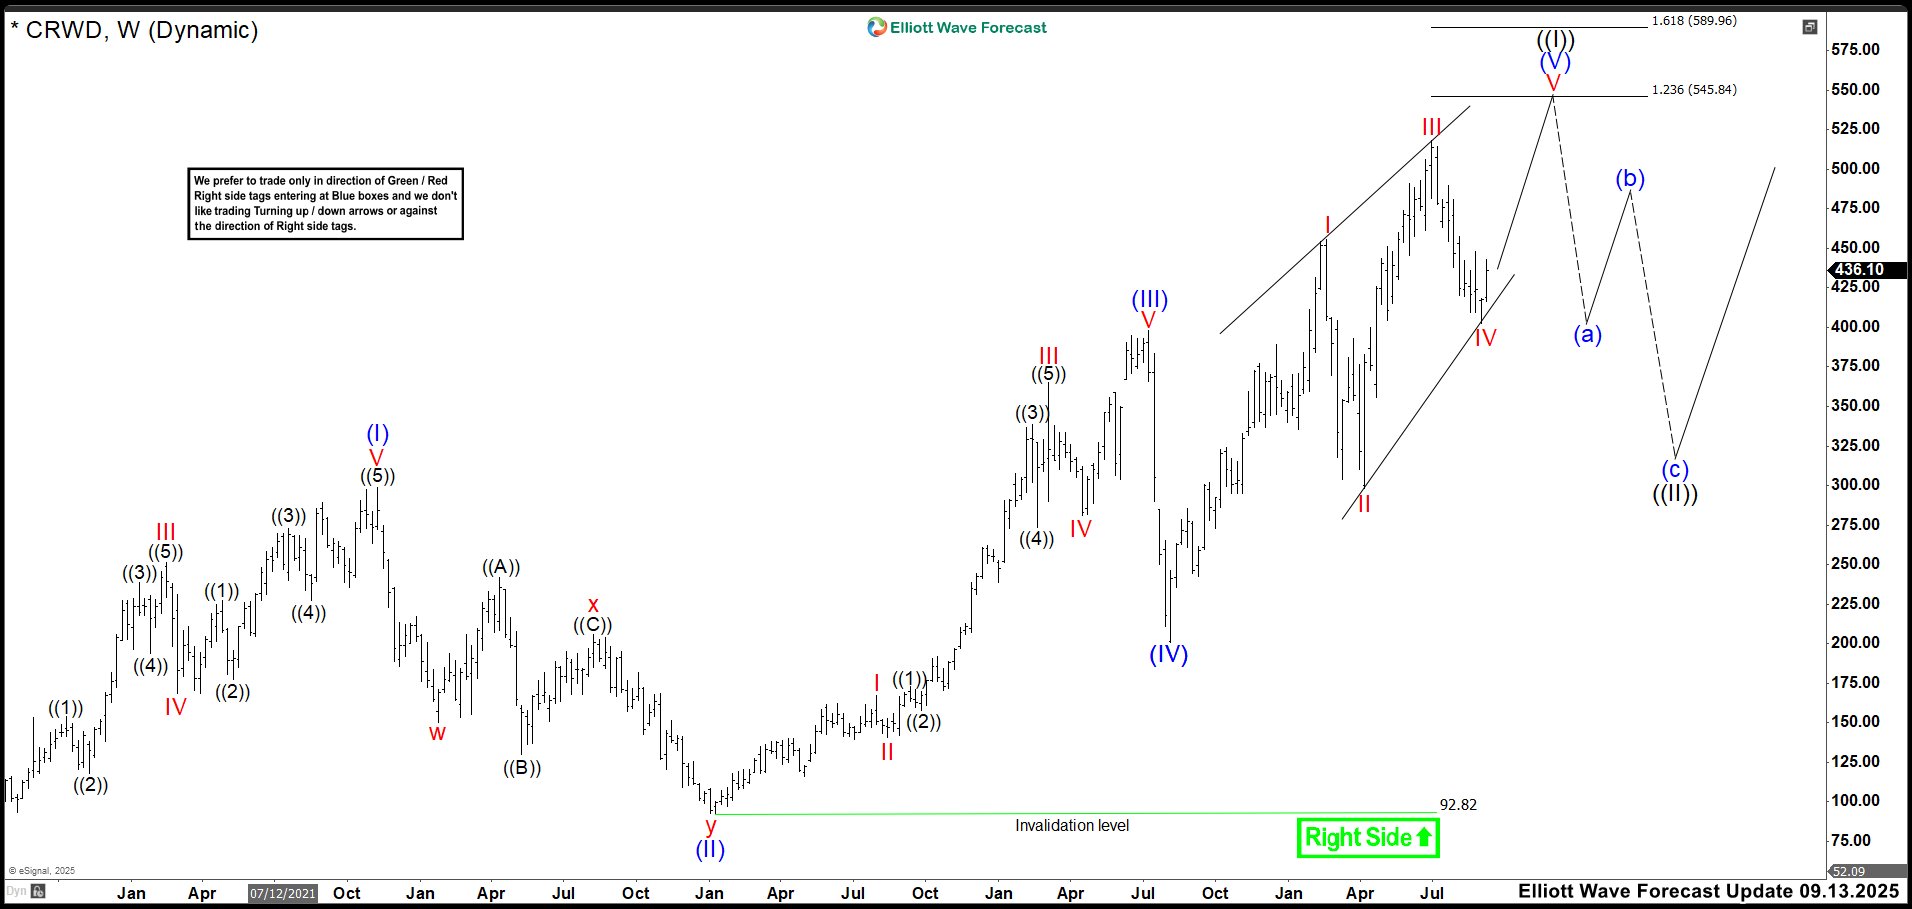
CRWD in Final Stage: One More High Could Trigger Market Correction
Read MoreCrowdStrike (CRWD) leads AI-powered cybersecurity with strong financial results and growing market presence. By mid-2025, its market value passed $104 billion. This shows investor trust, even with ongoing net losses. The Falcon platform boosts ARR through advanced endpoint protection and threat detection. As a result, recent quarters showed steady double-digit ARR growth, raising long-term revenue […]
-
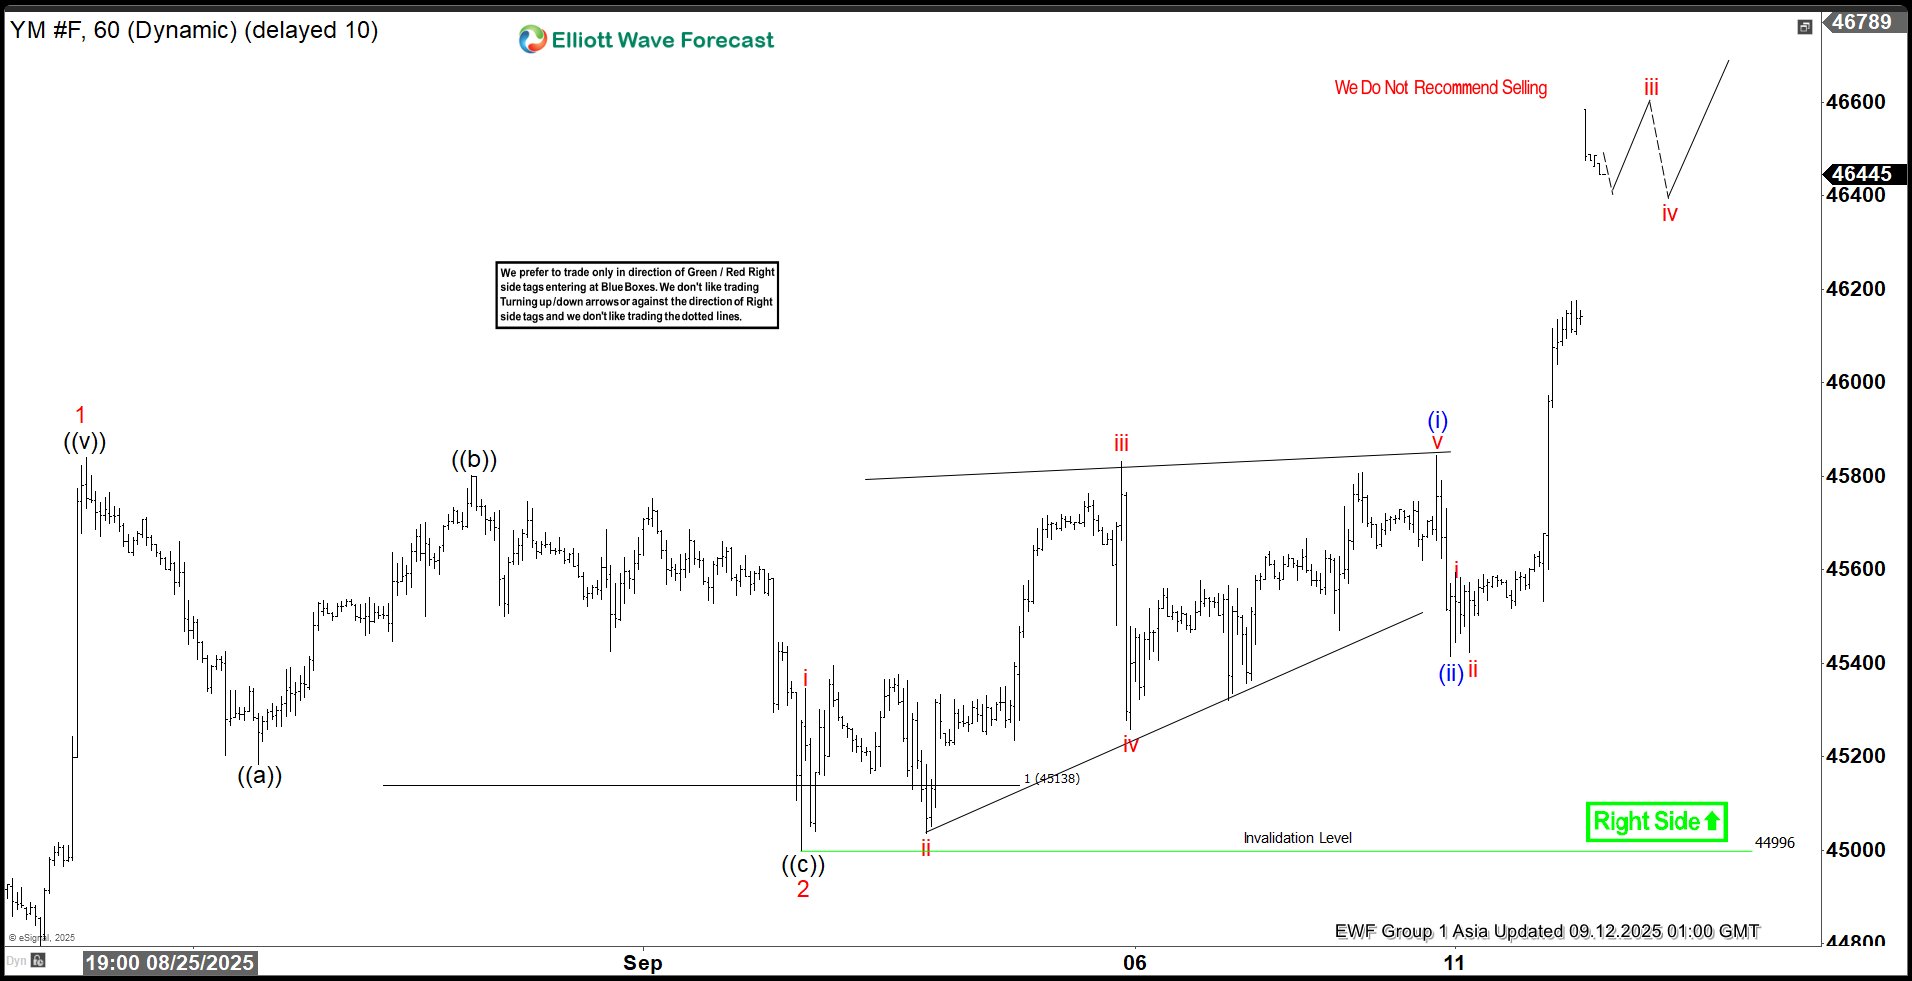
Dow Futures (YM) Resumes Upward Drive in Impulsive Formation
Read MoreDow Futures (YM) extends higher in impulsive structure. This article and video looks at the Elliott Wave path of the Index.