

The Power of 3-7-11 and the Grand Super Cycle: How We Saw the Bullish Turn in April 2025 Back on April 9, 2025, while World Indices were dropping sharply and global sentiment had turned overwhelmingly bearish, we published an article that challenged the fear-driven narrative. We explained why selling was not the right approach and […]
-
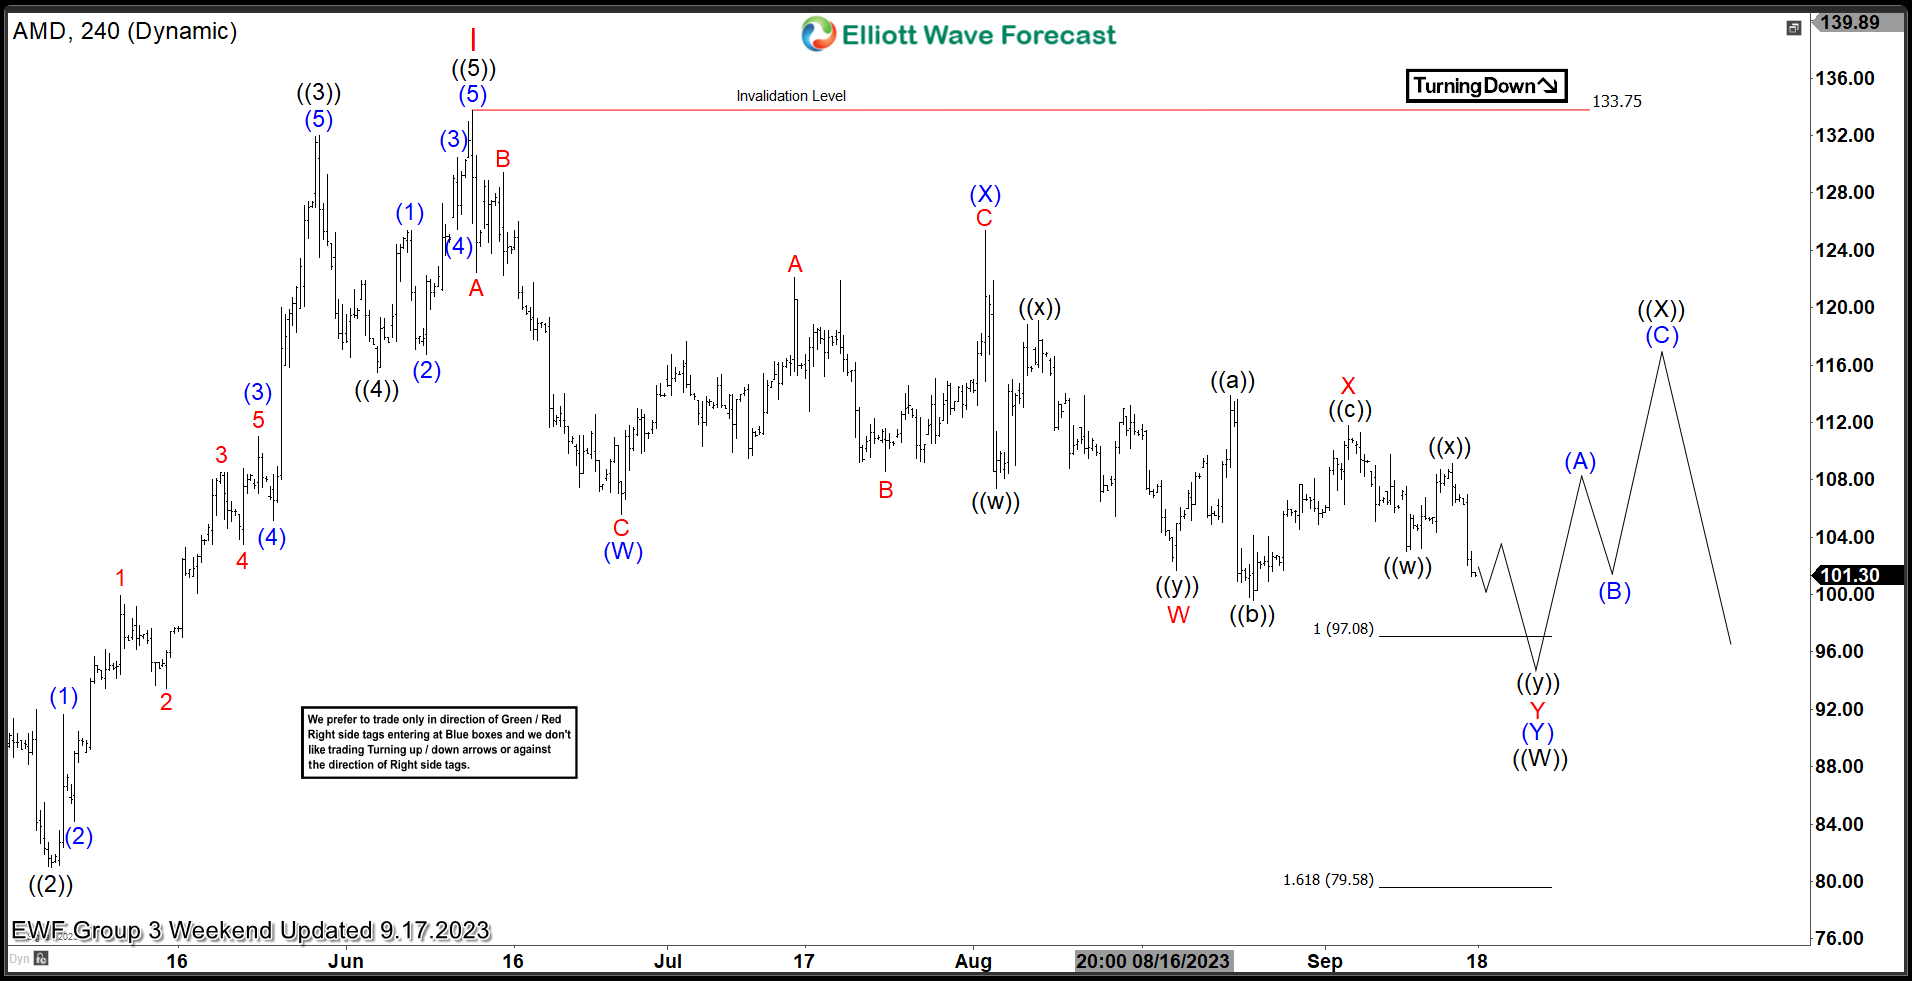
Advanced Micro Devices ($AMD) Found Buyers After a Corrective Pull Back.
Read MoreHello everyone. In today’s article, we will look at the past performance of the 4 Hour Elliott Wave chart of Advanced Micro Devices, Inc. ($AMD). The rally from 10.13.2022 low unfolded as a 5 wave impulse. So, we expected the pullback to unfold in 7 swings and find buyers again. We will explain the structure […]
-
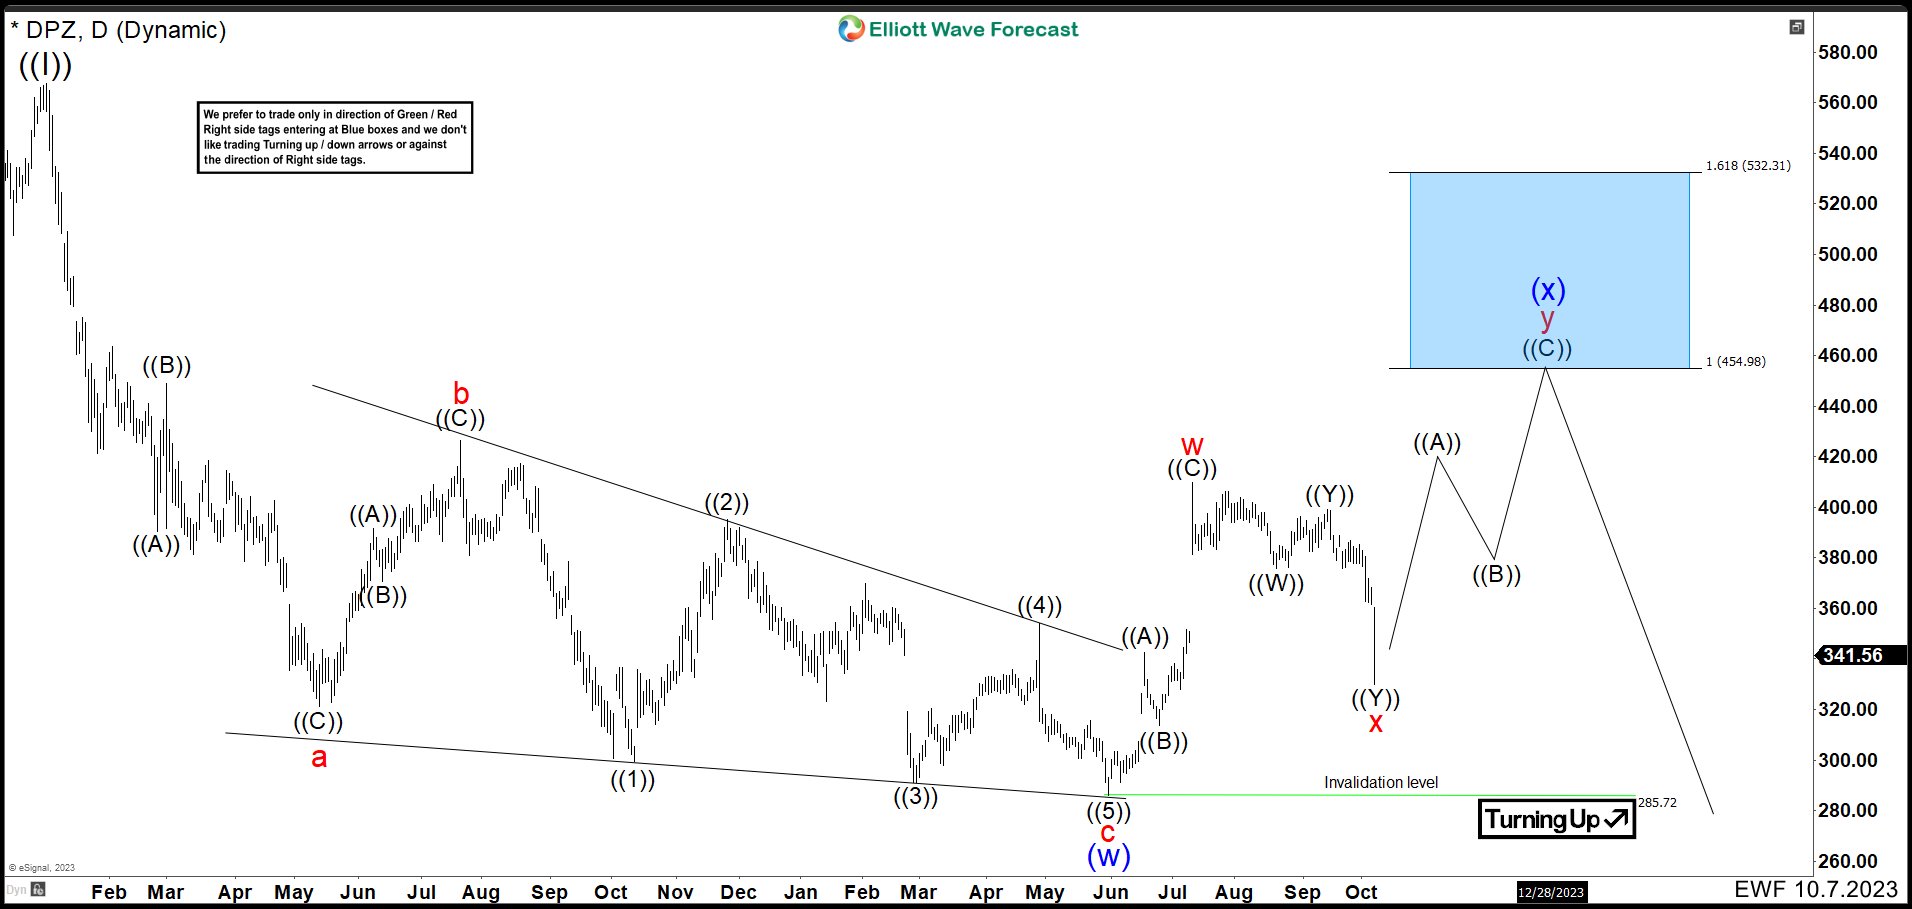
Domino’s Pizza (DPZ) Is Showing a Blue Box For Selling Opportunities
Read MoreDomino’s is an American multinational pizza restaurant chain. Founded in 1960, the chain is owned by master franchisor Domino’s Pizza, Inc (DPZ). As of 2018, Domino’s had approximately 15,000 stores, with 5,649 in the United States, 1,500 in India, and 1,249 in the United Kingdom. Domino’s has stores in over 83 countries and 5,701 cities worldwide. DPZ Weekly Chart March 2020 In […]
-
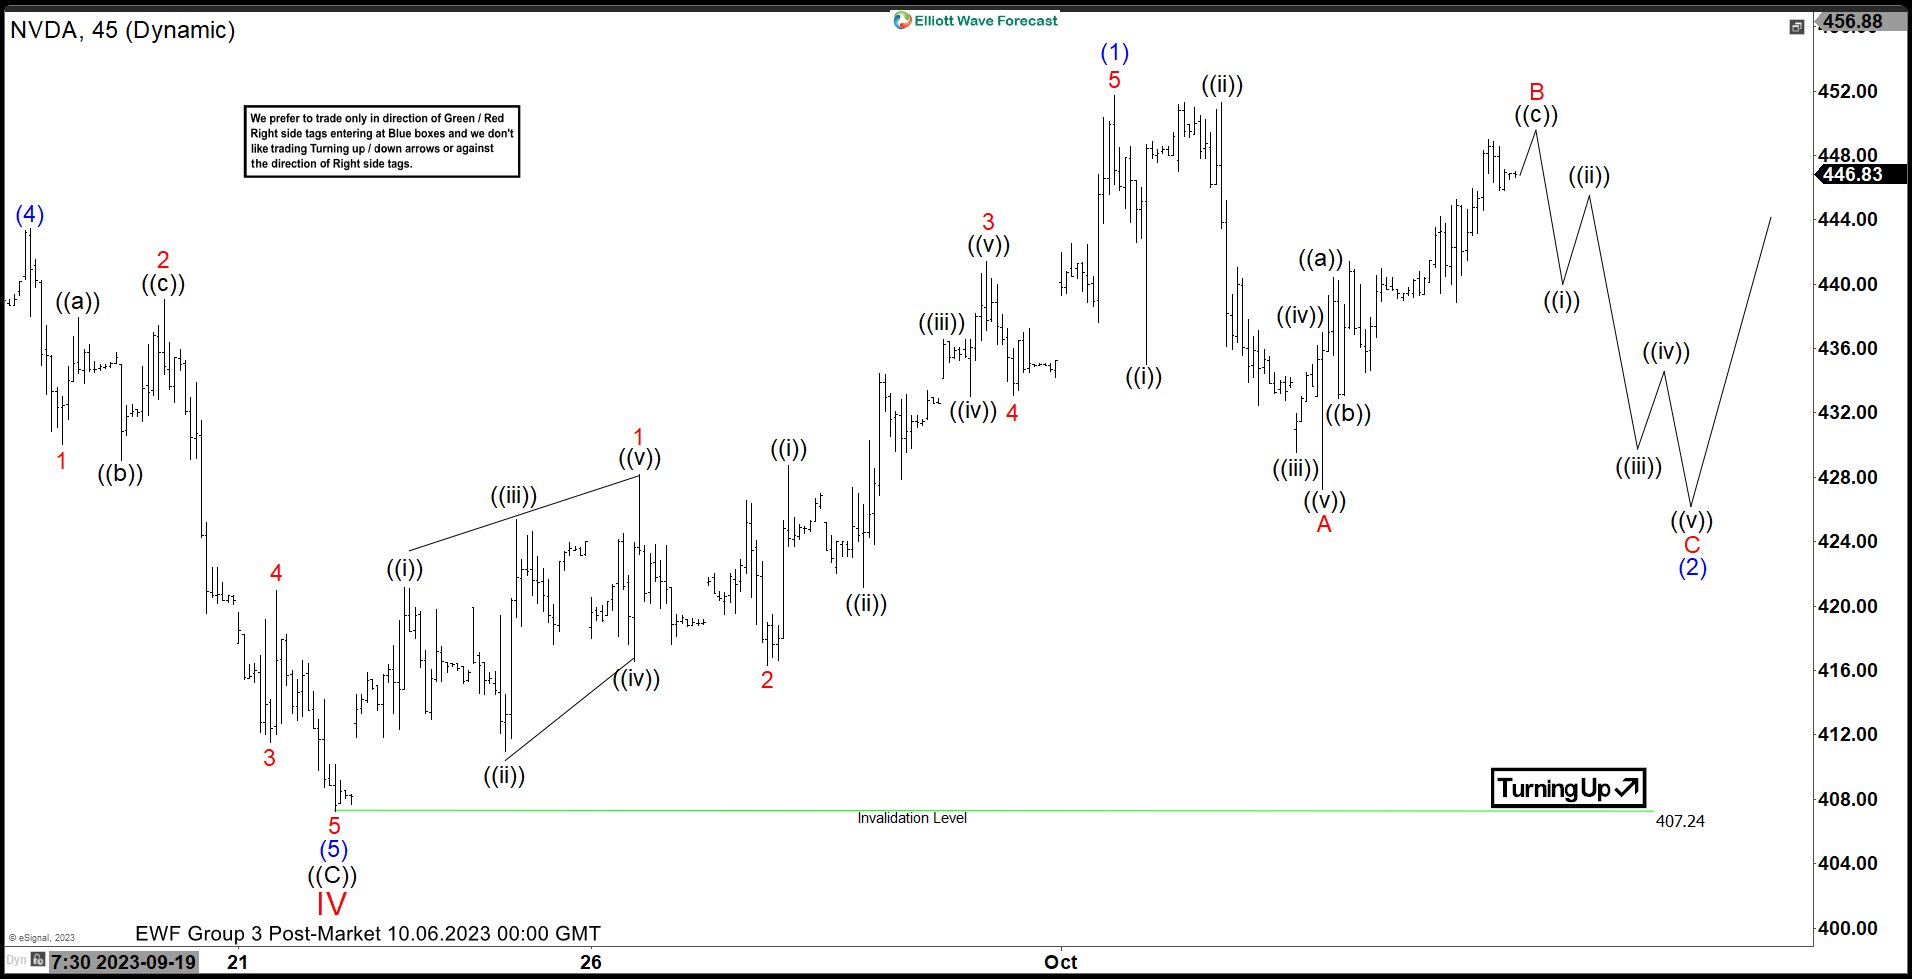
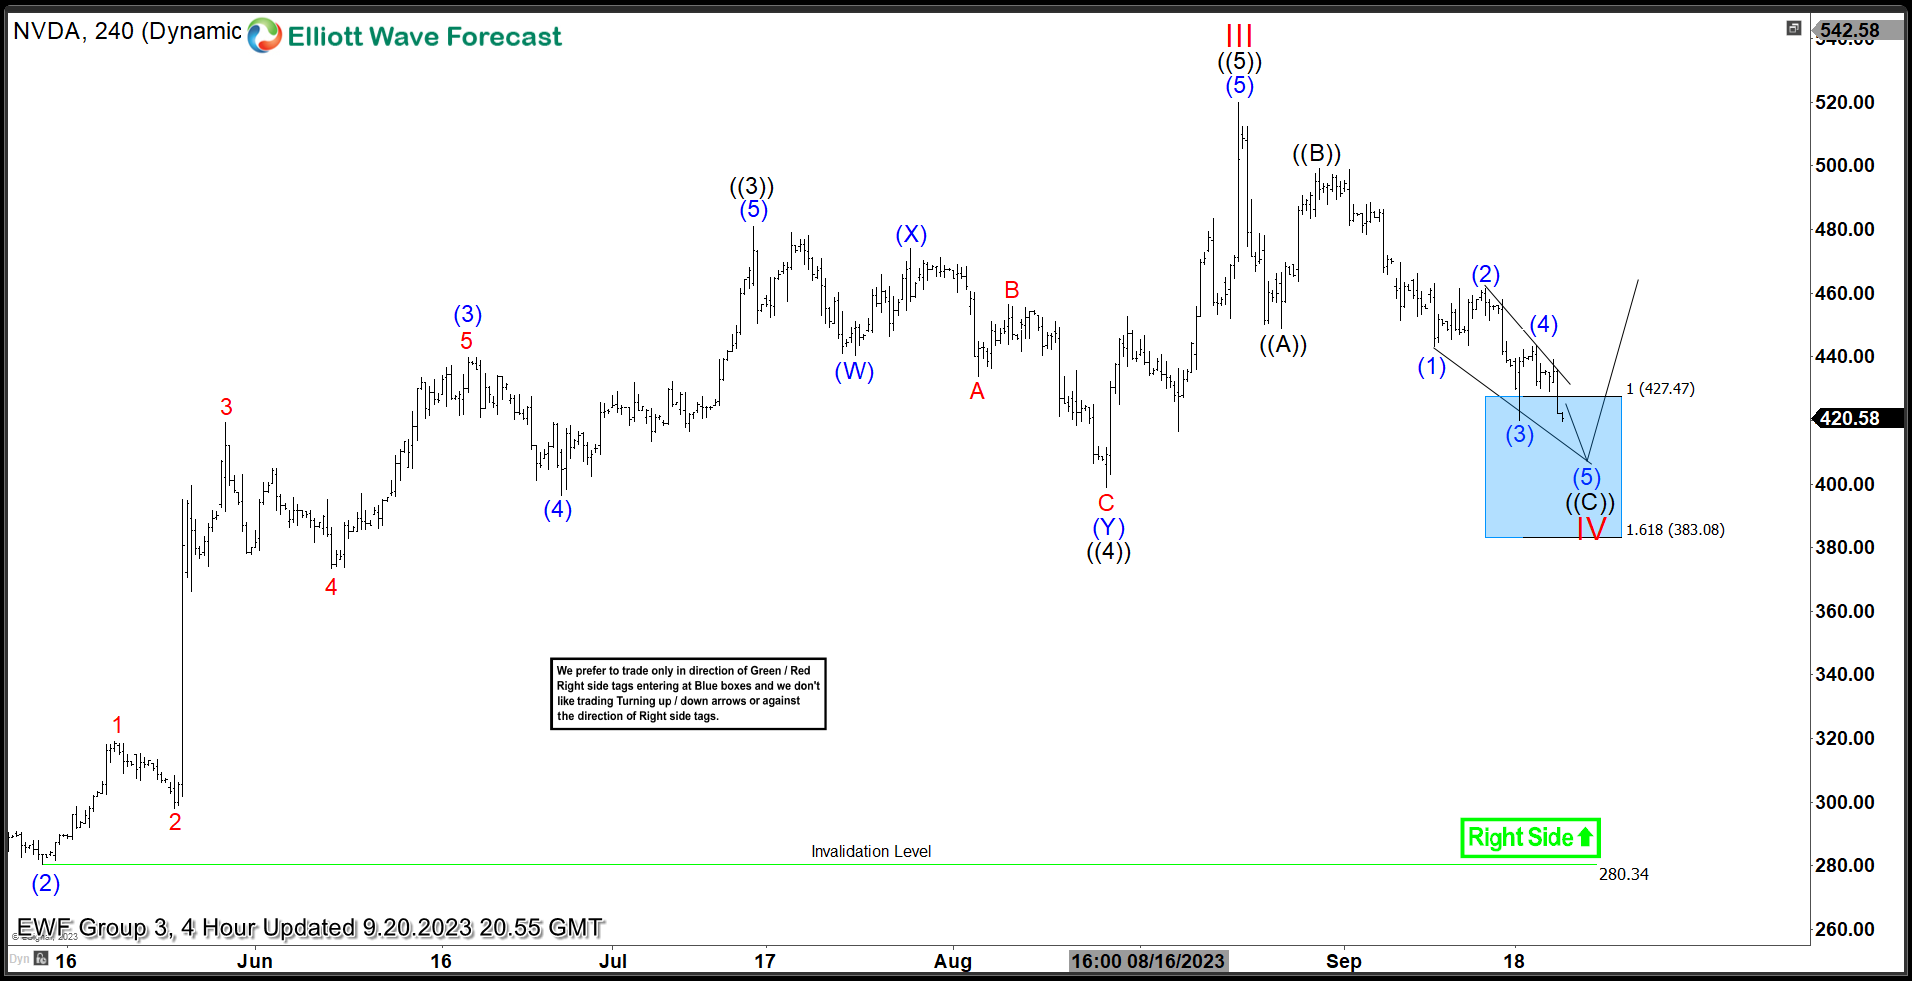
NVDA Looking for Zigzag Correction
Read MoreNvidia (NVDA) is looking for a zigzag correction before the rally resumes. This article and video look at the Elliott Wave path.
-
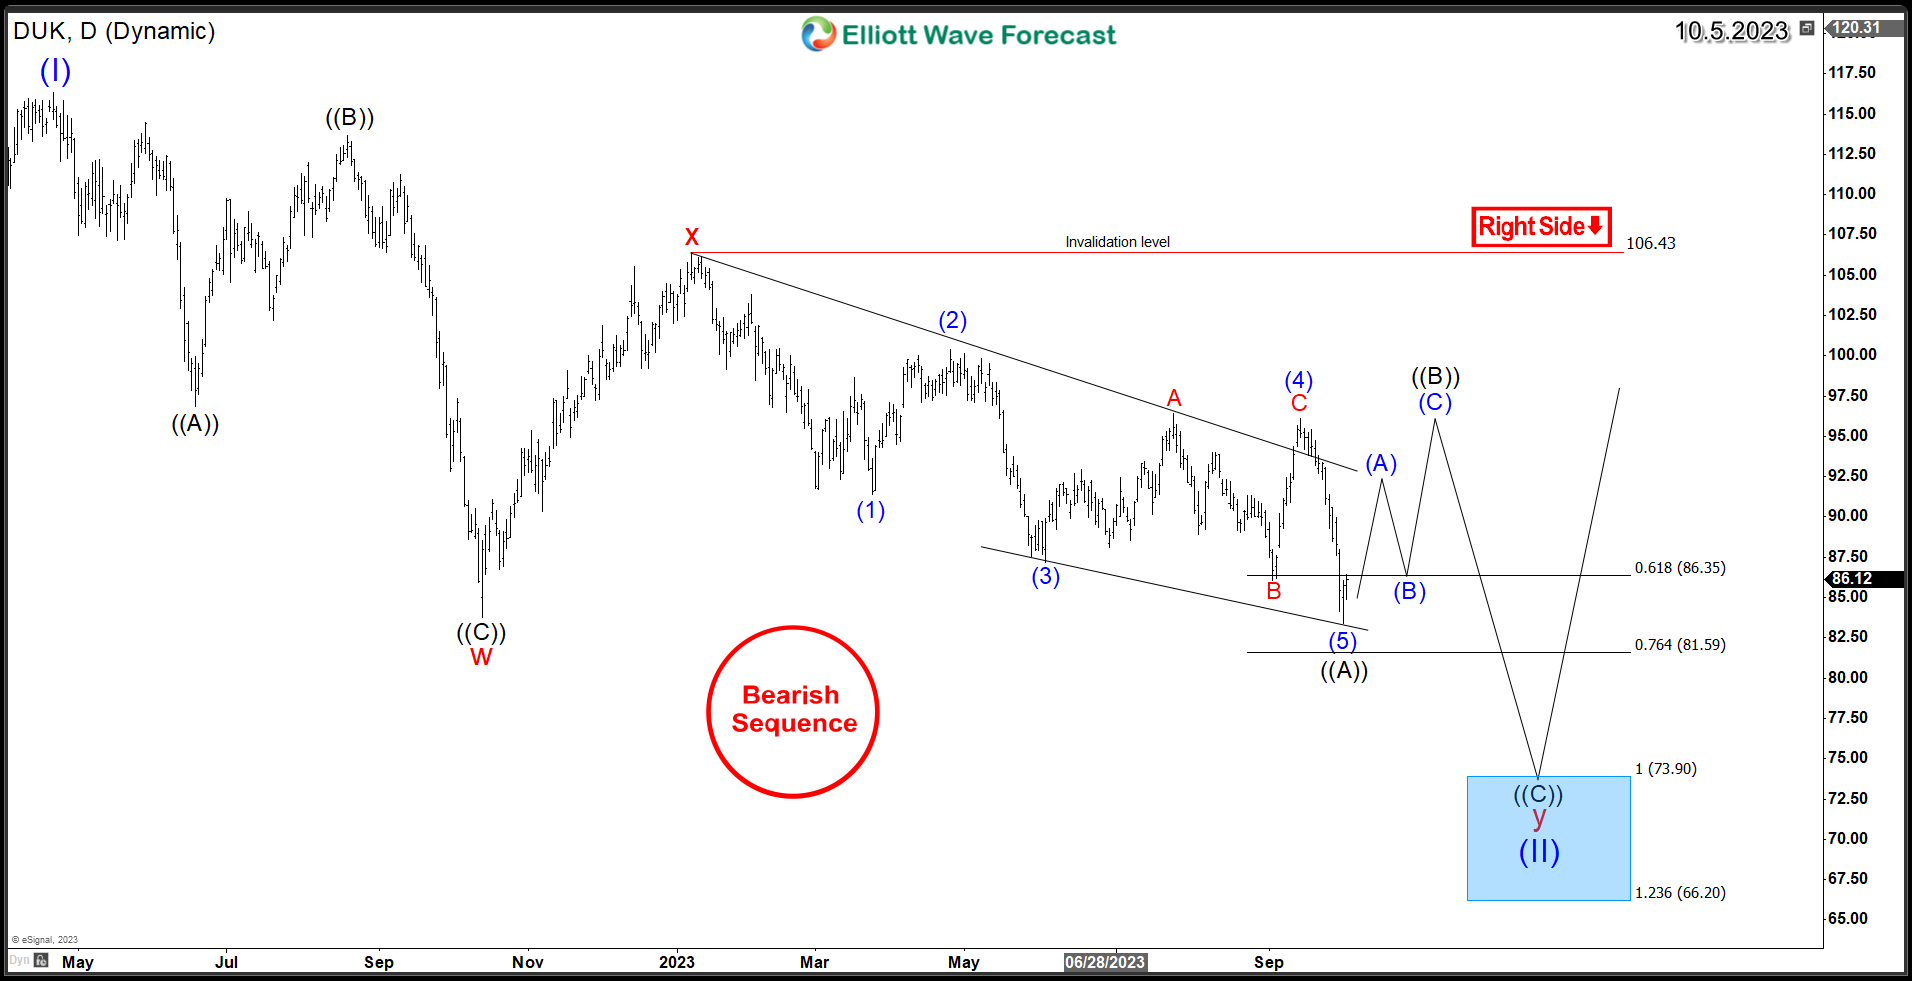
Duke Energy (NYSE: DUK) Navigating Rough Waters
Read MoreDuke Energy Corporation (NYSE: DUK), a prominent American electric power and natural gas holding company, has long been a stalwart in the utilities sector. However, recent market conditions have presented significant challenges for the company, and it finds itself navigating through turbulent times. As market volatility and industry headwinds persist, DUK faces short-term setbacks, but […]
-
NVDA Returning From The Elliott Wave Blue Box Area
Read MoreIn this blog, we take a look at the past performance of NVDA charts. The stock provided a buying opportunity in the blue box area.
-
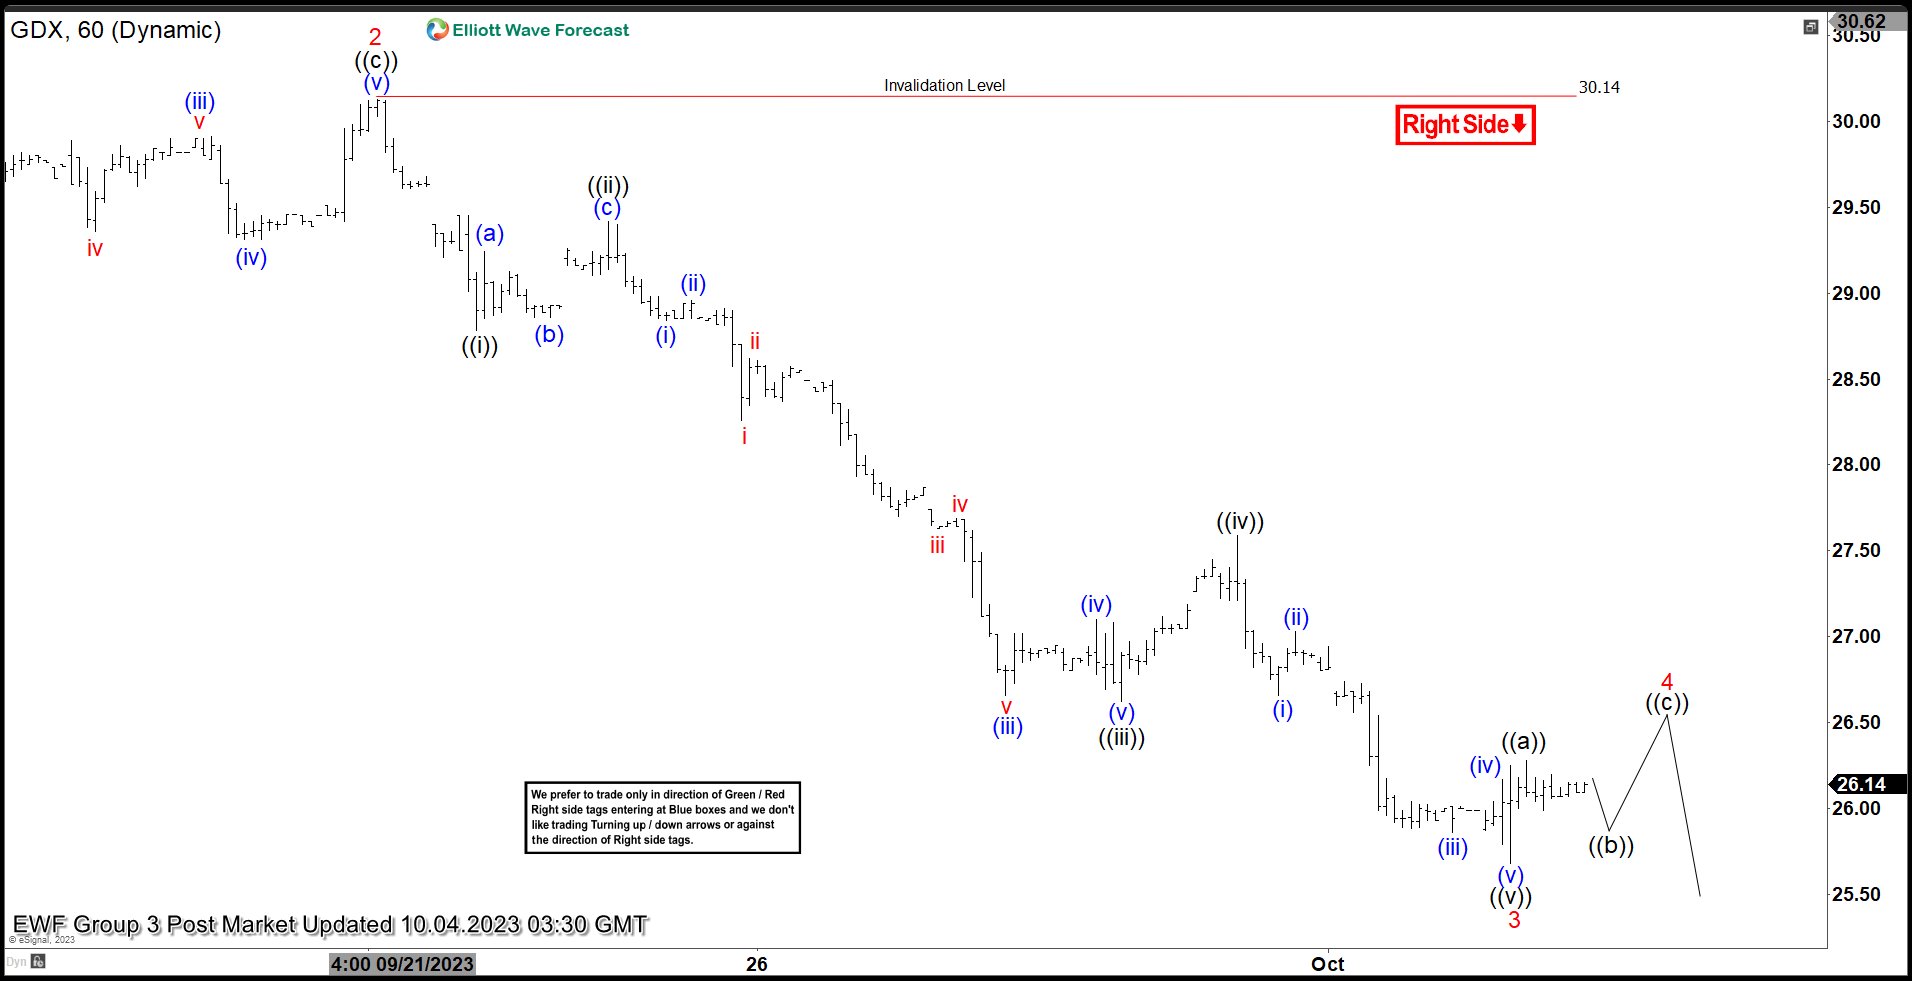
Gold Miners (GDX) Approaching Support Zone
Read MoreGold Miners ETF (GDX) shows bearish sequence favoring more downside. This article and video look at the Elliott Wave path.