

The Power of 3-7-11 and the Grand Super Cycle: How We Saw the Bullish Turn in April 2025 Back on April 9, 2025, while World Indices were dropping sharply and global sentiment had turned overwhelmingly bearish, we published an article that challenged the fear-driven narrative. We explained why selling was not the right approach and […]
-
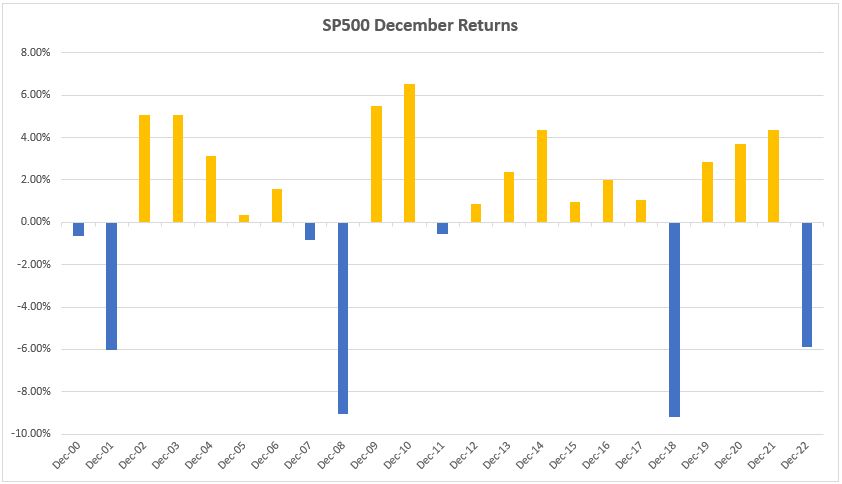
Will the Santa Rally Appear this 2023 in the Capital Market?
Read MoreThe Santa rally is a capital market phenomenon named in 1972 by Yale Hirsc. He noticed an unusual upward movement in the markets from December 28 to January 2 of the following year. This event has been recurrent for years that it has earned its own name “The Santa Rally”. According to the Stock Trader […]
-
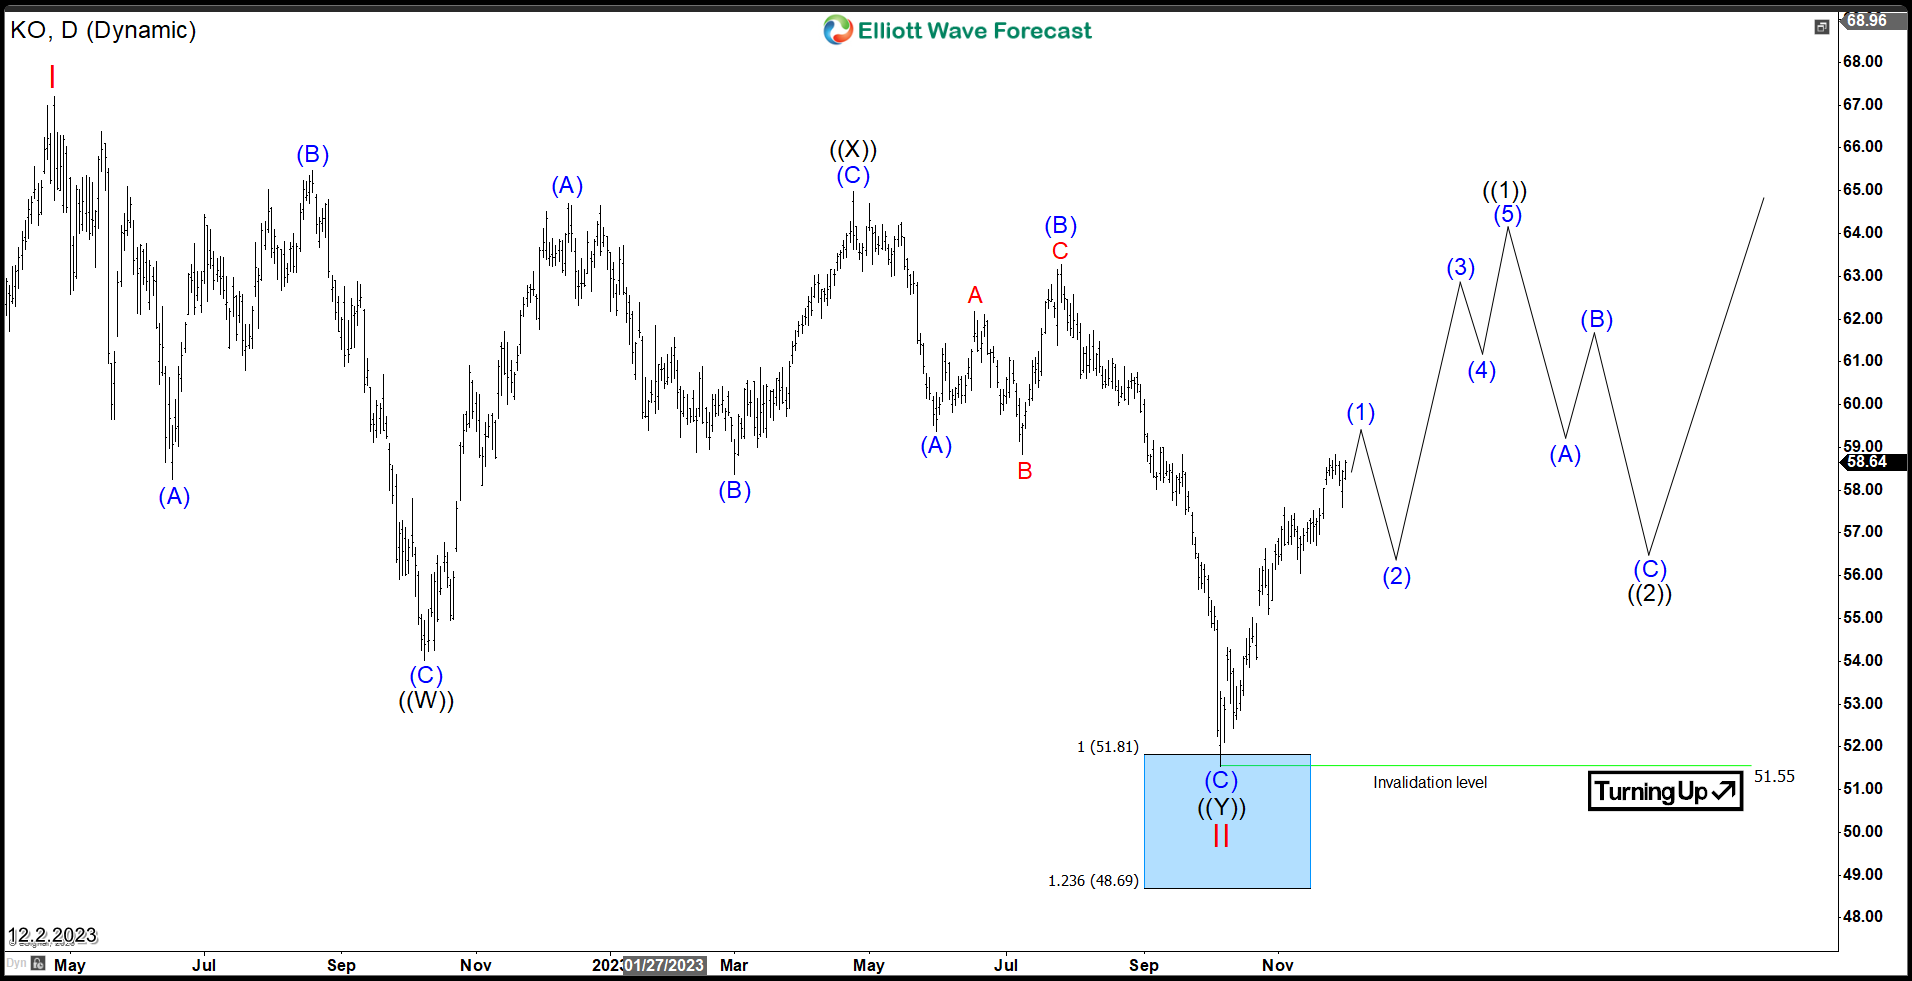
Coca-Cola (KO) Impulsive Reaction Support The Rally
Read MoreIn the past two years, Coca-Cola (NYSE: KO) has grappled with a challenging business landscape. Amid ongoing market uncertainty and volatility, investors closely examine the stock’s long-term growth prospects. In this article, we delve into analysing the current Elliott Wave Pattern for Coca-Cola, providing insights to guide investors through the stock’s mid-term movements. Since April 2022, KO has experienced a corrective […]
-
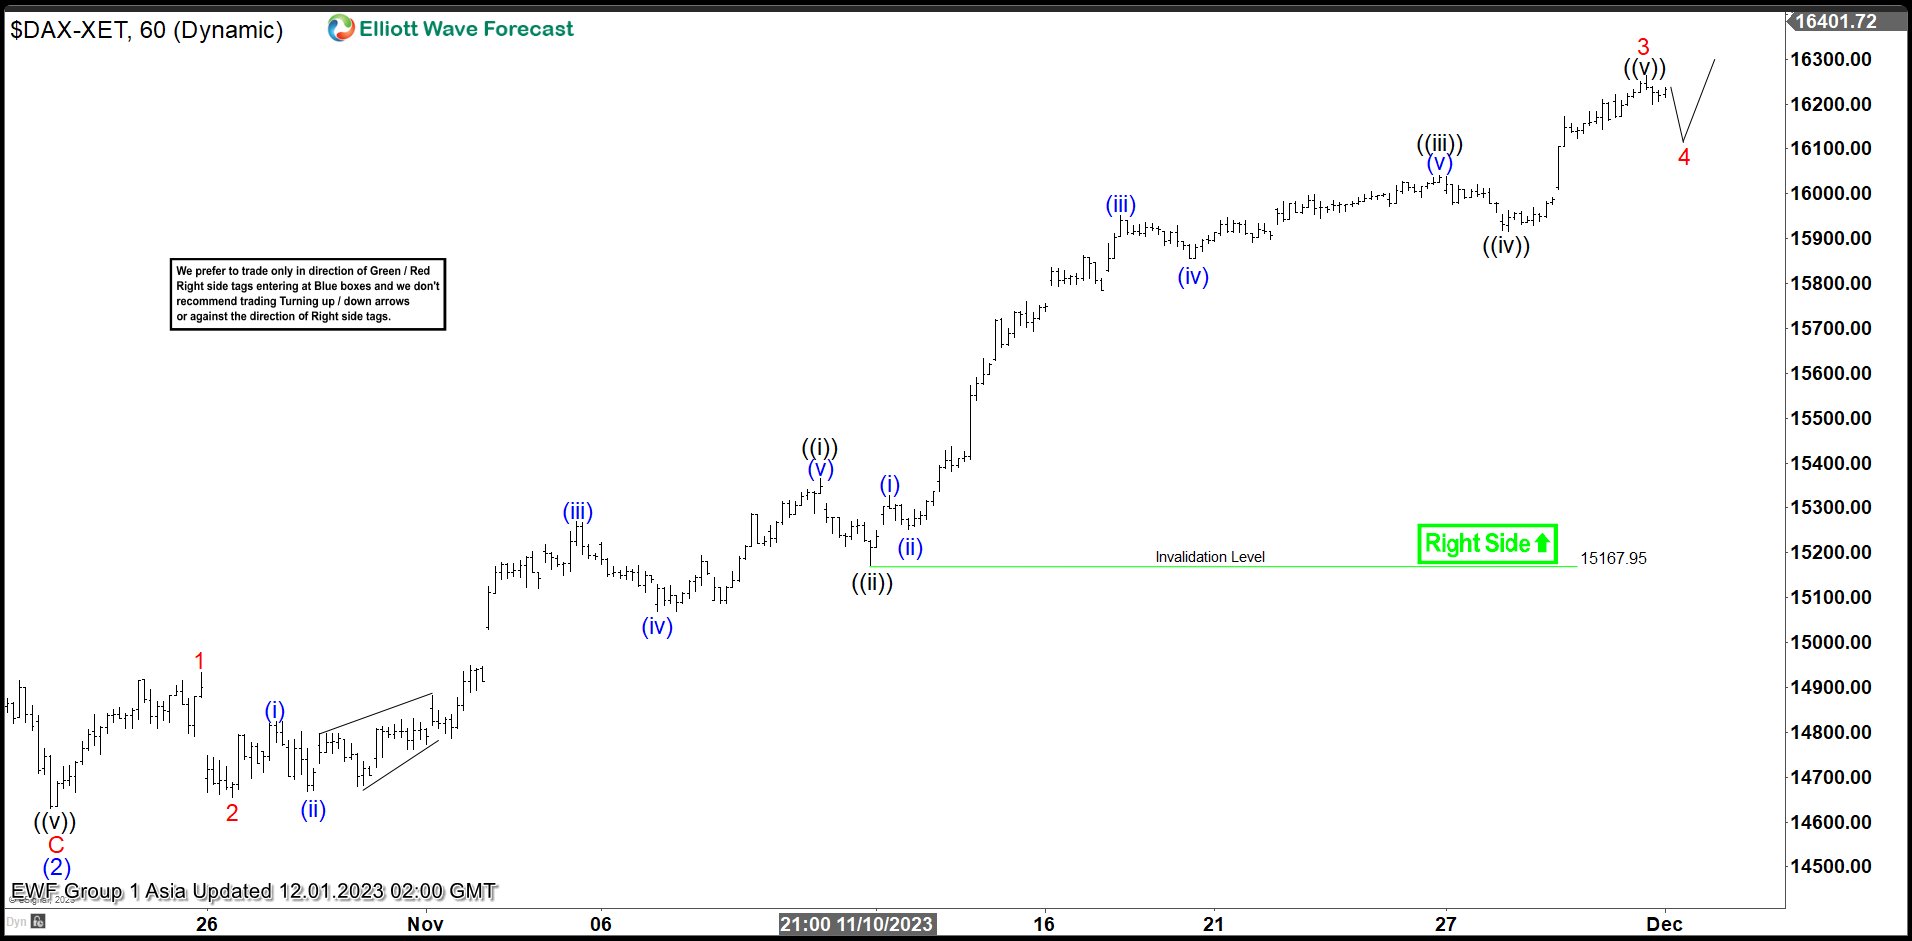
DAX Will Open Elliott Wave Bullish Sequence Soon
Read MoreDAX shows an impulsive rally from 9.29.2022 low favoring more upside. This article and video look at the Elliott Wave path for the Index.
-
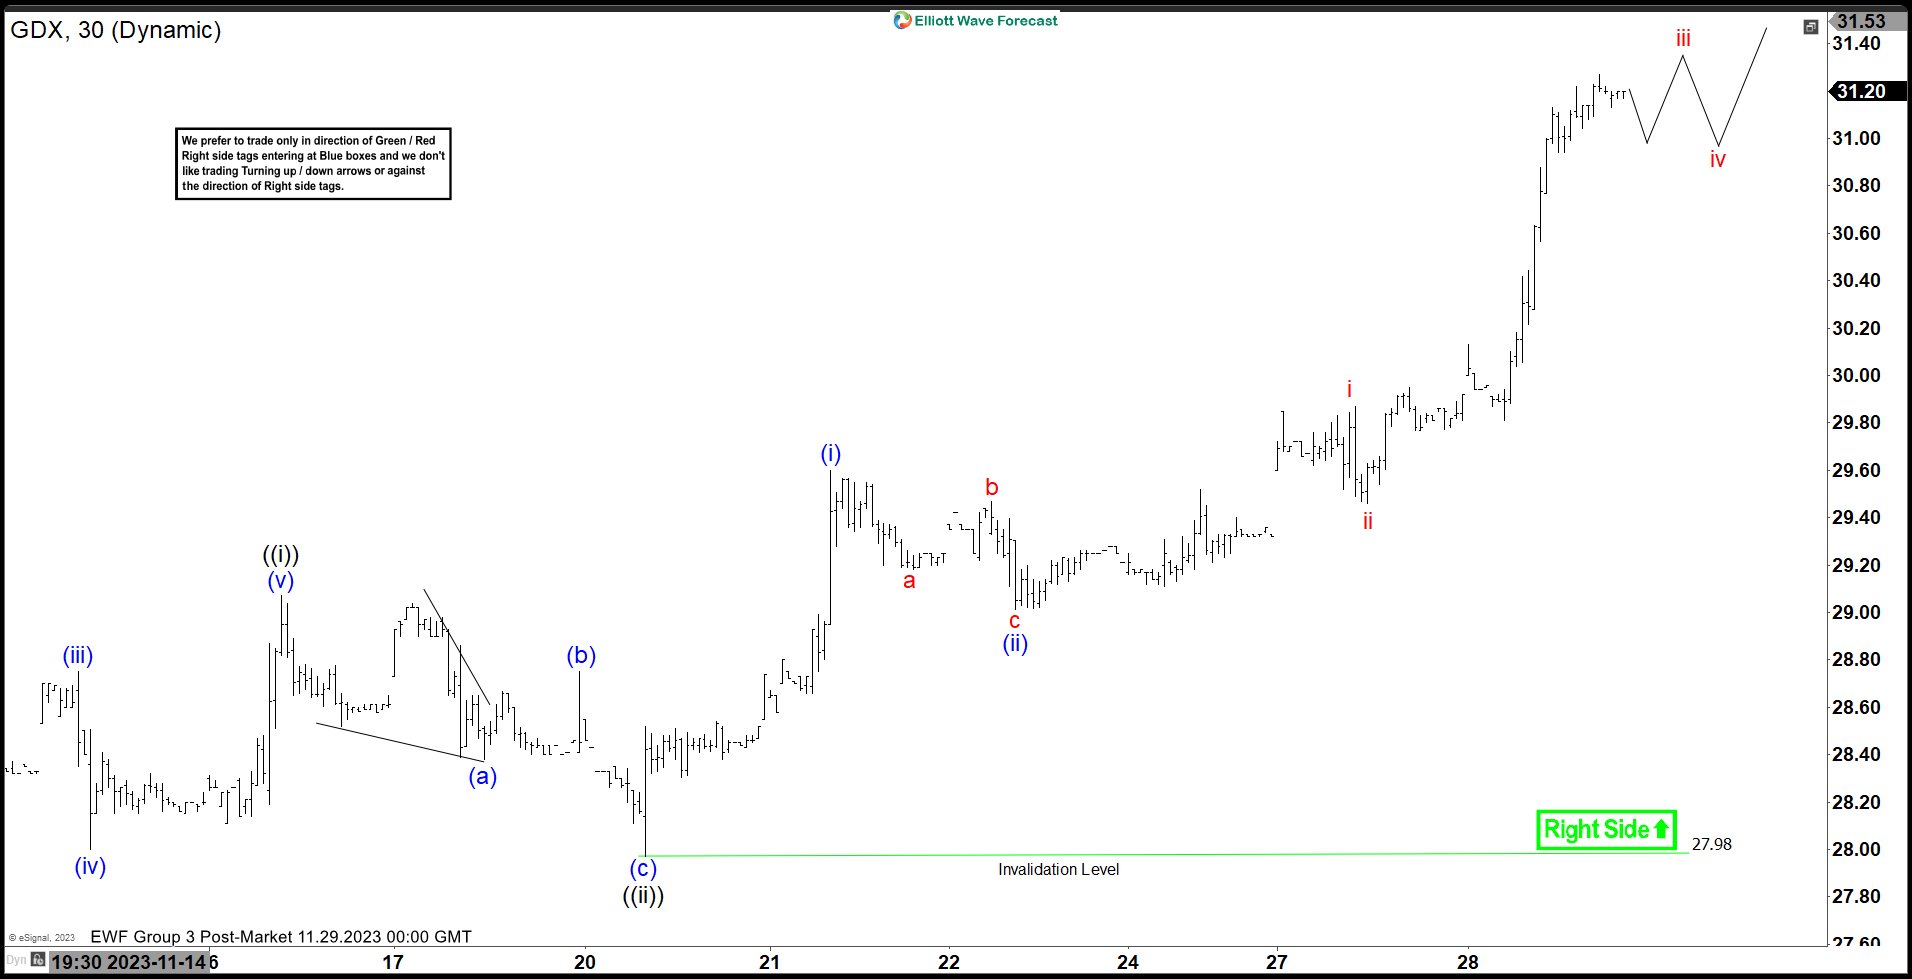
Gold Miners ETF (GDX) Should Continue to Extend Higher
Read MoreGold Miners (GDX) shows an impulsive structure from 11.10.2023 low favoring further upside. This article and video look at the Elliott Wave path.
-
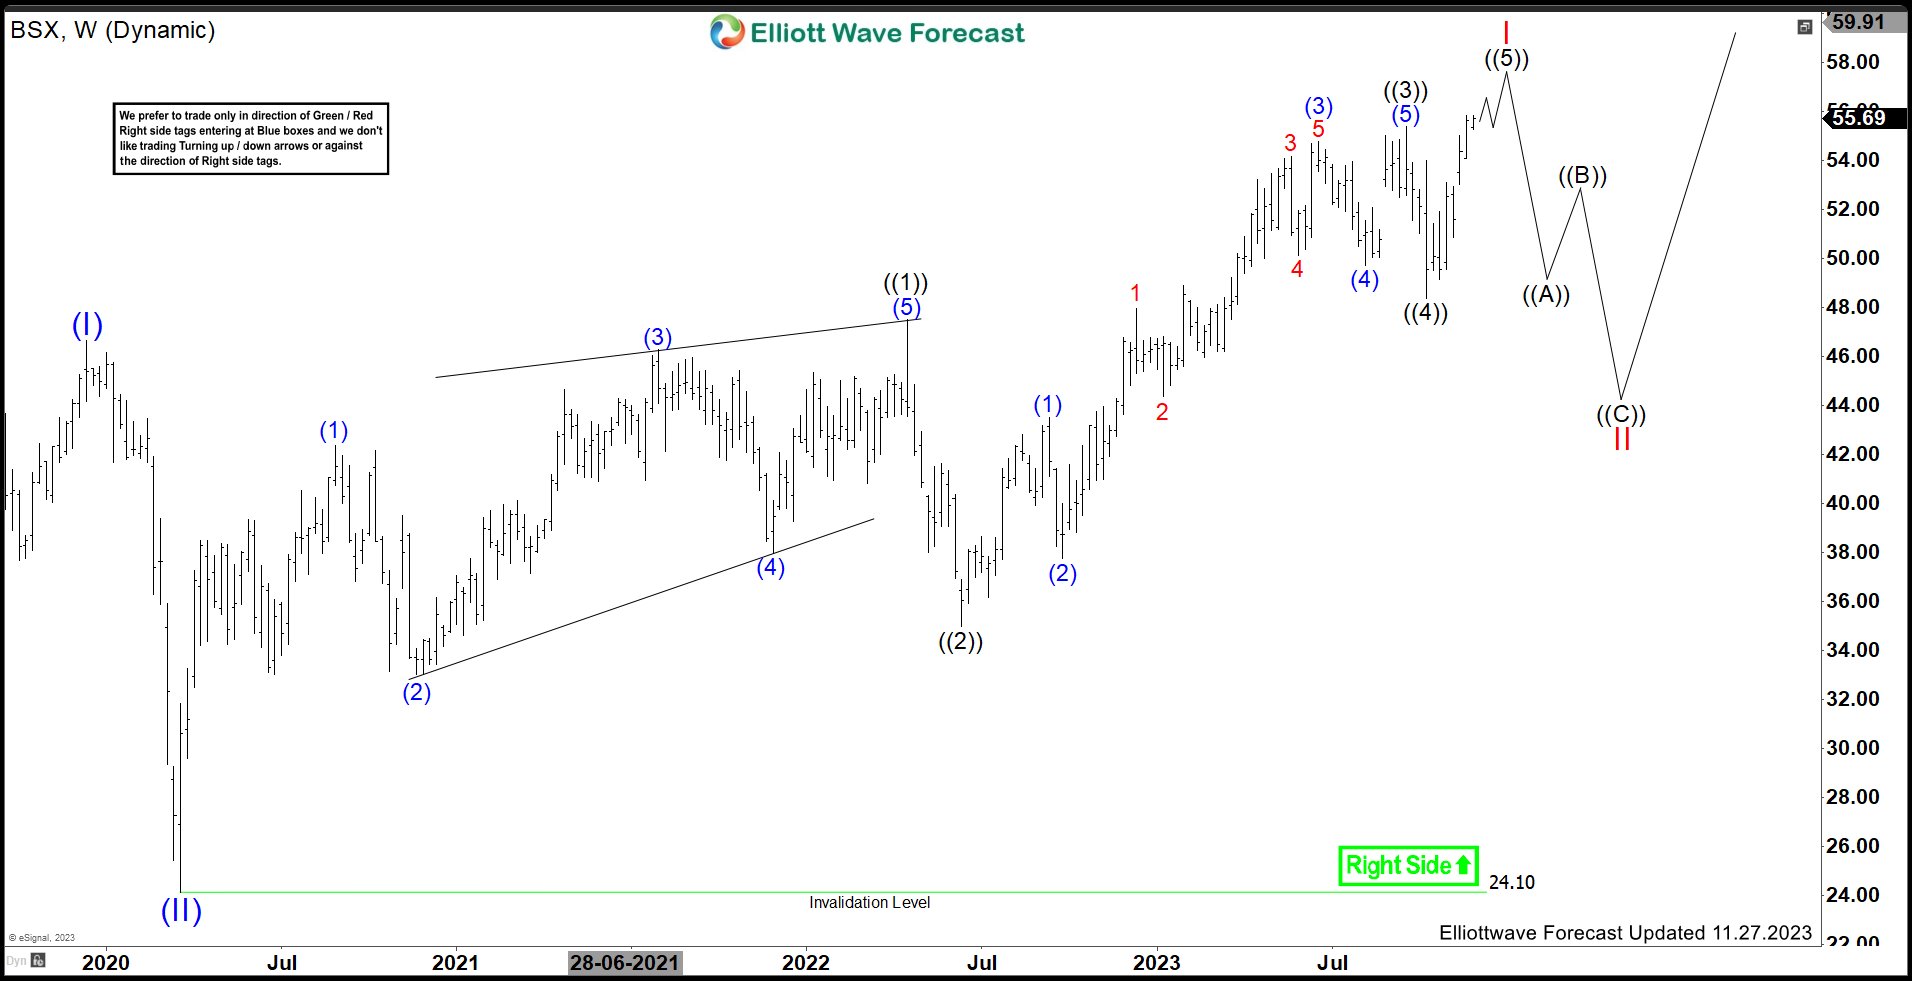
Will Boston Scientific Corporation (BSX) Continue Further upside?
Read MoreBoston Scientific Corporation (BSX) develops, manufactures & markets medical devices for use in various interventional medical specialties worldwide. It operates through MedSurg & Cardiovascular segments. It offers devices to diagnose & treat different medical conditions and offer remote patient management systems. It is based in Marlborough, US, comes under Healthcare sector & trades as “BSX” […]
-

LUV (Southwest Airlines CO) Provides Lifetime Opportunity Into $86.55
Read MoreThe Elliott Wave Theory’s main pattern has a five-waves advance and three-waves pullback. The Theory explains that the market moves in sequences of five waves starting from the lower Subminutte to the higher Grand Super Cycle degree. Long-time investors look for higher degrees of correction to enter the Market. The higher degrees provide higher risk […]