Moderna, Inc. is an US American pharmaceutical and biotechnology company. Founded in 2010 and headquartered in Cambridge, Massachusetts, USA, it is a part of NASDAQ100 and S&P500 indices. Investors can trade it under the ticker $MRNA at NASDAQ. The company’s only commercial product is the COVID-19 vaccin. Moreover, it has a portfolio of vaccine candidates for such disease areas like influenza, cancer, HIV, Eppstein-Barr virus, Nipah virus, chikungunya, respiratory syncytial virus and others. Will this broad engagement promote the stock price into a new rally? In the initial article from April 2020, we have called for more upside in Moderna. We were right. Here we present an update.
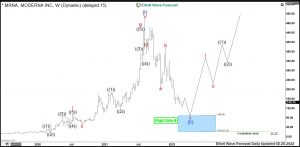
Moderna Weekly Elliott Wave Analysis 02.21.2022
The weekly chart below shows the Moderna stock $MRNA traded at Nasdaq. From the all-time lows, the stock price is showing Elliott wave motive wave pattern. The main cycle up in blue wave (I) of super cycle degree has ended by printing the all-time high in August 2021 at 497.49. Clearly, one can see an impulse with an extended wave III. After 5 waves higher in wave (I), the correction lower in 3 swings of wave (II) lower is still in progress. While price is holding below 377.19, expect wave c of (II) to reach lower.
Investors and traders can be looking to buy wave (II) from 89.20-21.23 area. The target for wave (III) will be 497.49 and even higher.
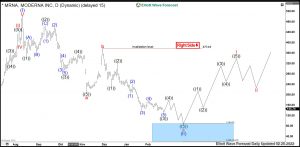
Moderna Daily Elliott Wave Analysis 02.21.2022
The daily chart below shows in more detail the final stages of the wave (I) and the decline in wave (II). From the all-time highs in August 2021, wave (II) unfolds currently as an Elliott wave zigzag pattern being 5-3-5 structure. Hereby, waves a and b have already finished, wave c is in progress and should reach towards 100% extension of the wave a. Also, the structure of the wave c looks incomplete.
Therefore, the blue box area 89.20-21.23 is a great opportunity to enter the market at a good price. Buyers should be waiting there. From the extremes, the Moderna stock should accelerate in the blue wave (III) towards 497.49 and higher.
Get more insights about Stocks and ETFs by trying out our services 14 days . You’ll learn how to trade the market in the right side using the 3, 7 or 11 swings sequence. You will get access to our 78 instruments updated in 4 different time frames, Live Trading & Analysis Session done by our Expert Analysts every day, 24-hour chat room support and much more.
Back


