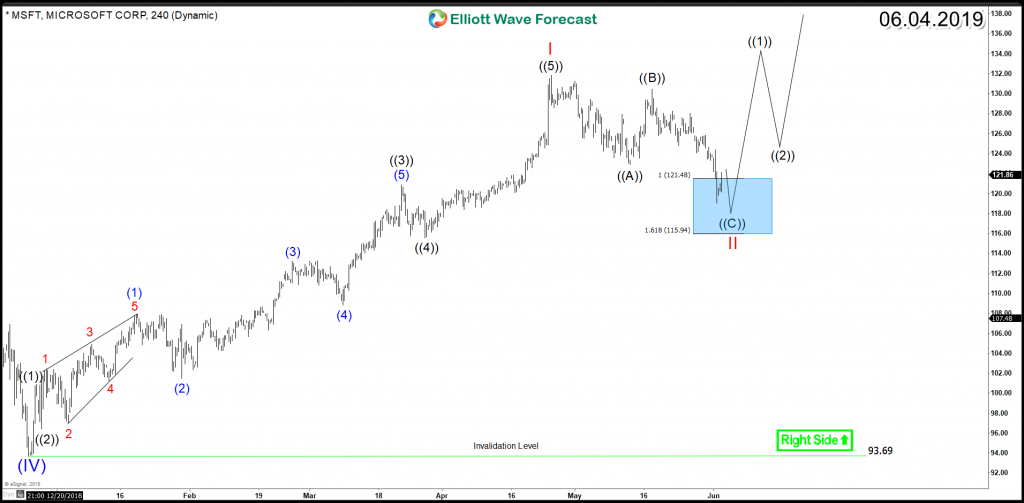
Microsoft ( NASDAQ: MSFT) established new all time highs back in April the 25th and since then it saw a 9% drop. MSFT follow the same code as the rest of the financial market so if we take a look at the technical chart of the stock we can recognize a clear impulsive pattern taking place from December 2018 low.
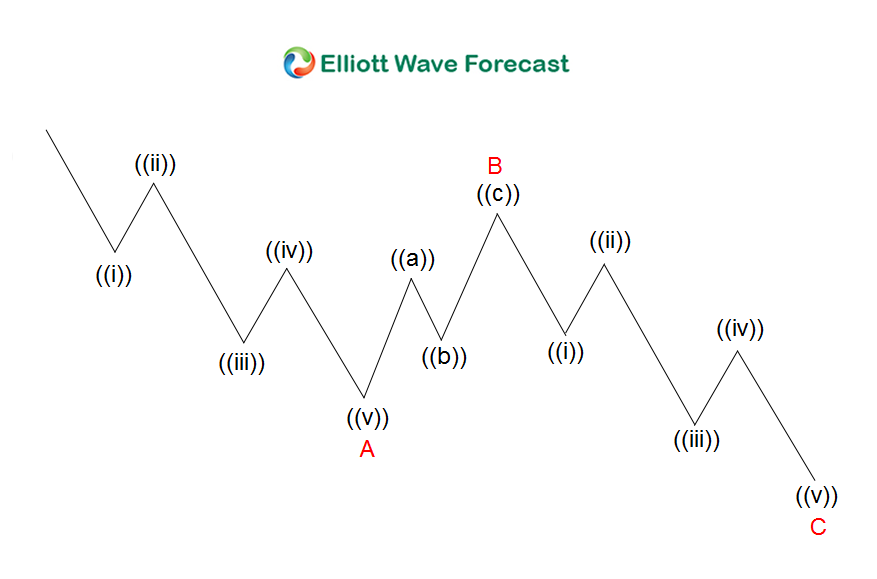
Based on the Elliott Wave Theory, every 5 waves impulsive structure is followed by a technical corrective sequences which comes in 3, 7 or 11 swings. At the end of the corrective sequence, usually the instrument will resume the move within the main trend or at least correct the previous cycle. In the Classic 3 swings ABC zigzag structure, the Market does 5 waves move, then it corrects in 3 waves followed with another 5 waves move to the same direction of the previous 5 waves.
MSFT rally from $93.7 low was in impulsive 5 waves which ended at 4/25/2019 peak $131.8. Down from there it started the correction lower showing an initial 3 waves pullback which reached the 100% – $161.8% Fibonacci extension area $121.5 – $115.9 . Up from there, the stock will have the possibility to resume the rally to new all time highs and create separation to absorb the next pullback.
MSFT 4H Chart Zigzag Structure
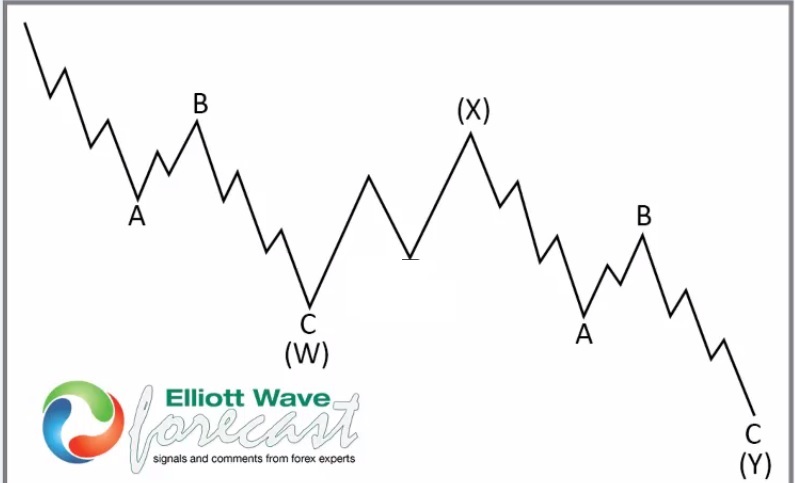
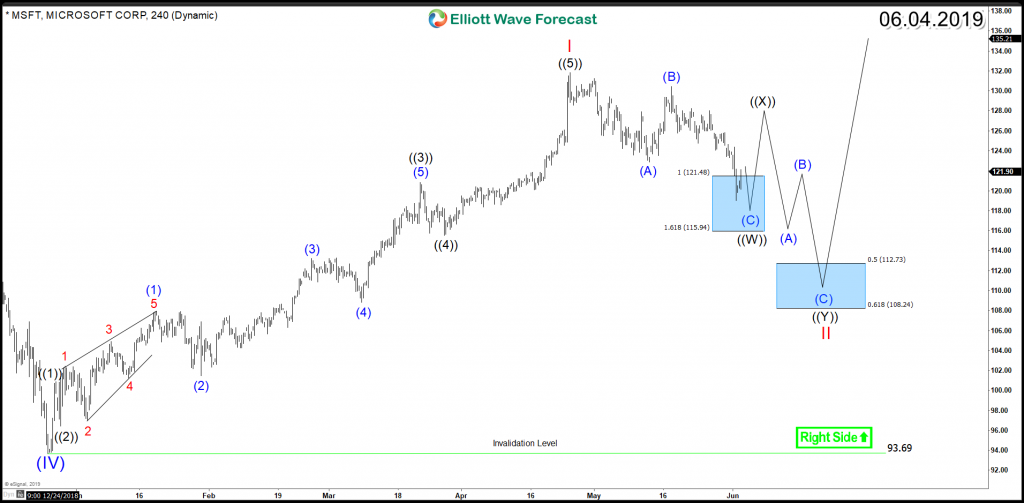
However, if MSFT only bounce in 3 waves and fail to break above April peak, then the stock will be looking to extend the correction in a 7 swings structure to the downside. In a double three structure, the Market does 3 waves move, then it corrects in 3 waves followed with another 3 waves move to the same direction of the previous 3 waves. In that case, MSFT can trade lower toward the 50% – $61.8 Fibonacci retracement area $112.7 – $108.2 before ending the ((W))((X))((Y)) structure then the stock will try one more time to rally to new all time highs.
MSFT 4H Chart Double Three Structure
Conclusion
Our Blue Box in extension creates a reaction 85% of the time and it represent a High-frequency area where the Markets are likely to end cycles and make a turn. Consequently, Microsoft ending a corrective Elliott Wave technical structure from April peak and buyers will show up around extreme area looking for the rally to resume to new all time highs or to provide a 3 waves bounce at least as long as pivot at $December 2018 low $93.7 remains intact.
If you’re interested in further structures & sequences then take this opportunity and try our services 14 days to learn how to trade Stocks and ETFs using the 3, 7 or 11 swings sequence and our blue boxes. You will get access to our 78 instruments updated in 4 different time frames, Live Trading & Analysis Session done by our Expert Analysts every day, 24-hour chat room support and much more.
Back


