According to Nasdaq.com, NYSE HPQ HP Inc. is expected to report earnings on 08/23/2017 after market close. The report will be for the fiscal Quarter ending Jul 2017. According to Zacks Investment Research, based on 6 analysts’ forecasts, the consensus EPS forecast for the quarter is $0.42. The reported EPS for the same quarter last year was $0.48. Last quarter, the company posted a positive earnings surprise of 2.6%. Notably, the stock surpassed the Zacks Consensus Estimate thrice and came in line once, over the trailing four quarters. It has an average positive earnings surprise of 3%.
Few Words about NYSE:HPQ. HP Inc. (also known as Hewlett Packard) is an American technology company leading as a global provider in computing and imaging solutions and services for business and home. The company is focused on capitalizing on the opportunities of the Internet and the proliferation of electronic services. Its major businesses include Imaging and Printing Systems, Computing Systems and Information Technology Services. HPQ was formed on November 1, 2015 out of the personal computer and printer divisions of the original Hewlett-Packard Company, with its enterprise products and services businesses becoming Hewlett Packard Enterprise. The split was structured so that Hewlett-Packard changed its name to HP Inc. and spun off Hewlett Packard Enterprise as a new publicly traded company. HP Inc. retains Hewlett-Packard’s pre-2015 stock price history and its former stock ticker symbol, HPQ, while Hewlett Packard Enterprise trades under its own symbol, HPE.
Regarding the coming earnings, Zacks.com model does not support that HP will likely beat the Zacks Consensus Estimate in its upcoming release due to that fact that Earnings ESP, which represents the difference between the Most Accurate estimate and the Zacks Consensus Estimate, is currently pegged at 0.00%. This is because the Most Accurate estimate of 42 cents comes in line with the Zacks Consensus Estimate. One more reason for the above assumption is that HP carries a Zacks Rank #2. Though this increases the predictive power of ESP, the company’s ESP of 0.00% makes surprise prediction difficult.
Despite that, many analyst hold Bullish HPQ due to the following reasons:
HP is the leader in Printing Company World Wide especially after September 12, 2016 announcement that Hewlett Packard NYSE:HPQ set to buy Samsung Electronics’ OTC:SSNLF printer business for a cash payment of $1.05 billion. The acquisition is expected to close in 2017 and is expected to be accretive in the first full year following closing. After closing, Samsung has agreed to make a $100 million to $300 million equity investment in HP through open market purchases.
Numerous Studies surfing the internet indicating by various Price Valuation Models, HPQ Stock price still remains relatively undervalued.
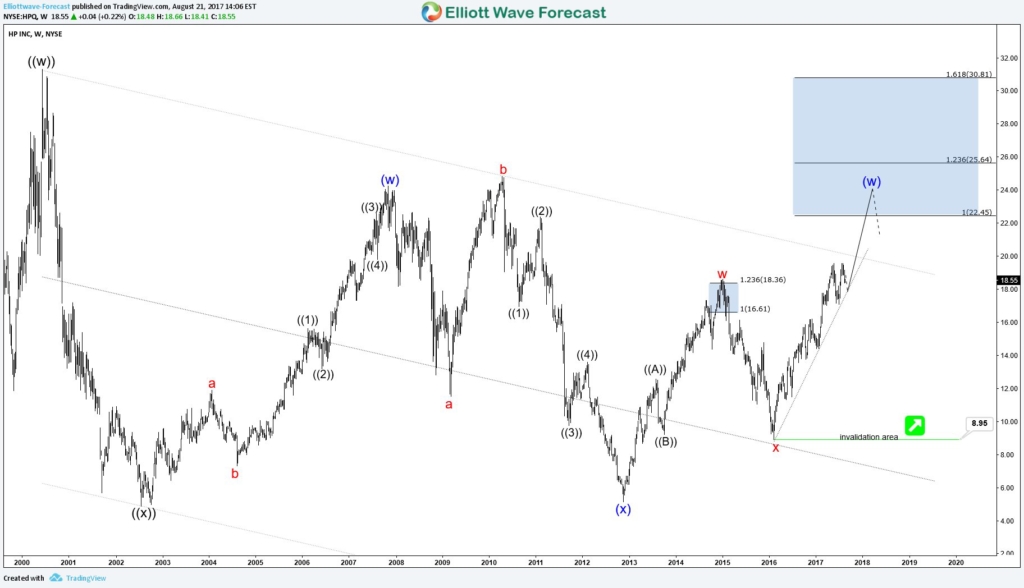
When it comes to our view relating to NYSE:HPQ, in the weekly time frame we remain overall Bullish the Stock. At this stage we would like to see a break above the multi year descending trend line around the 20’s and from there expect price to extend to the 22’s – 25’s area to reach the equal legs – 1.236% extension from the 11/19/2012 cycle’s lows at 5.16 before price could see sellers and correct lower. Note, HPQ can see a continuation in the pull back towards the supporting trendline around the level of 17.80’s before extend higher or see at least a 3 wave bounce against the highs at 19.60’s.
HPQ HP Inc Weekly
In the case of new highs above 24.85’s (wave b red) then the Stock will mark a incomplete bullish sequence in the weekly time frame from 07/22/2002 and from there recommend the buying the dips in 3 7 or 11 swings.
If you have found our analysis interesting and/or if you would like to fine tune the above Trading opportunity in the lower time frames, we are almost certain you will enjoy our new plan covering 13 Stocks & 13 ETFs, providing Daily Technical Analysis in the Weekly, Daily, 4 Hours and Hourly including Trading opportunities, Live Sessions and many more. If you would like to learn more you can always join us.. We provide a 14 days FREE to try our services and learn how to to trade forex, indices, commodities and stocks using our blue boxes and the 3, 7 or 11 swings sequence, just click on this link. You will get access to our 78 instruments updated in 4 different time frames, Live Trading Room and 3 Live Analysis Session done by our Expert Analysts every day, 24-hour chat room support and much more.
Back


