Google (NASDAQ: GOOGL) super bullish cycle since 2009 low is still in progress and in this article we’ll be taking a look at the daily chart using the Elliott Wave Theory.
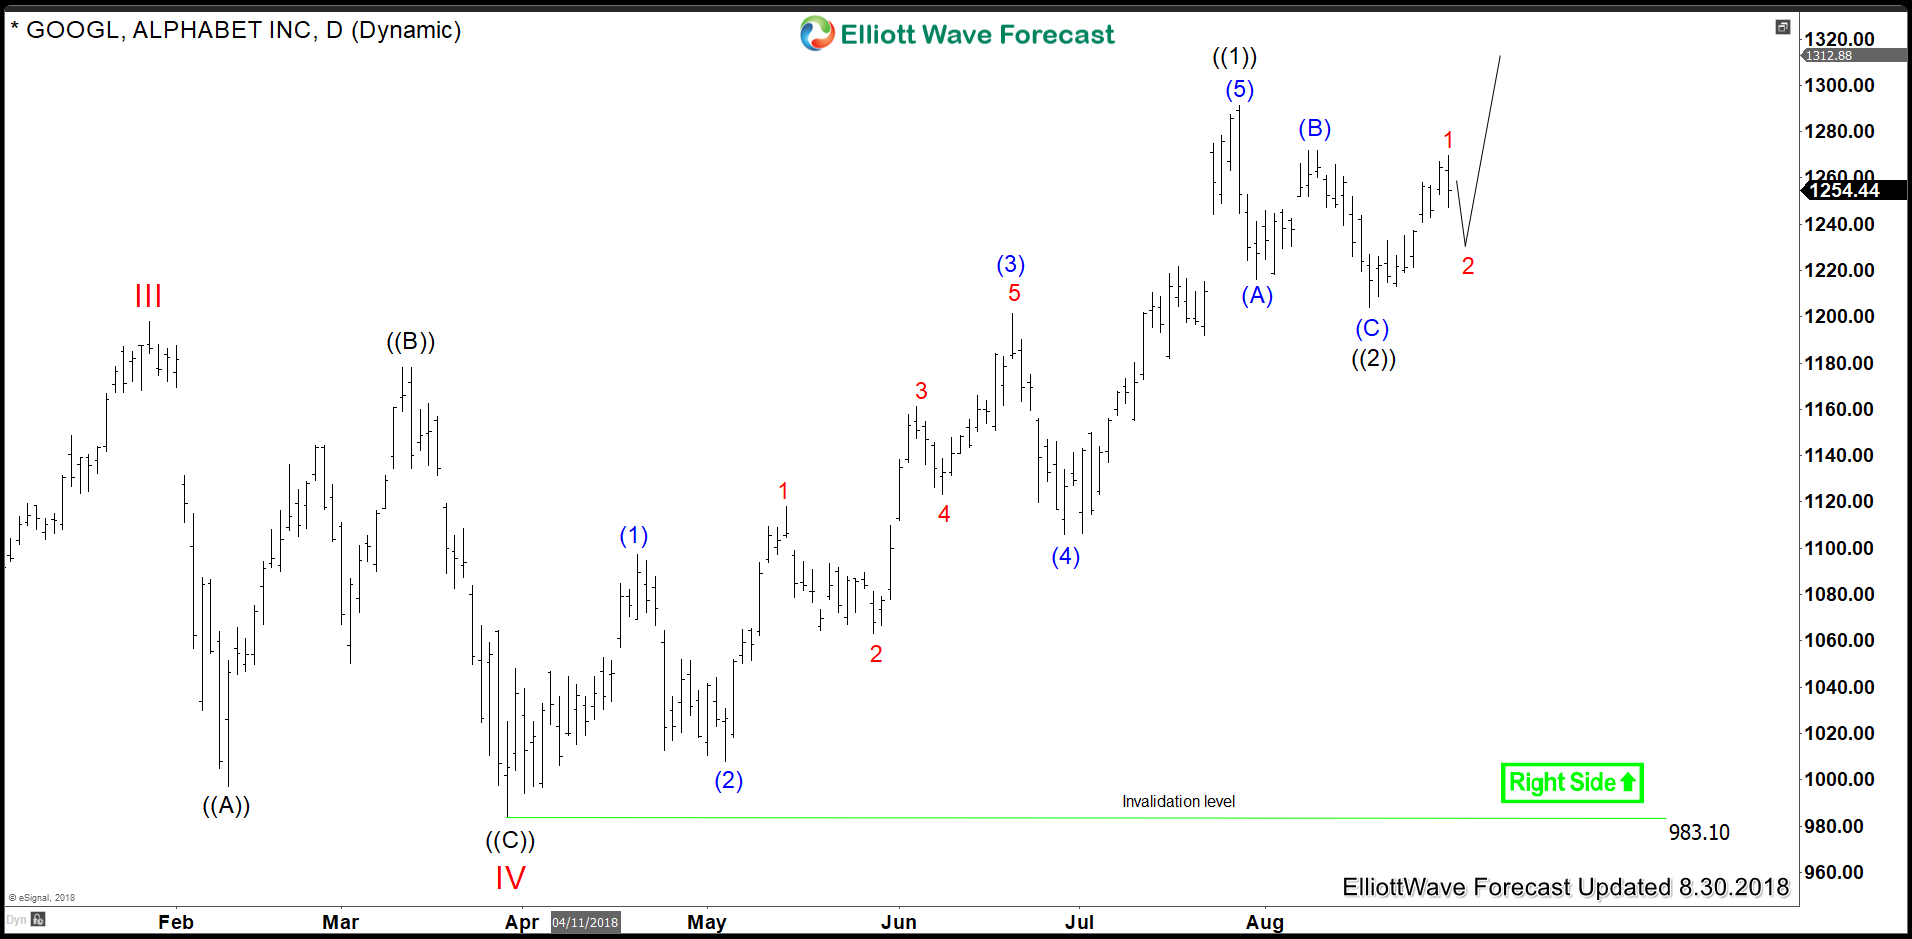
Google rallied in an impulsive 5 waves structure since March 2018 low $983 and managed to make new all time highs which technically can be enough for end the wave V. However, we don’t rely only on Elliott Wave for our forecast as we believe in the One market concept which is suggesting more bullishness in US stock market. Therefore, we are anticipating an extended wave V for GOOGL which means that the stock only ended the first leg as wave ((1)) and while pullbacks remain above $983 low it’s expected to resume the rally higher and keep finding buyers in 3 , 7 or 11 swings.
GOOGL Daily Chart 8.30.2018
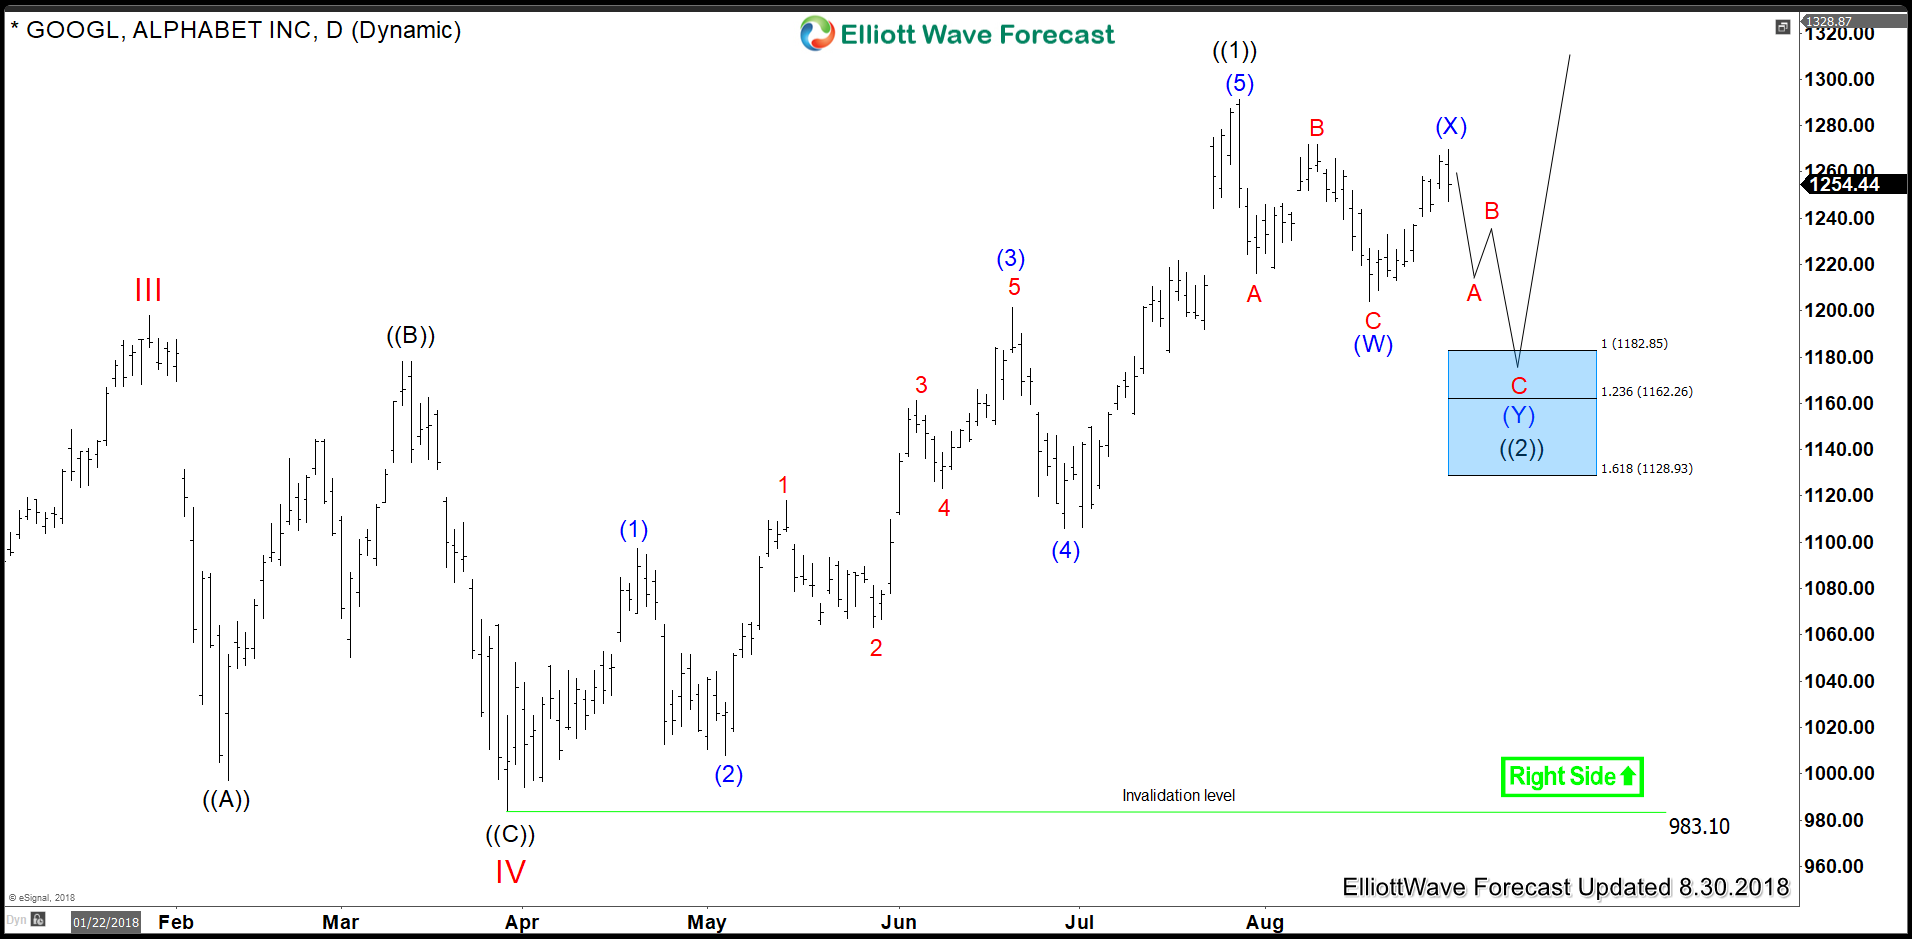
GOOGL technically already did 3 waves pullback which is enough to start a new cycle to the upside. But as long as it doesn’t break the previous July peak, then the stock still has the potential of doing the double correction toward the equal legs area $1182 – $1128 which will present a good buying opportunity for 3 waves bounce at least.
GOOGL Daily Chart (Double Correction )
Recap
Google one of the strongest technology stocks with a market cap nearing 1 Trillion has an impulsive structure still suggesting further gains for the stock as long as pullbacks remain above $983 low.
Get more insights about the Technology Sector and it’s related stocks by trying out our services 14 days to learn how to trade our blue boxes using the 3, 7 or 11 swings sequence. You will get access to our 78 instruments updated in 4 different time frames, Live Trading & Analysis Session done by our Expert Analysts every day, 24-hour chat room support and much more.
Back


