Snowflake Inc. is a cloud computing–based data warehousing company based in Bozeman, Montana. The firm offers a cloud-based data storage and analytics service, generally termed “data warehouse-as-a-service”. It allows corporate users to store and analyze data using cloud-based hardware and software. It runs on Amazon S3 since 2014, on Microsoft Azure since 2018 and on the Google Cloud Platform since 2019. The company was ranked first on the Forbes Cloud 100 in 2019. The company’s initial public offering raised $3.4 billion, the largest software IPO in history.
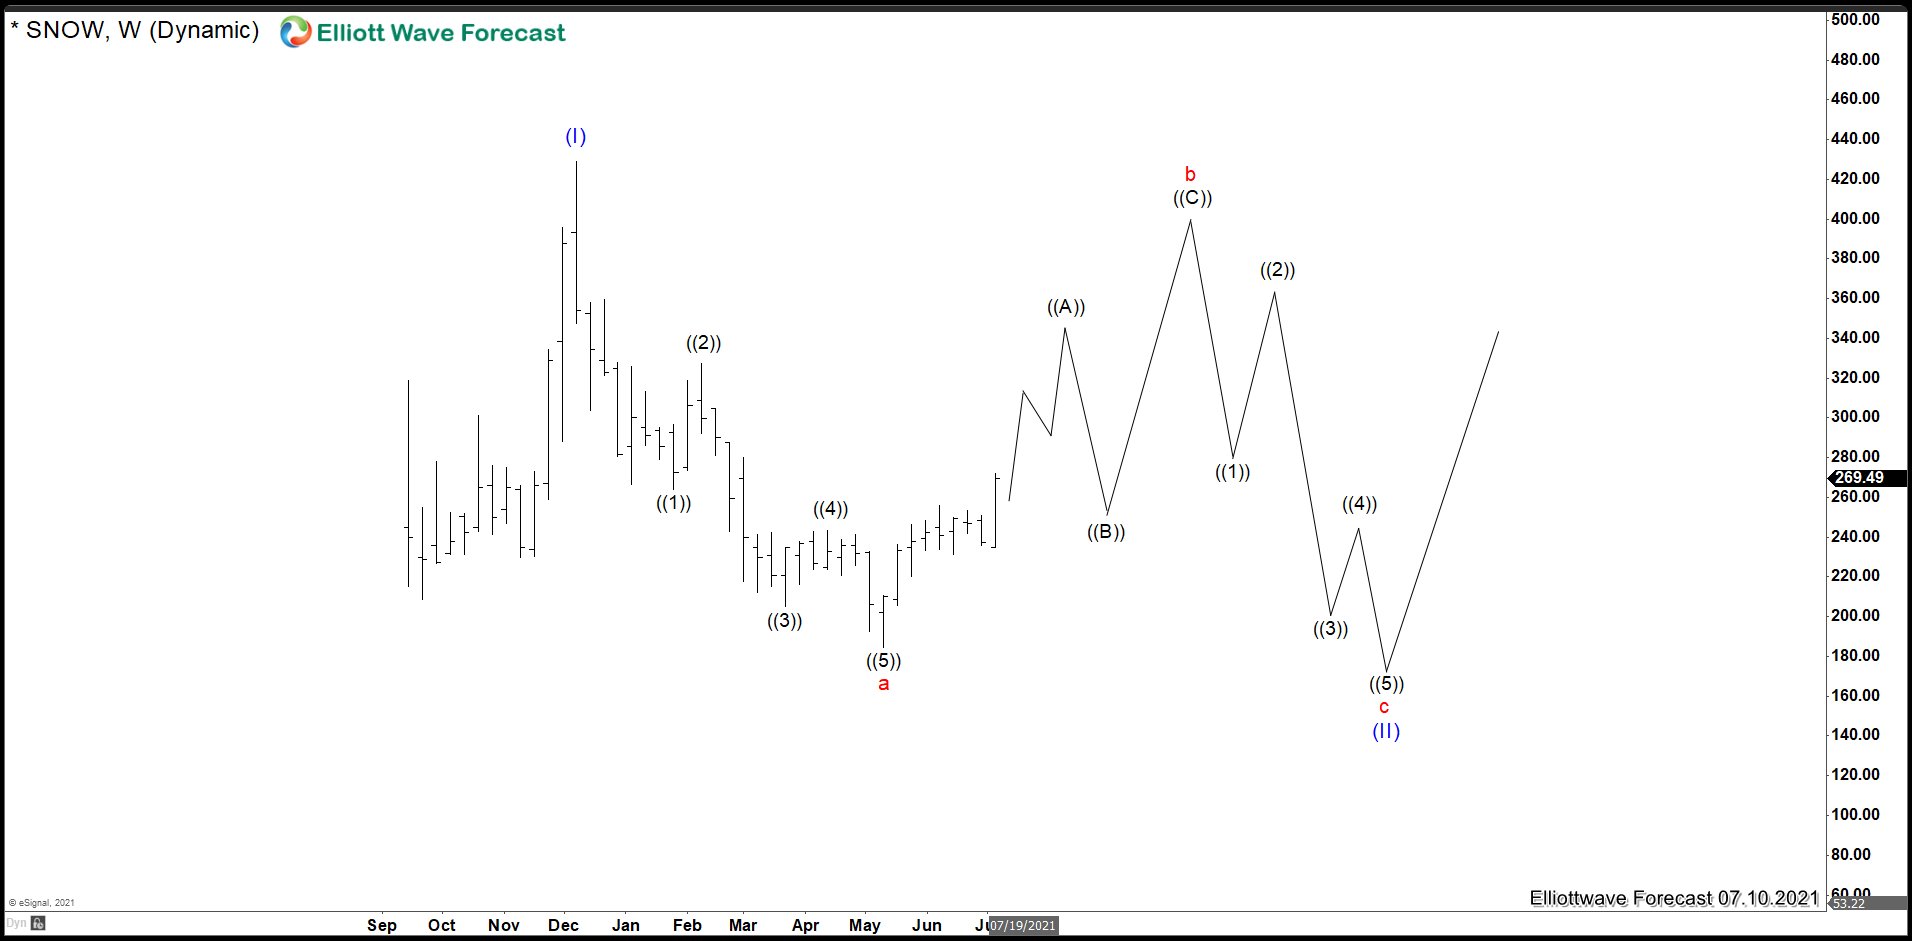
SNOW Weekly Chart July 2021
In the chart above, you could see SNOW stock which we forecast looking more downside after a nice rally without breaking the peak of wave (I). This decision was taken because the first bearish structure as wave red “a” it was a clear impulse, meaning that SNOW should break the low of wave “a” to complete a correction structure as wave (II). At that time, the market conditions were good that is why we suggested a strong rally before continuing lower.
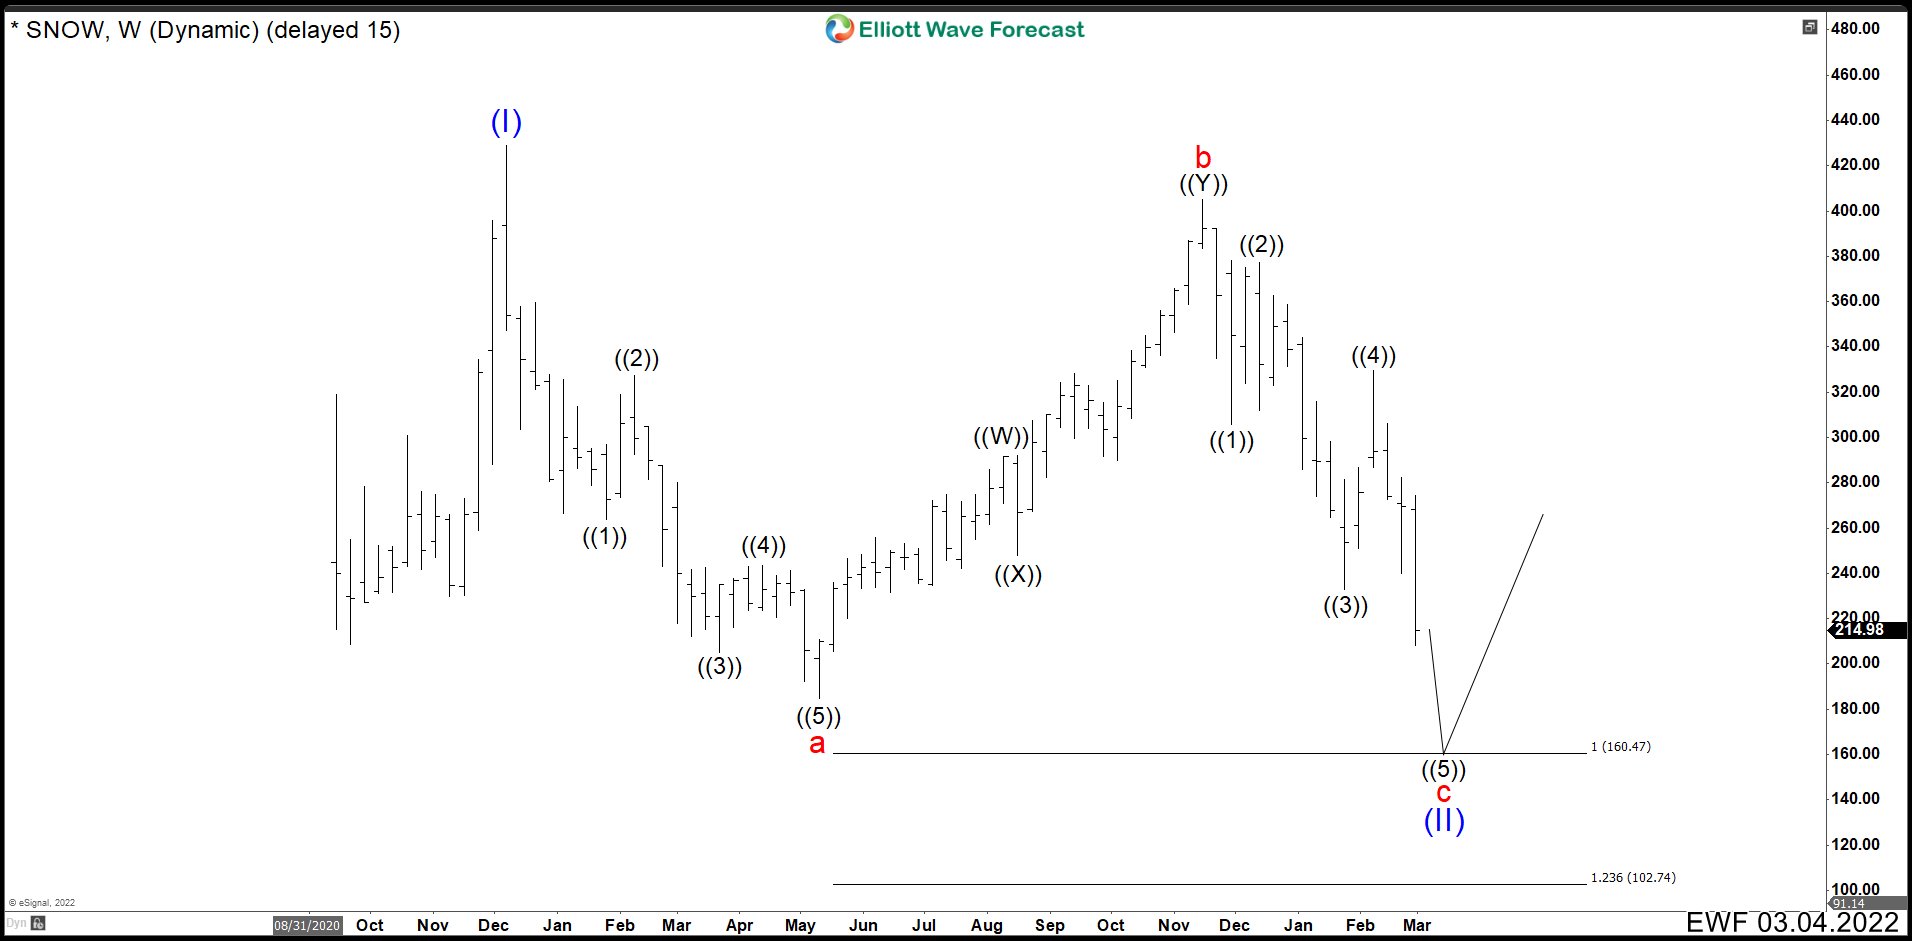
SNOW Weekly Chart March 2022
This is the actual SNOW chart after 8 months. You could appreciate the rally without breaking wave (I) and a strong drop perfectly as expected. To end the fractal, we need 5 waves down from wave red “b” peak that we made already, but we are looking and extension in wave ((5)) to reach the ideal minimum target of the 100% Fibonacci expansion.
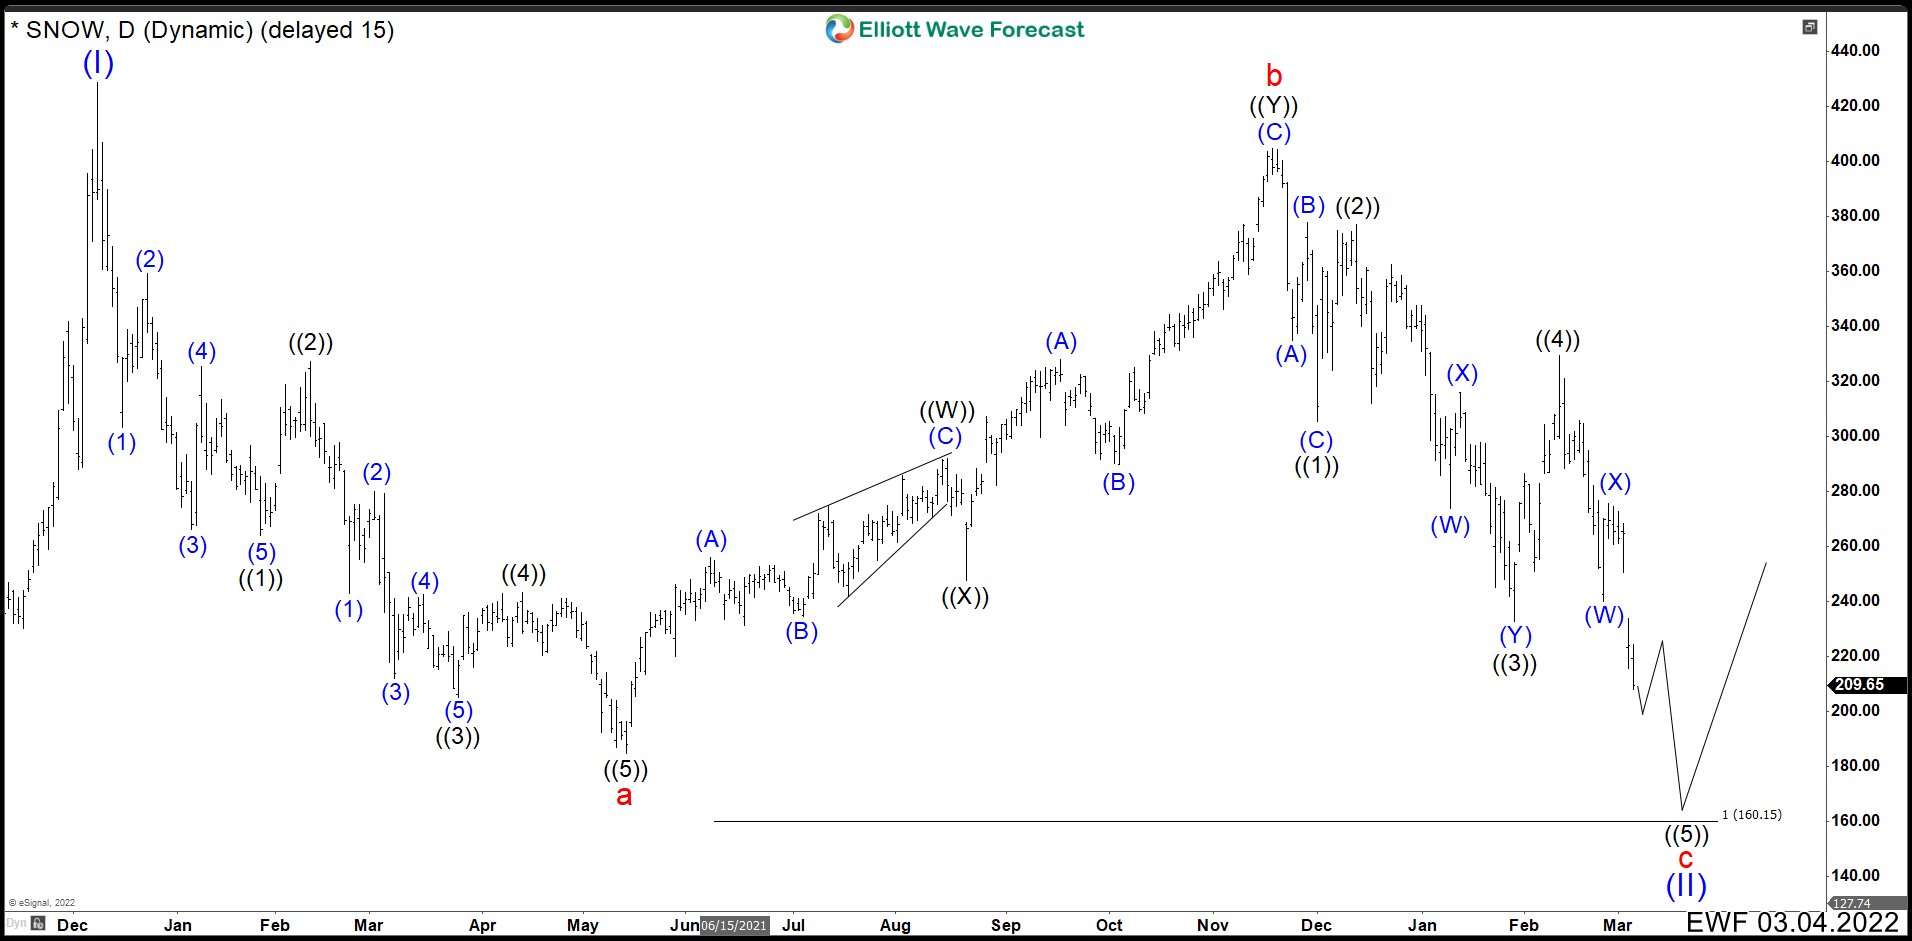
SNOW Daily Chart March 2022
Last drop is making an ending diagonal structure as wave ((4)) overlaps wave ((1)). (If you want to learn more about Elliott Wave Theory, follow these links: Elliott Wave Education and Elliott Wave Theory). Also we divide each wave in 3 swings, then last wave ((5)) must have 3 swings to be completed. Inclusive the last structure could look more corrective than we show it in the chart. In any case, SNOW should continue lower below 160.50 level where you could look to buy the stock. The main idea is to break 184.71, but Elliott Theory allows corrections without breaking last low as wave red “a”. Therefore, 5 waves down without breaking 184.71 is good, but you need to recognize the correct structure for that.
Elliottwave Forecast updates one-hour charts 4 times a day and 4-hour charts once a day for all our 78 instruments. We do a daily live session where we guide our clients on the right side of the market. In addition, we have a chat room where our moderators will help you with any questions you have about what is happening in the market. Let’s trial 14 days for only $9.99 here: I want 14 days trial. Cancel Anytime.
Back


