GameStop is a video game chain stores and merchandising that has made headlines for a few days due to a dramatic rise experienced by its shares on the stock exchange.
The company lost business over the years. Players prefer to buy the games on internet or play online, and consequently the value of the shares dropped. But the price of stocks also fell for another reason: some high investment funds bet that the value of GameStop’s shares would fall.
Following the rise of GameStop shares are private investors grouped into Reddit’s WallStreetBets forum, where users share memes, gifs and also, in some cases, investment tips. They realized that large investors were conducting short trades against GameStop and decided to take advantage of it to buy shares in the company. By investing in these stocks, the price started to rise very quickly.
In the end, GameStop’s share price soared: at the beginning of the year, its shares cost $17, while on Thursday, January 28, 2021, they reached $500. Investment funds that opted down by GameStop have accumulated large losses and, in some cases, have been forced to sell shares of other companies to cover them.
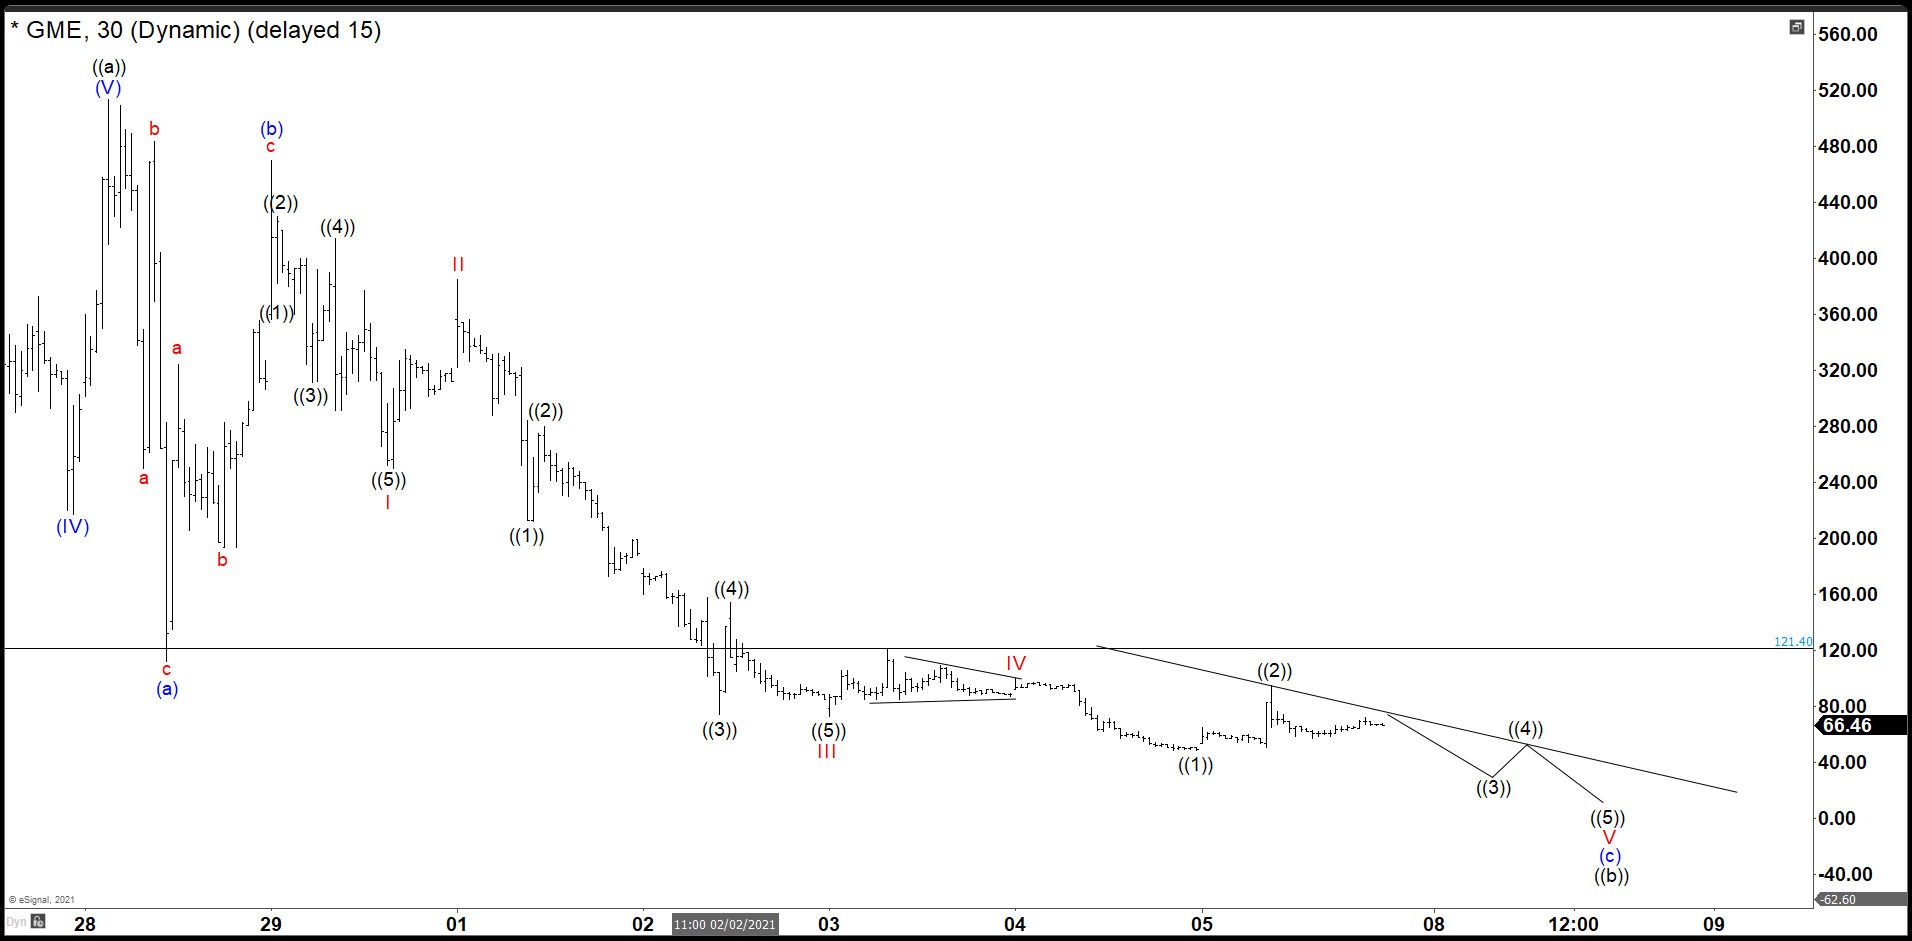
Forecasting GameStop using Elliott Wave t Elliott’s Wave Theory
The rally above $500 completed a Grand Super Cycle as wave ((a)) in a 5-wave structure. Wave (I) was the peak of 2007, wave (II) was the low of 2019, waves (III) and (IV) were on January 27, and wave (V), on 28, completing the cycle. In the 30 min Chart, we have a clear 3-3-5 corrective flat structure, waves (a), (b) and (c), where (c) must end as an impulse. (If you want to learn more about Elliott Wave Theory, please follow this link: Elliott Wave Theory). We are currently building the last wave V of (c), which could continue to slowly decline in 3 swings until the GameStop company files for bankruptcy. For this view the price of the stock must remain below $121.40. If we see another spike, this must stay below wave ((a)) peak and then continue with the downside movement.
In Elliottwave Forecast we update one-hour charts 4 times a day and 4-hour charts once a day for all our 78 instruments. We do a daily live session where we guide our clients on the right side of the market. In addition, we have a chat room where our moderators will help you with any questions you have about what is happening in the market at the moment. Let’s trial for 14 days totally free here: I want 14 days of free trial.


