Coinbase Global, Inc., branded Coinbase (COIN), is an American company that operates a cryptocurrency exchange platform. Coinbase is a distributed company; all employees operate via remote work and the company lacks a physical headquarters. It is the largest cryptocurrency exchange in the United States by trading volume. The company was founded in 2012 by Brian Armstrong and Fred Ehrsam.
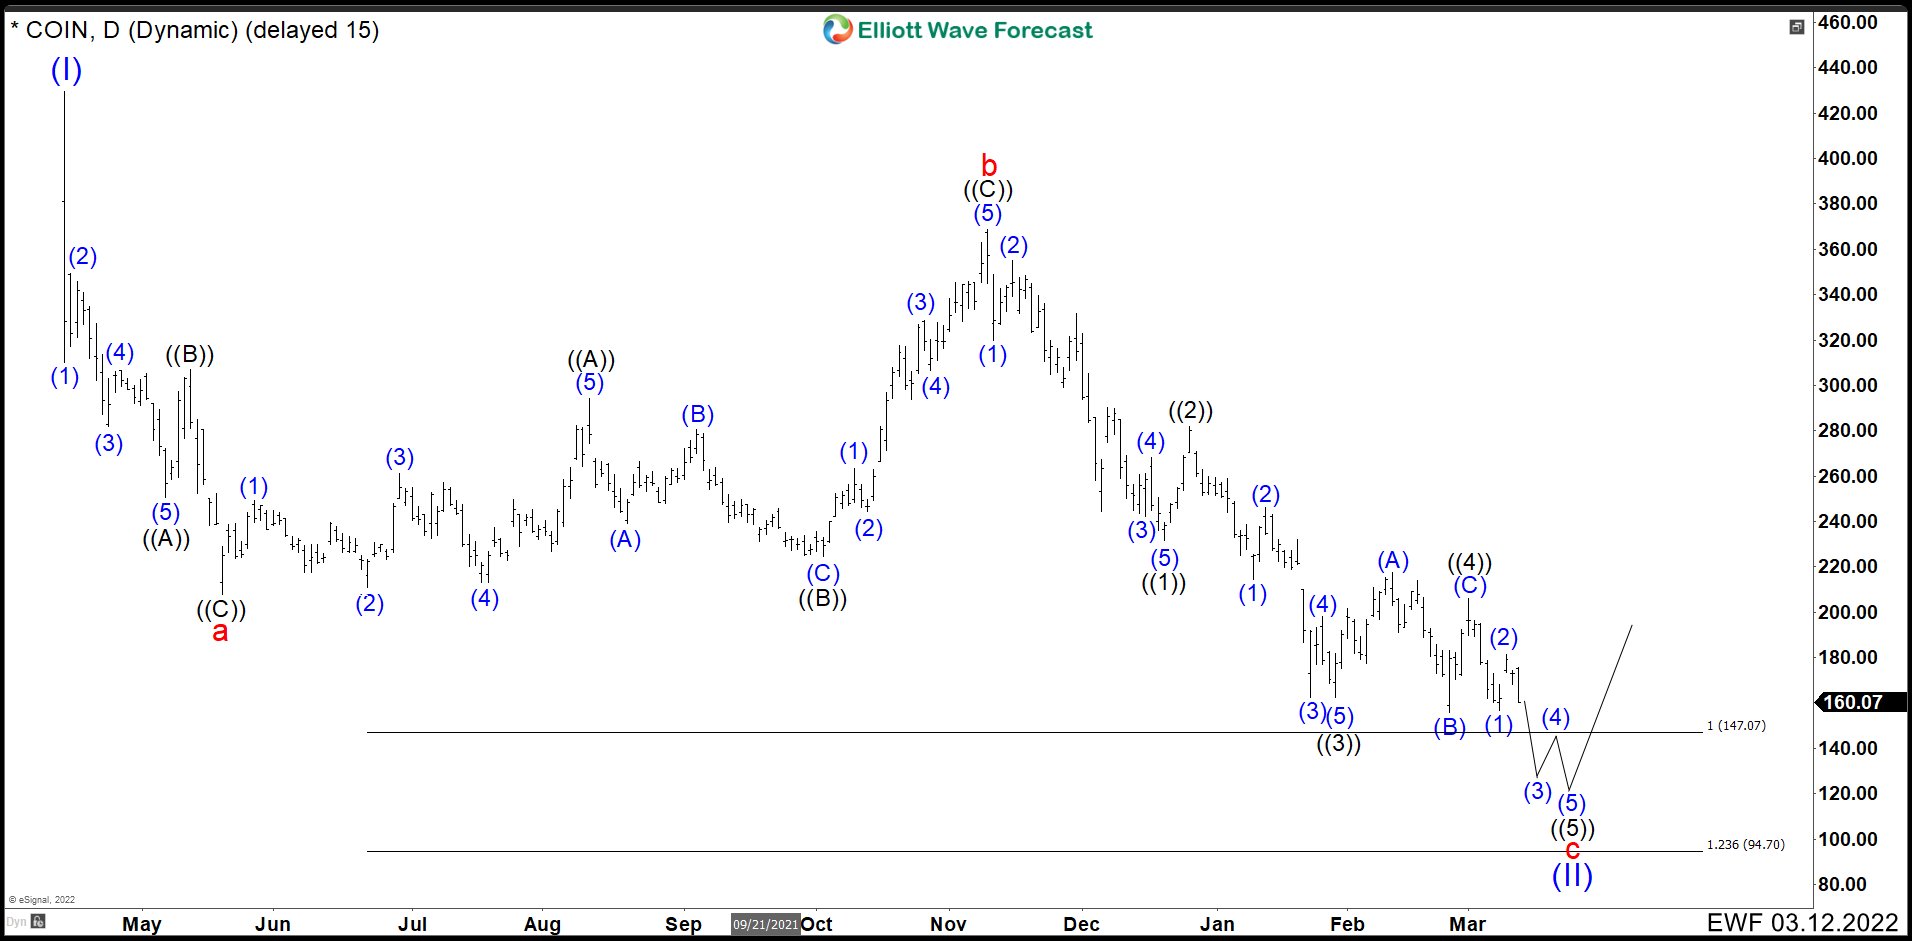
COIN Daily Chart March 2022
Last 2 months we built in COIN a flat structure “a”, “b” and “c” from the peak to forecast a possible ending for wave (II). We were expecting the level of 94.70 as a bottom and then continue with the rally. Later, the stock made a bounce that damaged the proposed wave ((5)) of c. The new structure for time and value it is more likely to think that is a connector for a double correction from wave “b”. (If you want to learn more about Elliott Wave Theory, follow these links: Elliott Wave Education and Elliott Wave Theory).
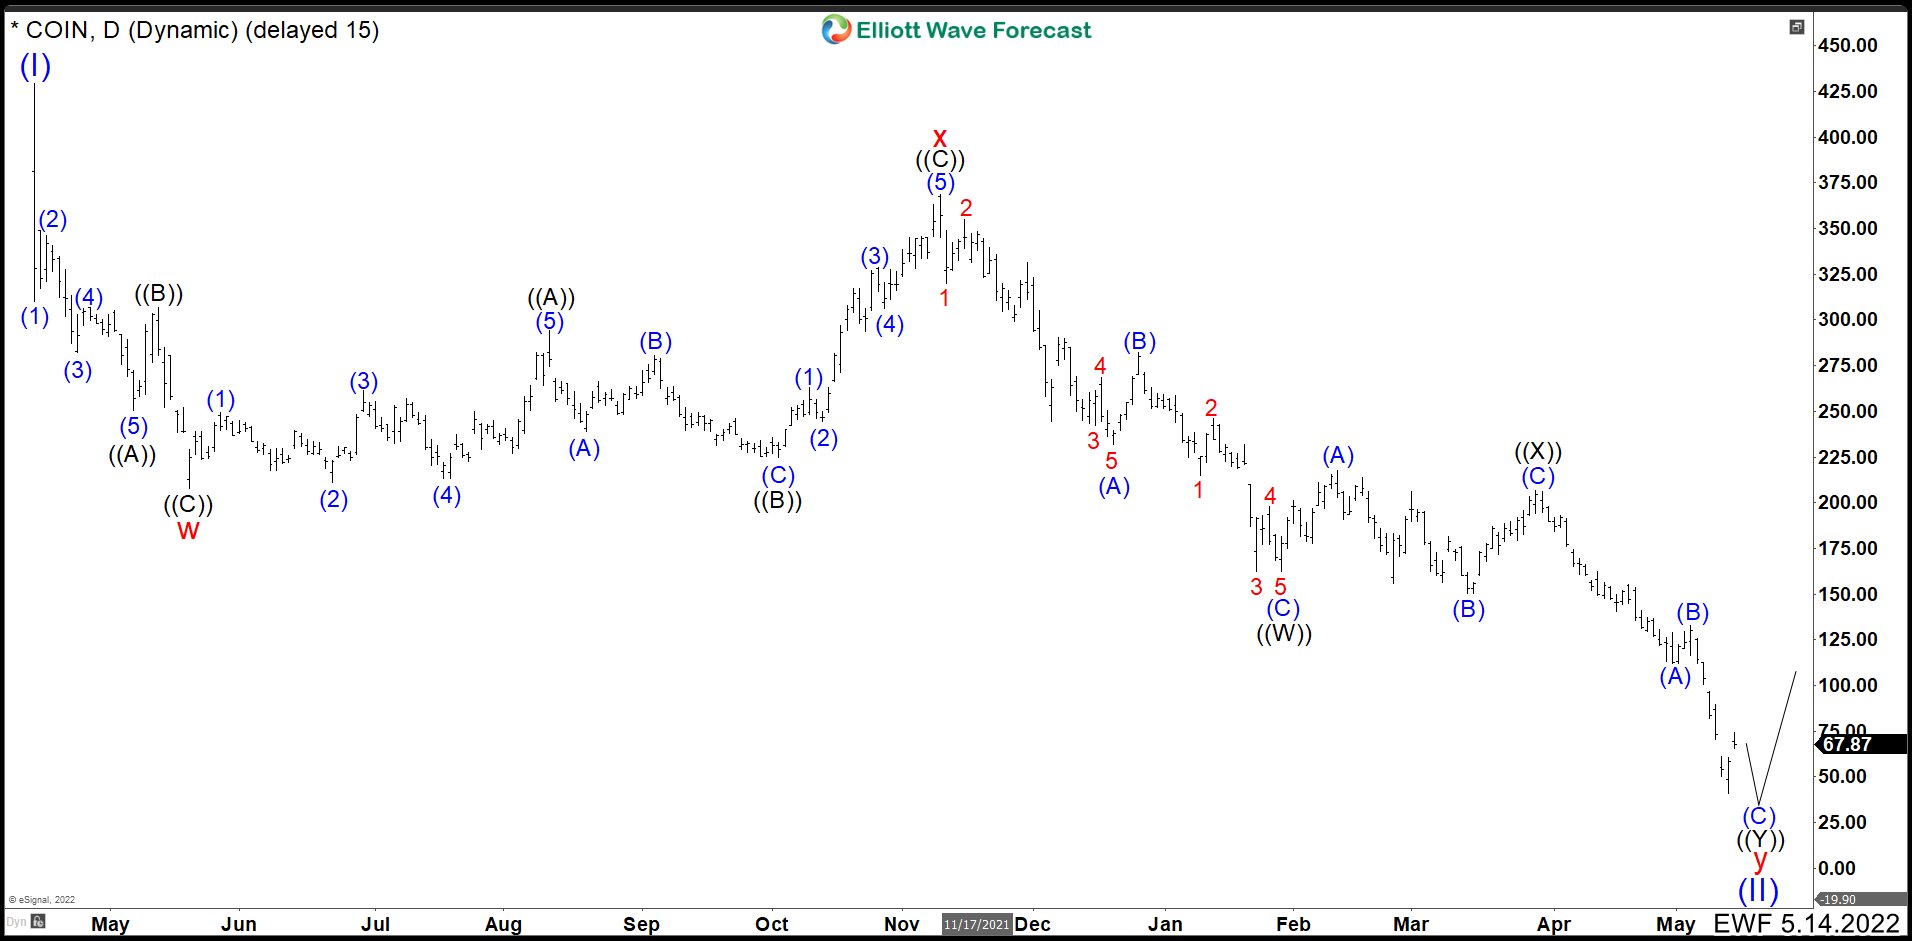
COIN Daily Chart May 2022
We labeled again COIN, but now as a double correction w, x, y in red. Wave y is a 7 swings sequence that could end wave (II) pullback and the stock would be ready to resume the rally. Down from the peak of wave x, market made a impulse ending wave (A) at 231.77. Then bounce as wave (B) that finished at 281.99 and resume to the downside with another impulse to finish wave (C) and ((W)) at 162.20. After this, an irregular flat took place as a connector and wave ((X)) completed at 206.79. Market continued dropping in 3 swings and we are looking to complete wave ((Y)) of y of (II).
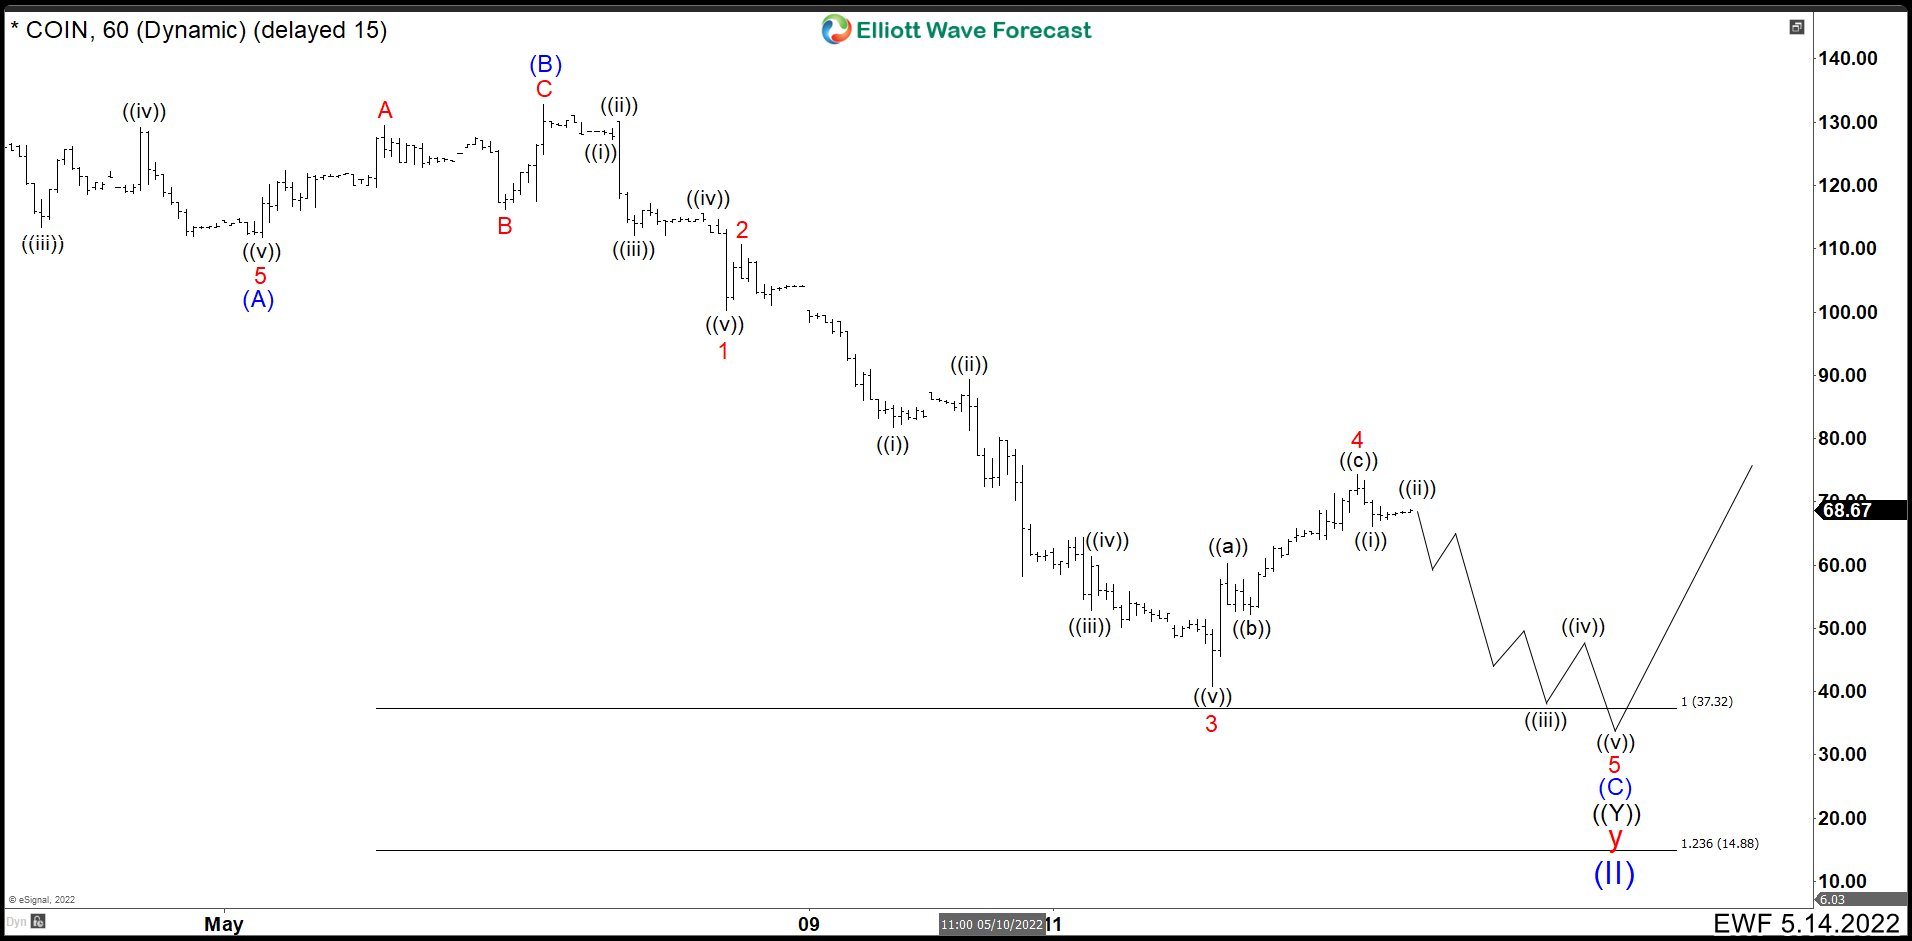
COIN 1 Hour Chart May 2022
Wave (A) of wave ((Y)) down ended at 111.80. Then COIN made a little bounce to end wave (B) at 132.81. From this level, we are looking to develop an impulse to complete wave (C) and the whole correction as wave (II). The wave 1 ended at 100.25 and wave 2 completed at 110.60. Market resumed the downtrend ending wave 3 at 40.83 and actually wave 4 rally could be done at 74.25. We cannot rule out a shy move to the upside to complete wave 4 before turning bearish again. In the last leg lower, we should see an impulse to complete the cycle. As minimum target we has marked 100% Fibonacci extension at 37.32 and as the worse case 123.6% Fibonacci extension at 14.88. Only a break of 100.00 from current levels we should call the bottom in and any pullback will be a buying opportunity.
This structure may be telling us that the cryptocurrencies should continue to fall and when COIN finds its low around 37.32 the cryptocurrencies could also start a new rally. Likewise, if COIN reached levels around 100.00, the cryptocurrencies could have their bottoms and any correction would be a good buying opportunity.
Elliottwave Forecast updates one-hour charts 4 times a day and 4-hour charts once a day for all our 78 instruments. We do a daily live session where we guide our clients on the right side of the market. In addition, we have a chat room where our moderators will help you with any questions you have about what is happening in the market.
Let’s trial 14 days for only $9.99 here: I want 14 days trial. Cancel Anytime.
Back


