Hello fellow traders. In today’s blog, we will have a look at the CME stock. The stock is listed in the Eurostoxx SPX 500.
The CME Group is an abbreviation and stands for the Chicago Mercantile Exchange, which is a global market company. While holding the largets derivatives and options exchanges in Chicago. the CME group offers a wide range of benchmark products across all major asset classes. Wich includes indices, forex but also energy and much more.
Now, let’s have a look at the daily chart and the technical outlook for the company.
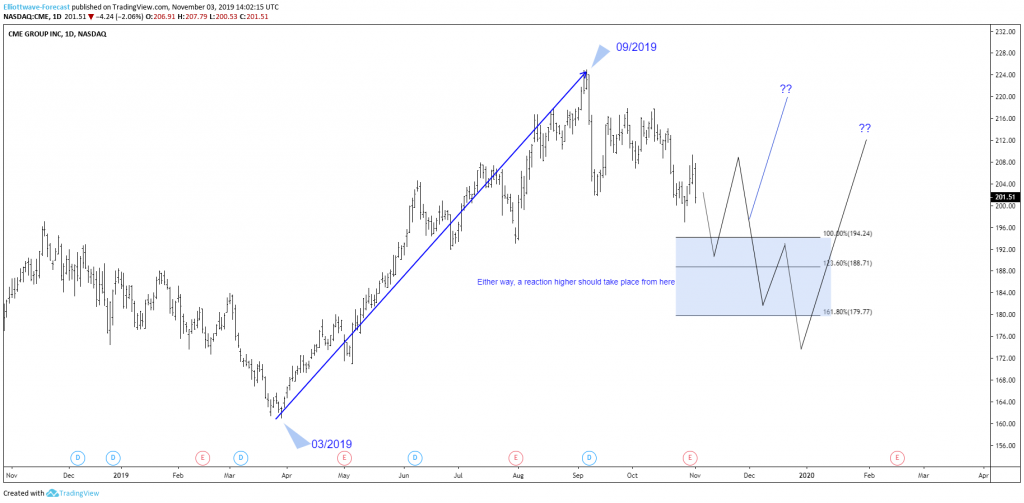
CME Group 11.3.2019 Daily Chart
In the chart above you can see that the stock ended the cycle from 03/2019 low at the all-time seen on the 09/2019 peak. Below from there, it has been correcting the cycle from 03/2019 low. At this stage it is still missing the equal legs towards 194.24-188.71 area With that said, the stock has a short-term incomplete sequence from 09/2019 peak indicating more downside in the short-term. At this stage, I am looking for 2 possible scenarios. The first one is showing the reaction higher from the blue box ending 3 swings and continuing higher. The second possibility is a reaction higher from the blue box and a 7 swing lower before continuation higher. Either way, if it reaches 194.24-188.71 we should see a reaction higher either new highs or 7 swings lower before higher again. Let’s see.
We believe in cycles, distribution, and many other tools in addition to the classic or new Elliott wave Principle. To get a regular update on the market and Elliott wave charts in 4-time frames. And the best thing is you can join us for a 14 days FREE trial to see whether our service suits you.
If you enjoy this article, check our work and join HERE to see Elliott Wave Forecast in 4-time frames for 78 instruments as well as getting access to Live Trading Room, Live Session, and more.
Back


