Citigroup (NYSE:C) is the 3rd largest bank in the United States. Since the crash of 2008, its stock wasn’t able to recover 15% of that decline compared to other Banks like JP Morgan or Goldman Sachs. 2018 wasn’t a good year for the entire market and Citigroup wasn’t any different as its stock price is currently down 26% year-to-date.
Many investors are currently afraid of catching the falling knife as they are focusing on the short term perspective. However, if we focus on the right cycle and sequence with the help of the Elliott Wave Theory we can understand that with every drop comes opportunities in specific areas that can be used for investing or trading.
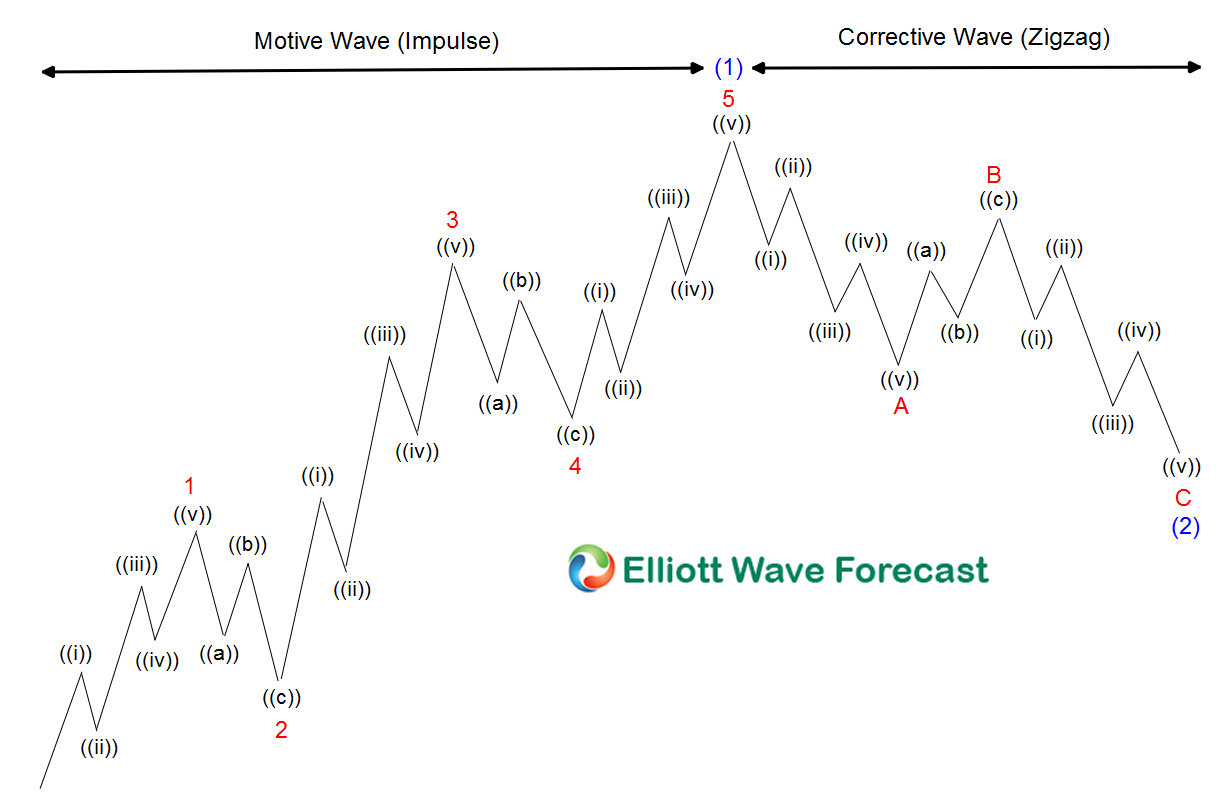
The market nature & the Elliott Wave Theory states that an impulsive 5 waves advance is followed by a corrective 3 waves lower which is represented in the above graphic for reference. After the 3 waves pullback, the market can resume the move within the previous main cycle in 9 or 13 swings higher or the bounce can fail for the instrument to continue the correction lower in 7 or 11 swings.
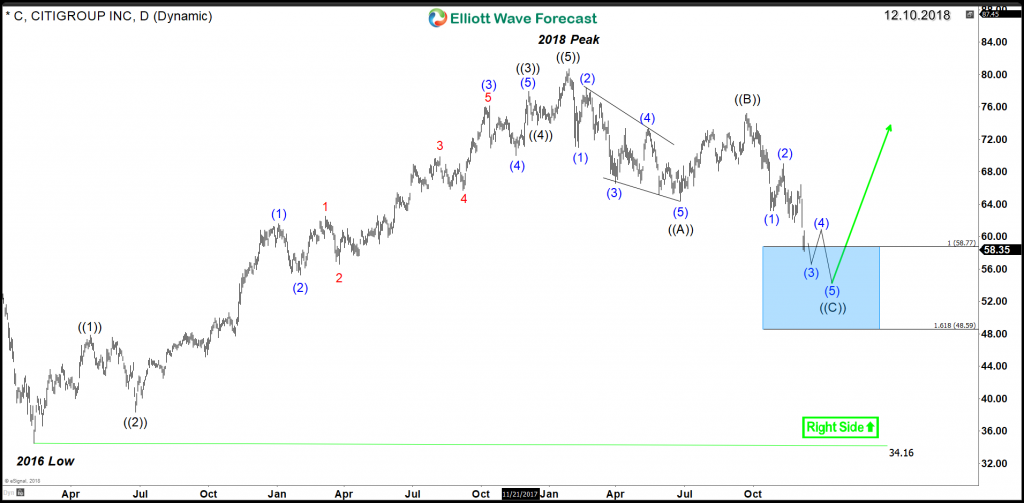
The Following chart show Citigroup price action with the representation of the 5 waves advance and now 3 waves pullback.
Citigroup Daily Chart
The highlighted blue box in the chart above represents the calculated target for the corrective structure taking place and entering the range of $58.77 – $48.59. It is the area in which the 3 wave regression lower can be ending. Therefore, bulls are expected to show up for a Long opportunity either to resume the previous bullish cycle from 2016 low or produce at least a 3 waves bounce. should see a bounce higher and also now is the time to expect the Fundamental analysis to align with the aforementioned brief primer on the technical.
We use these extreme areas to look for inflection points in terms of price reaction or to reverse a prior trend, consequently Citigroup is expected to see a recovery in early 2019 after ending the current cycle from 2018 peak.
Get more insights about the Financial Sector and learn how to trade our blue boxes using the 3, 7 or 11 swings sequence by trying out our services 14 days . You will get access to our 78 instruments updated in 4 different time frames, Live Trading & Analysis Session done by our Expert Analysts every day, 24-hour chat room support and much more.
Back


