

The Power of 3-7-11 and the Grand Super Cycle: How We Saw the Bullish Turn in April 2025 Back on April 9, 2025, while World Indices were dropping sharply and global sentiment had turned overwhelmingly bearish, we published an article that challenged the fear-driven narrative. We explained why selling was not the right approach and […]
-
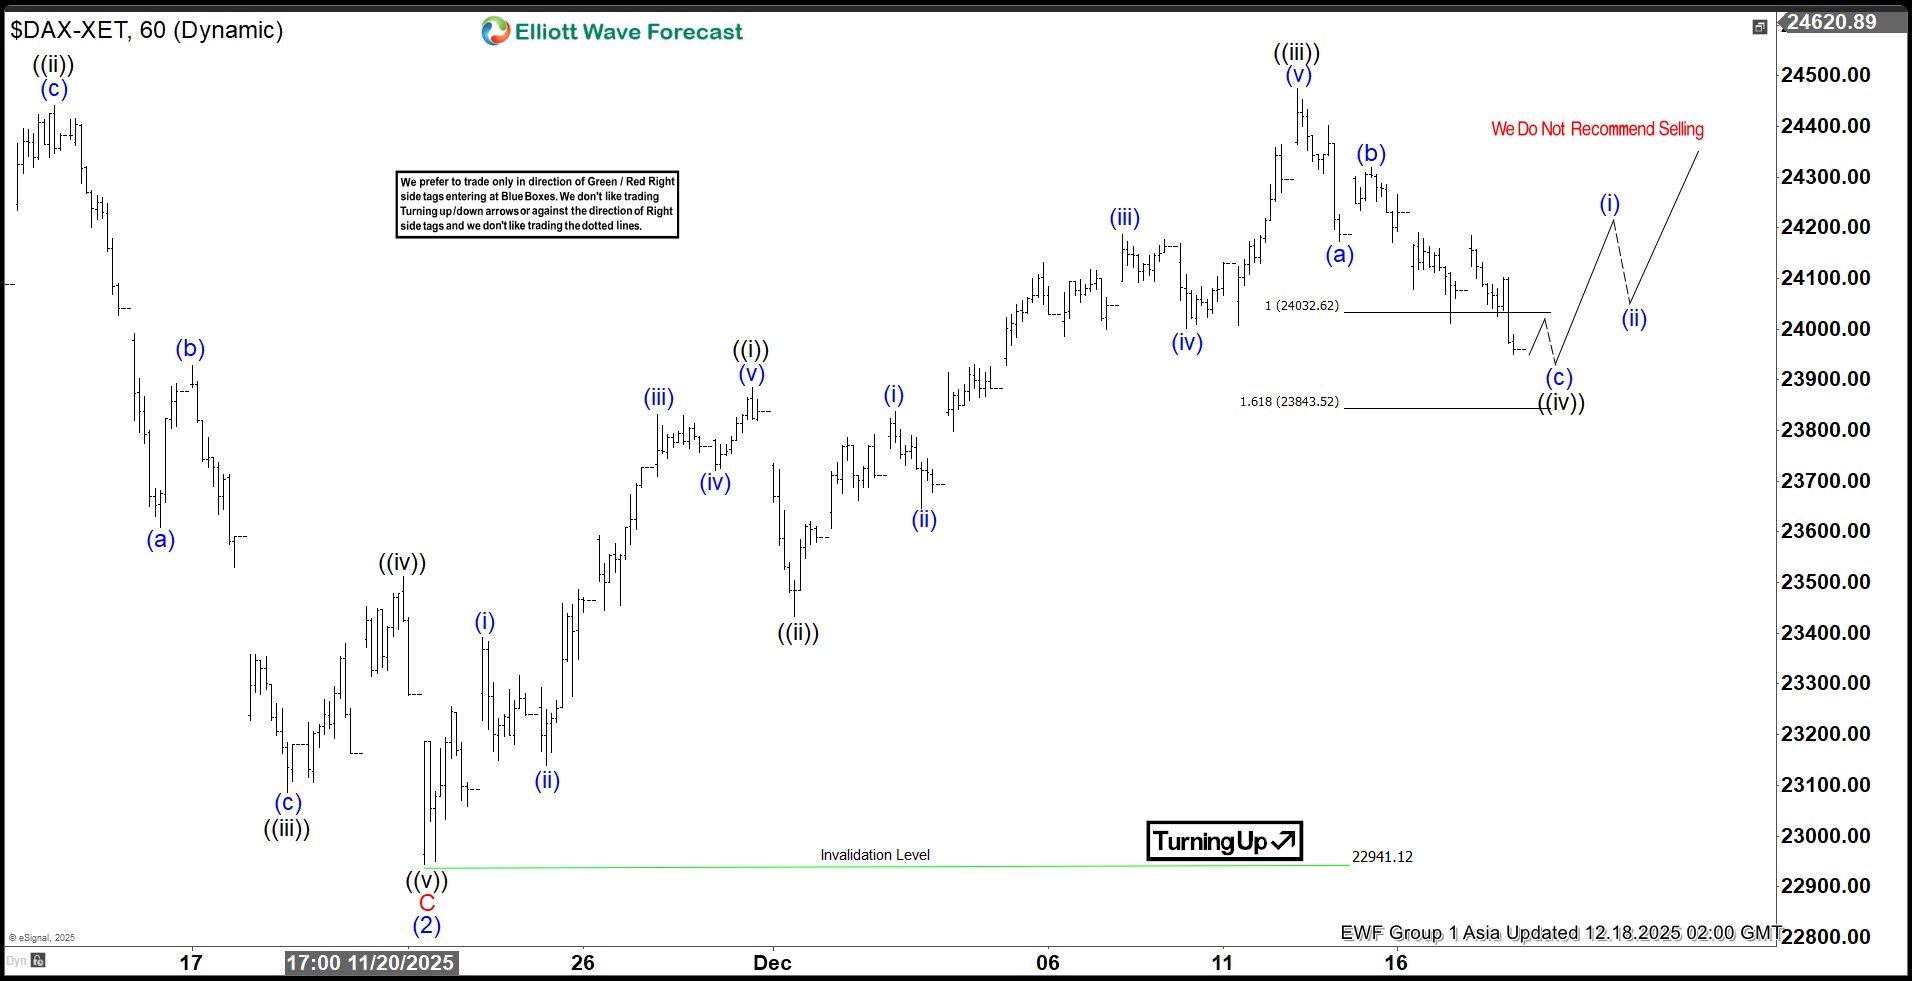
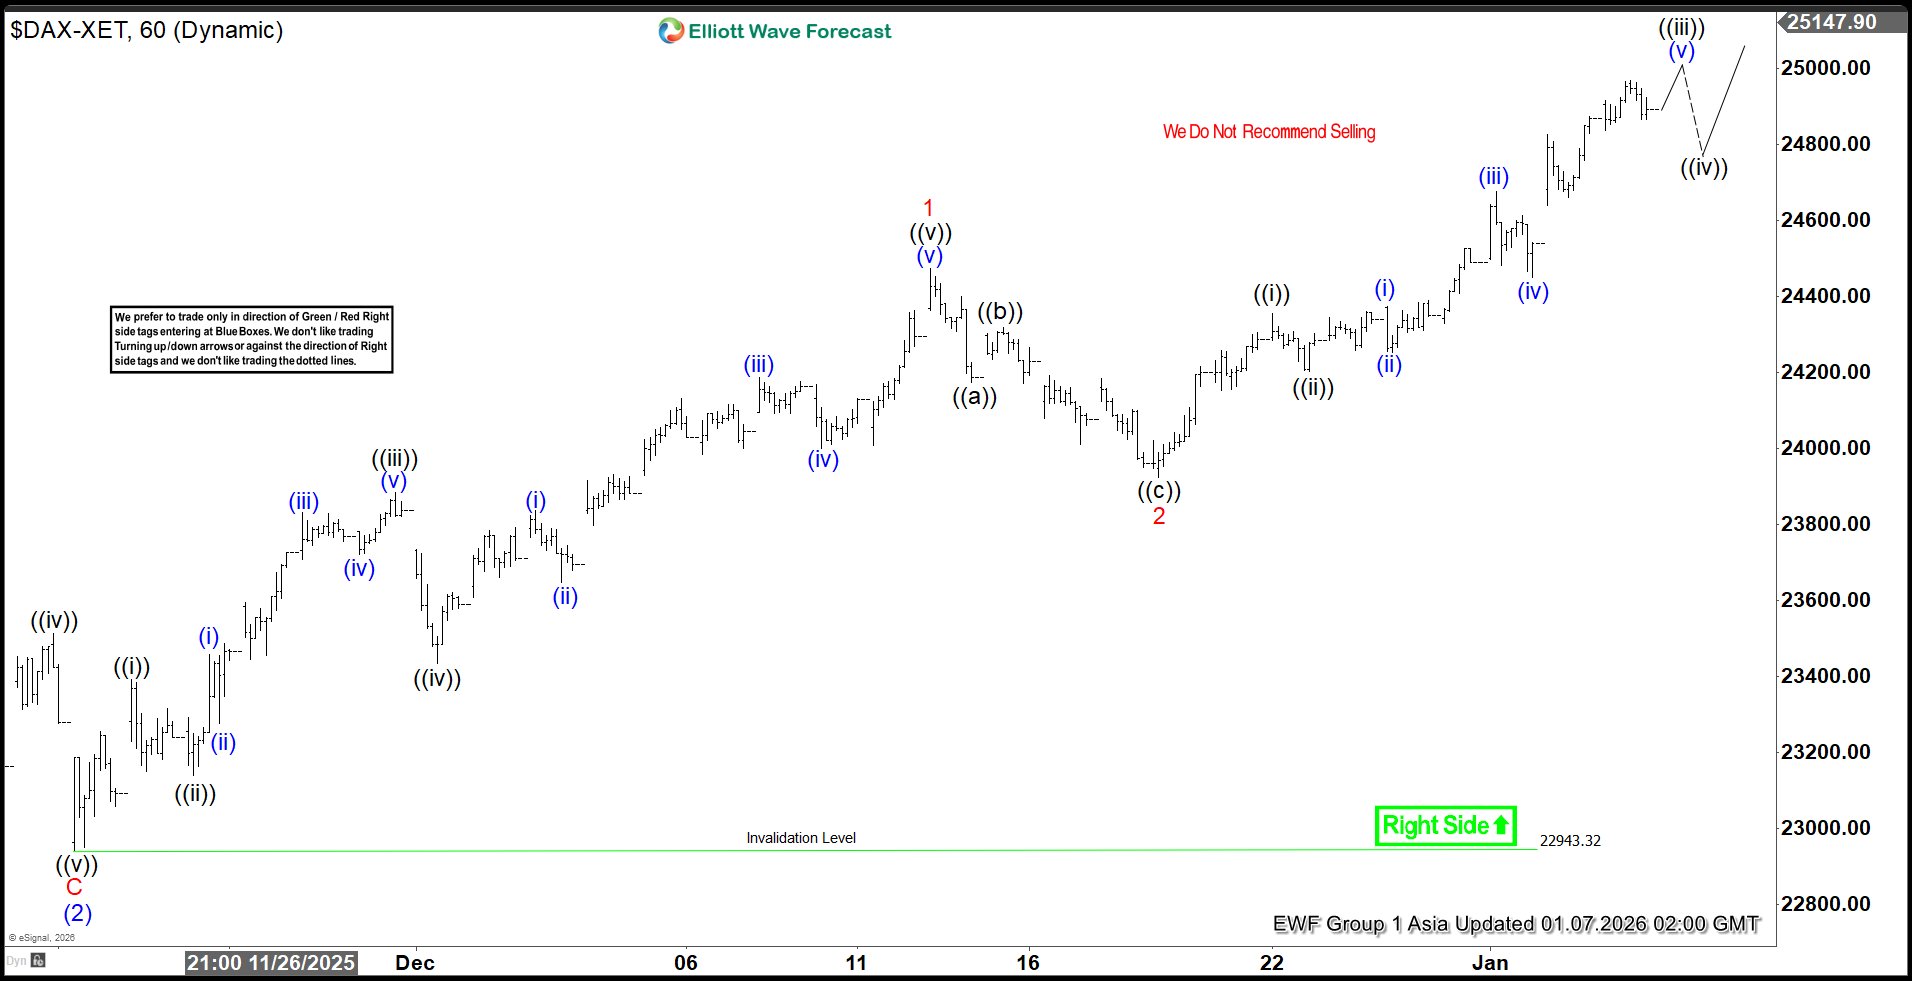
DAX Resumes Bullish Structure After Finding Support at the Equal Legs Zone
Read MoreHello fellow traders. In this article we’re going to take a quick look at the Elliott Wave charts of DAX index , published in the members area of the website. As our members know, DAX is showing impulsive bullish sequences in the cycle from the November’s 2025 low. Recently it pulled back and found buyers […]
-
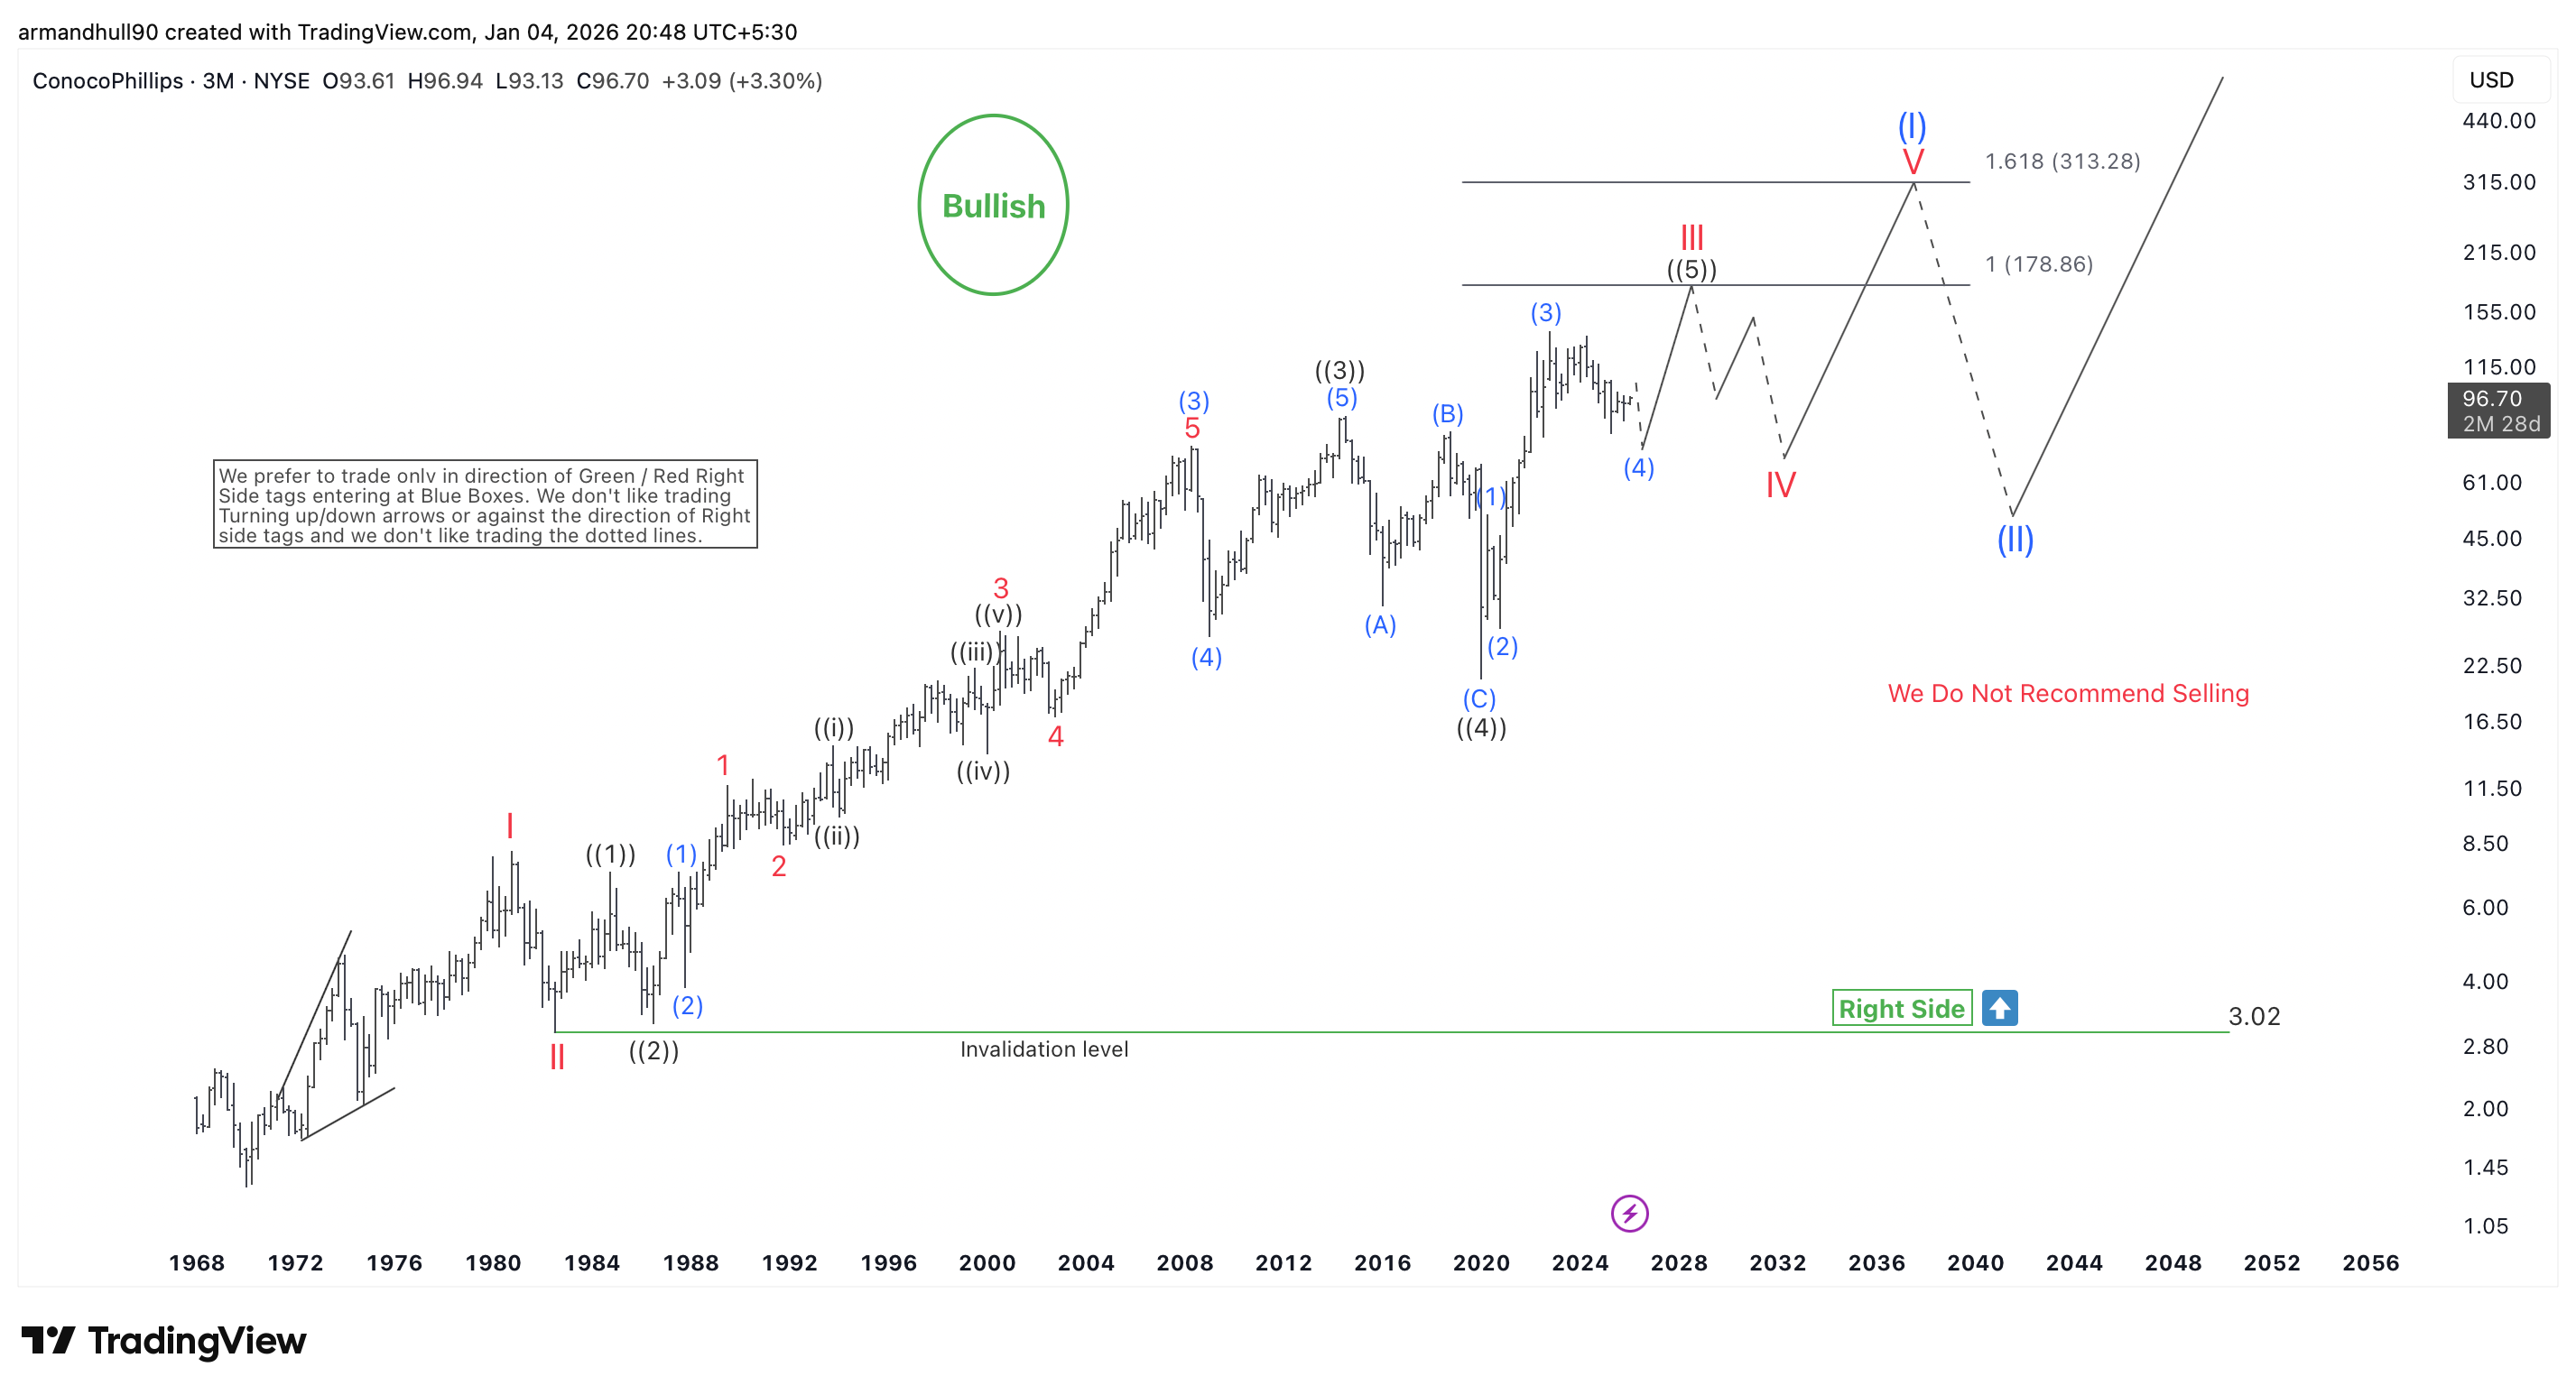
ConocoPhillips (COP) Elliott Wave Forecast: Bullish Trend Eyes $178–$313 Targets
Read MoreCOP Keeps Its Long-Term Bullish Elliott Wave Structure Intact, with Strong Upside Potential Toward Key Fibonacci Targets. ConocoPhillips continues to show a strong long-term bullish trend using Elliott Wave analysis. The quarterly chart shows a clear impulsive rally from historic lows. The Right Side tag stays bullish as long as price remains above the invalidation […]
-
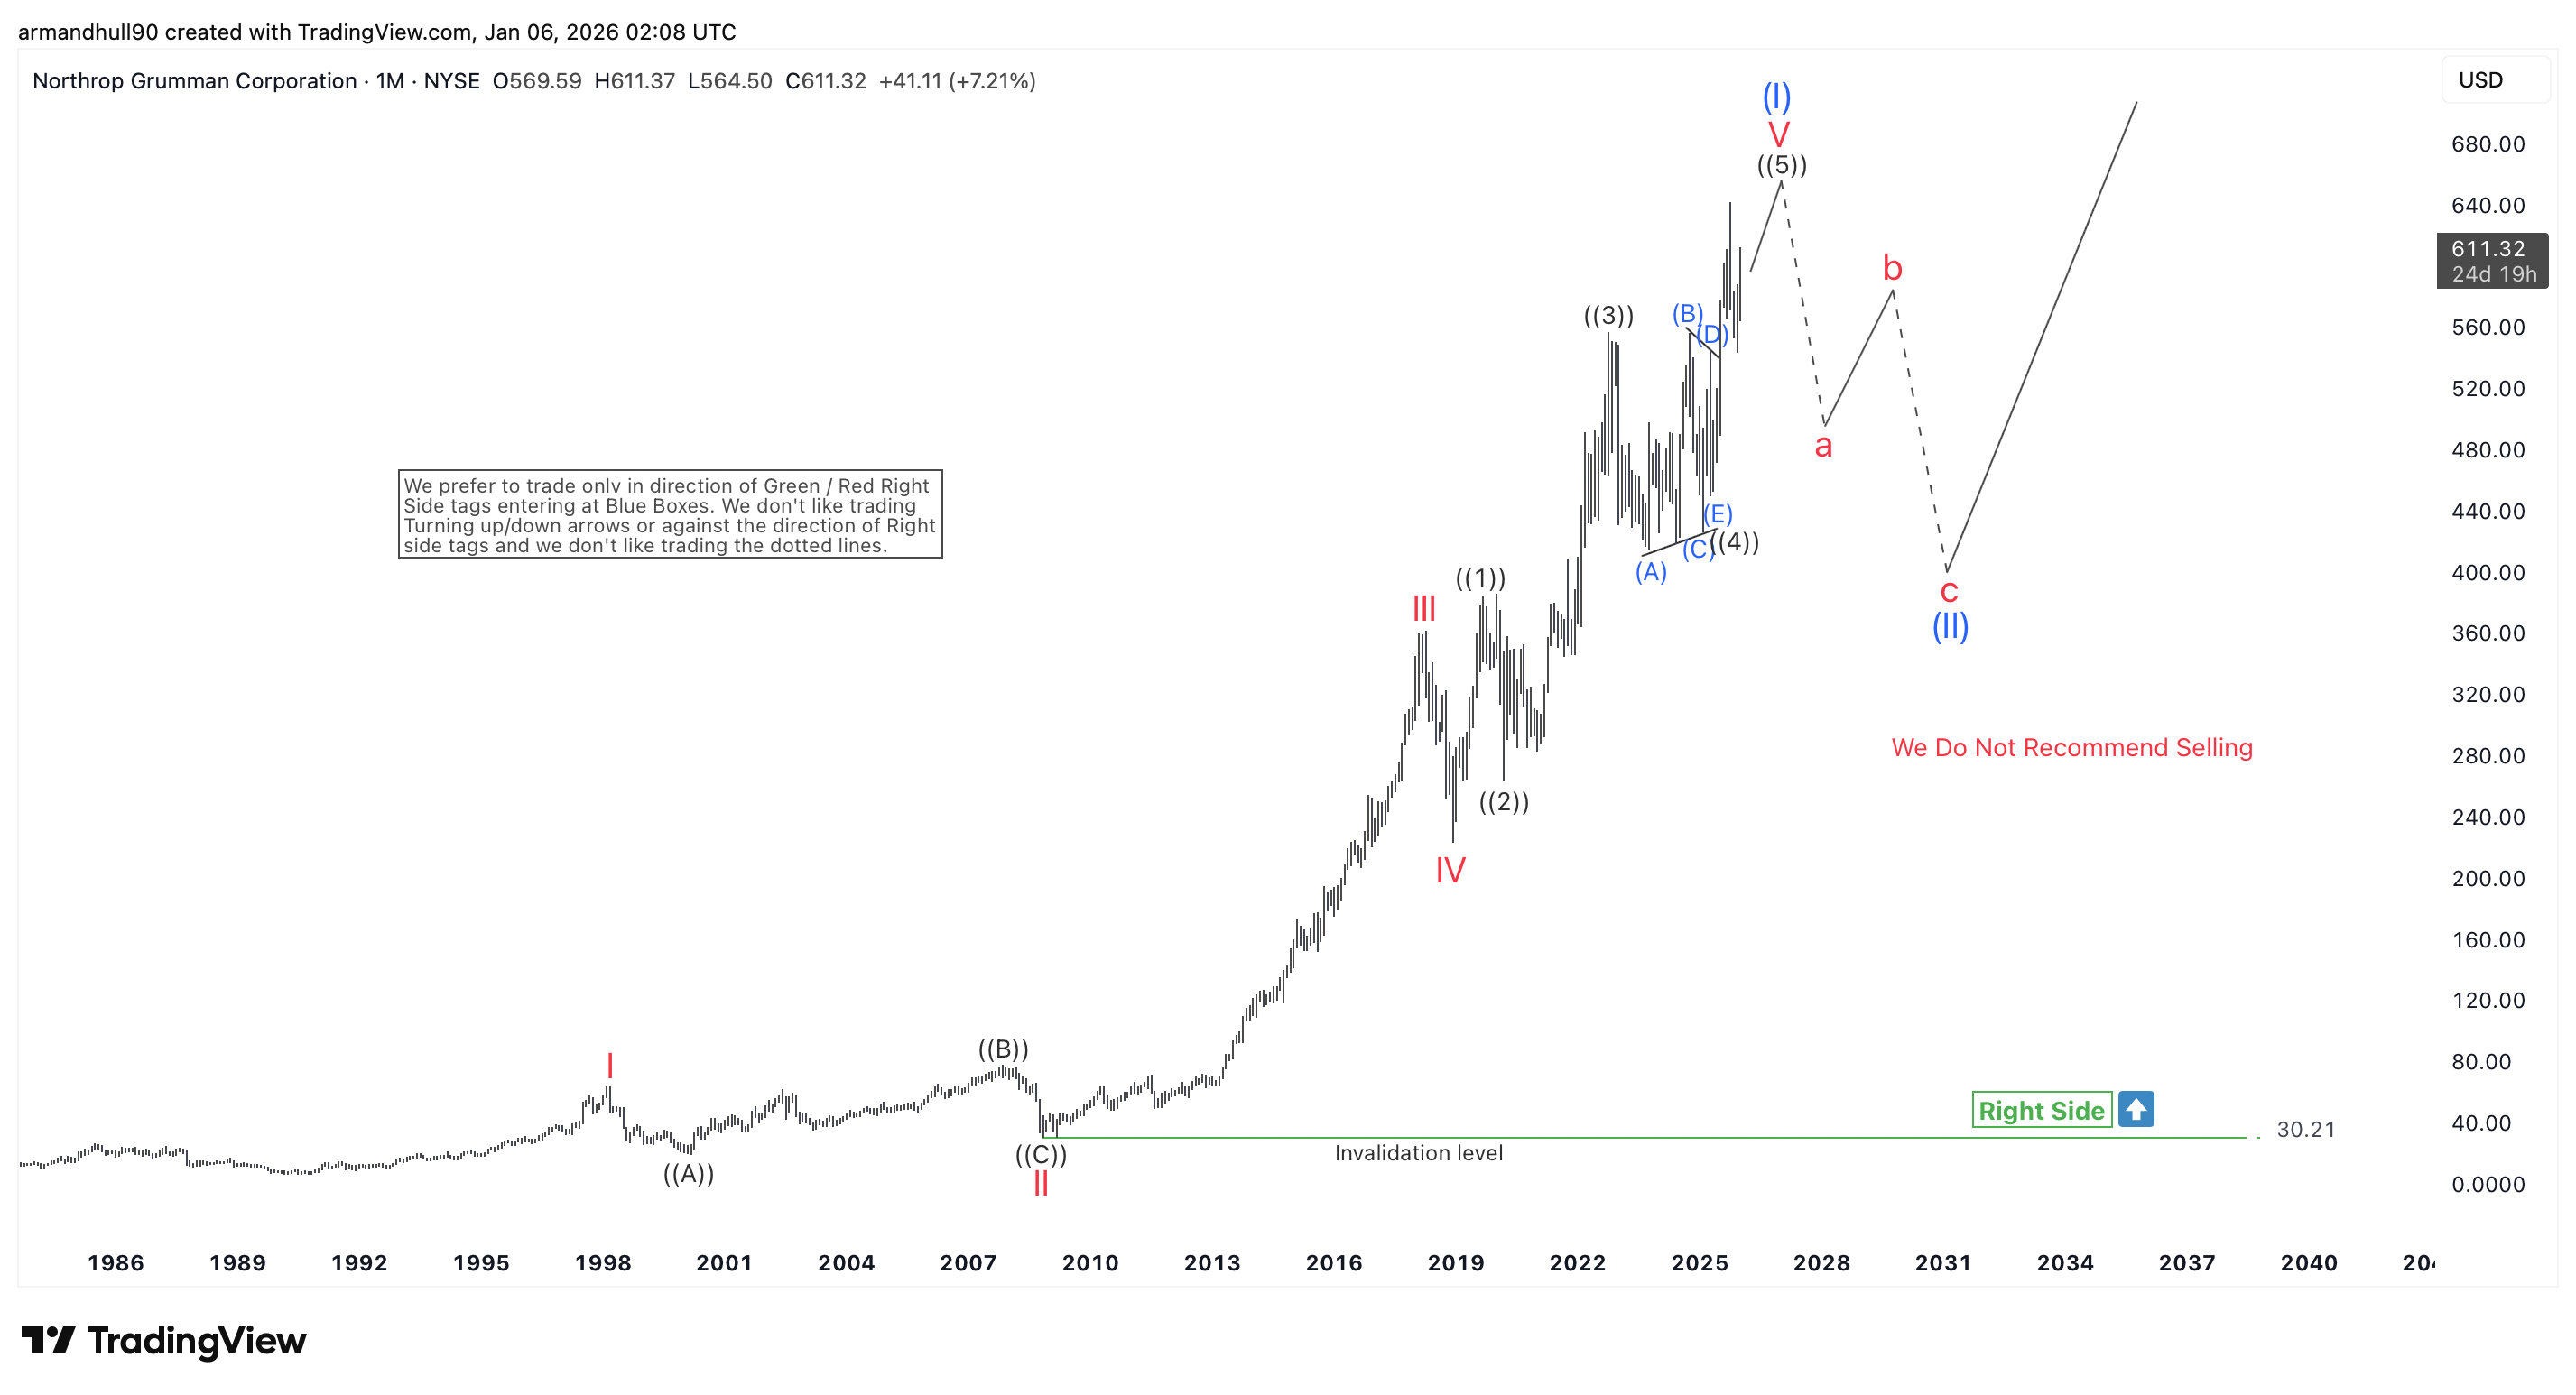
NOC Bullish Cycle Nearing Completion with Possible Retest of Highs
Read MoreNOC remains in a strong long-term bullish structure, but the Elliott Wave cycle looks mature and may retest recent highs before a deeper corrective phase begins. Northrop Grumman Corporation (NYSE: NOC) remains in a strong long-term bullish trend on the monthly chart. The stock has shown years of steady growth supported by a clear Elliott […]
-
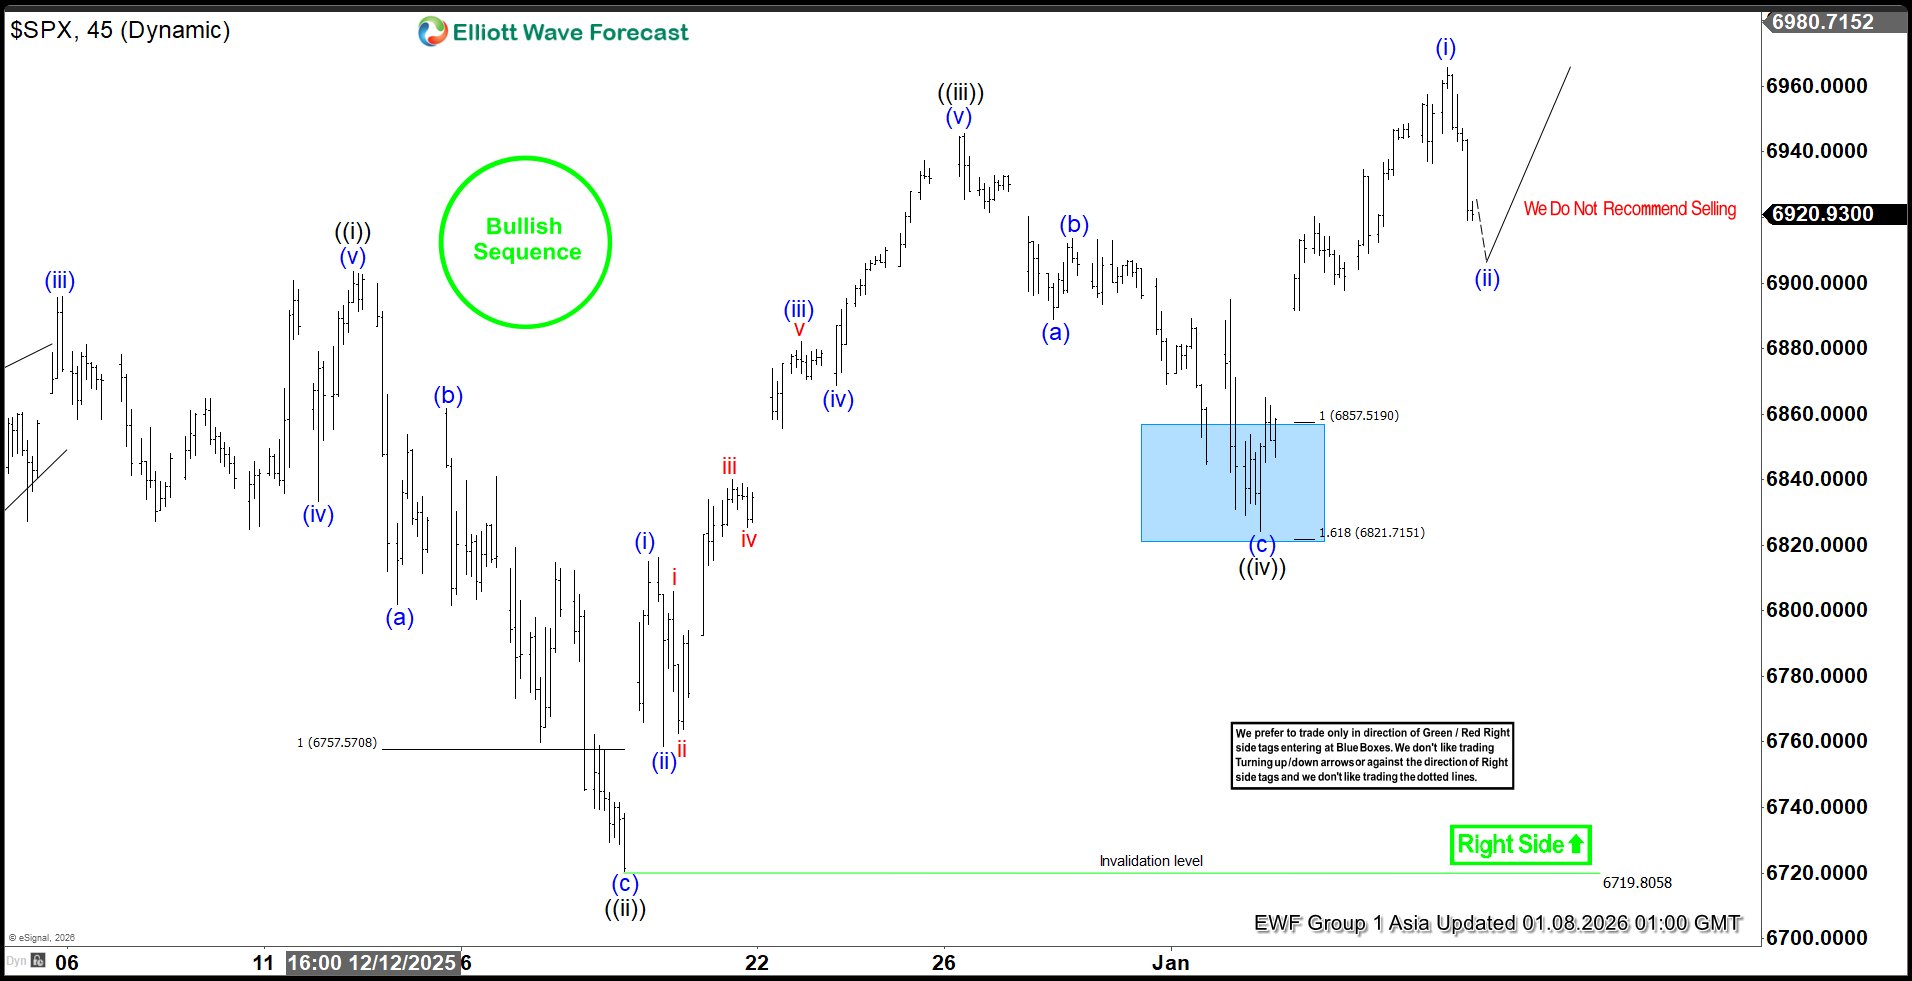
SPX Elliott Wave: Diagonal Formation in Progress
Read MoreS&P 500 (SPX) is looking to complete a diagonal structure before a larger pullback. This article and video look at the Elliott Wave path.
-
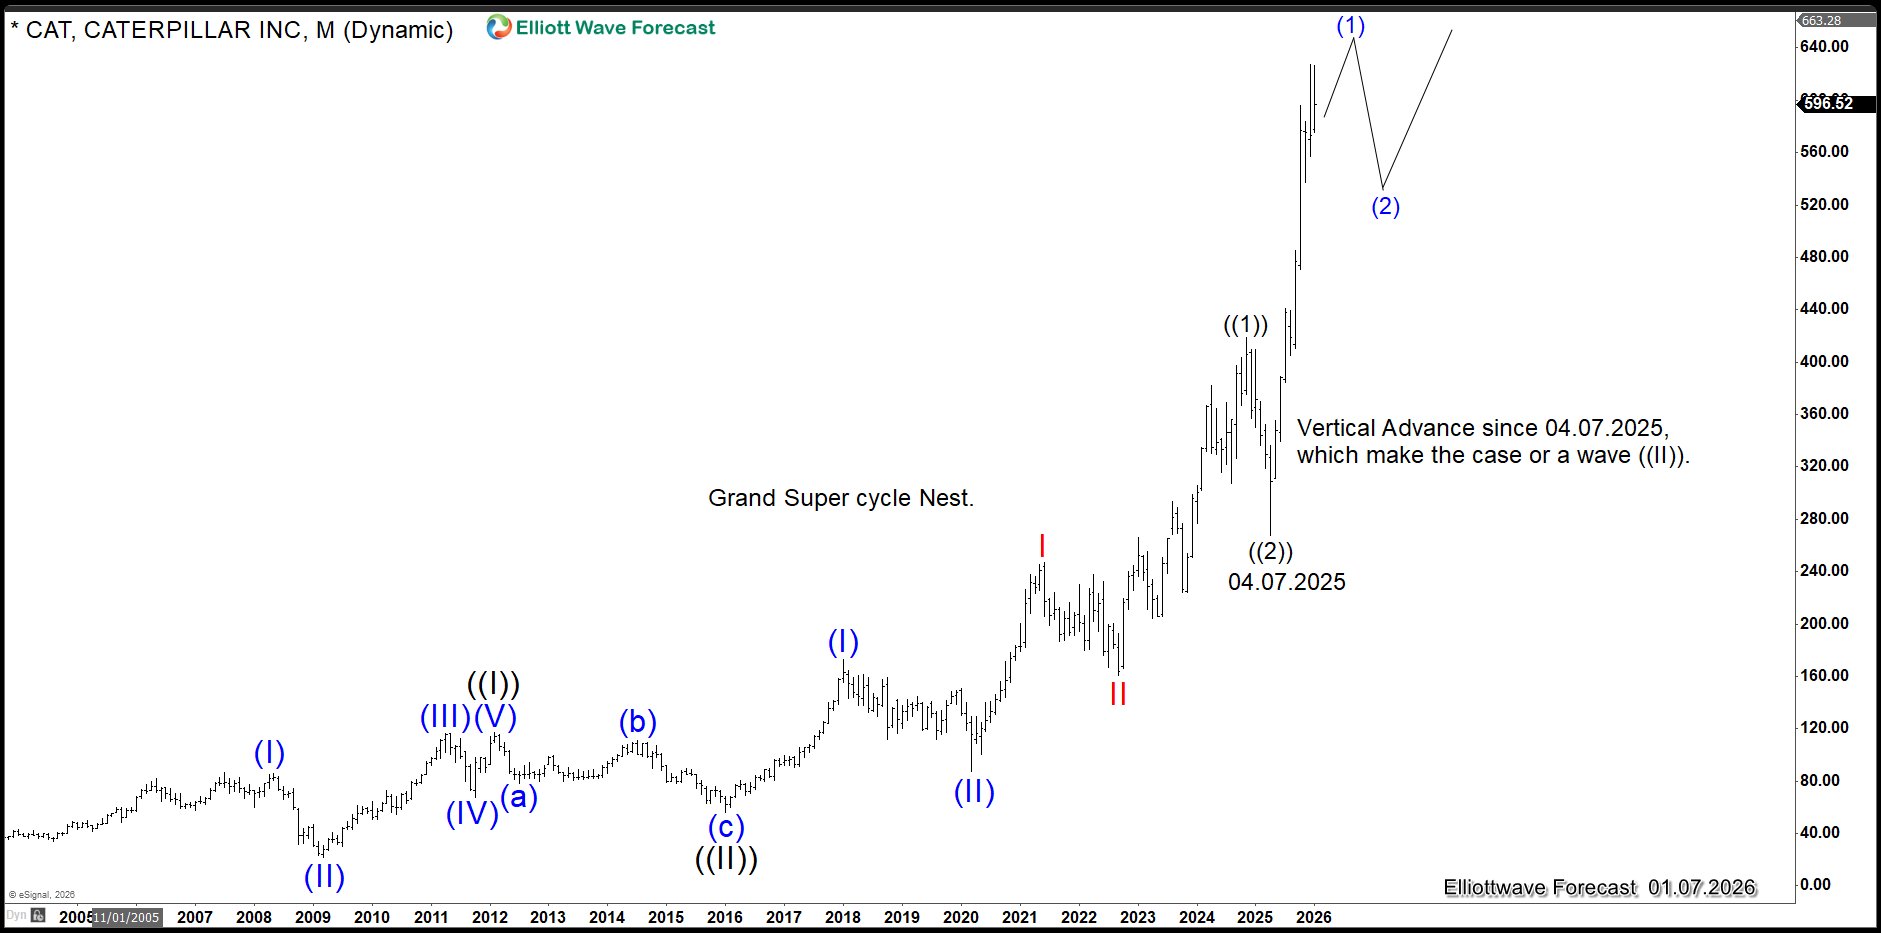
Caterpillar (CAT) Confirms Structural Nesting in the S&P 500 (SPX) With Targets at 10,000
Read MoreCaterpillar (CAT) outlook confirms the nesting thesis in S&P 500 (SPX) with a target towards 10,000. This article looks at the Elliott Wave path.
-
DAX Elliott Wave Signals Bullish Breakout Toward 25,450
Read MoreDAX continues to break to new all-time high suggesting the trend remains bullish. This article and video looks at the upside target of DAX.