Facebook was founded on February 4, 2004, by Mark Zuckerberg, along with his fellow students from the Harvard College. At the beginning it was intended for the site to be used only by Hardvard students, however it gradually allowed anyone of age 13 or above to become a registered user. After holding its initial public offering in February 2012, Facebook began selling stocks to the public in May 2012, as a part of Nasdaq stock exchange with initial price of $38 per share. In the next few months the share prices crashed more than 50%, bottoming at $17.55 and it took them more than year to recover and reach the initial price. Eventually, the price broke above $38 level and it developed a strong, 3-year-old bullish trend, where every pull back kept finding buyers at 23%-38.2% Fibonacci retracement area against the old time lows. Today Facebook is the most popular social networking site in the world based on the number of active user accounts with current market price of $127.35 per share.
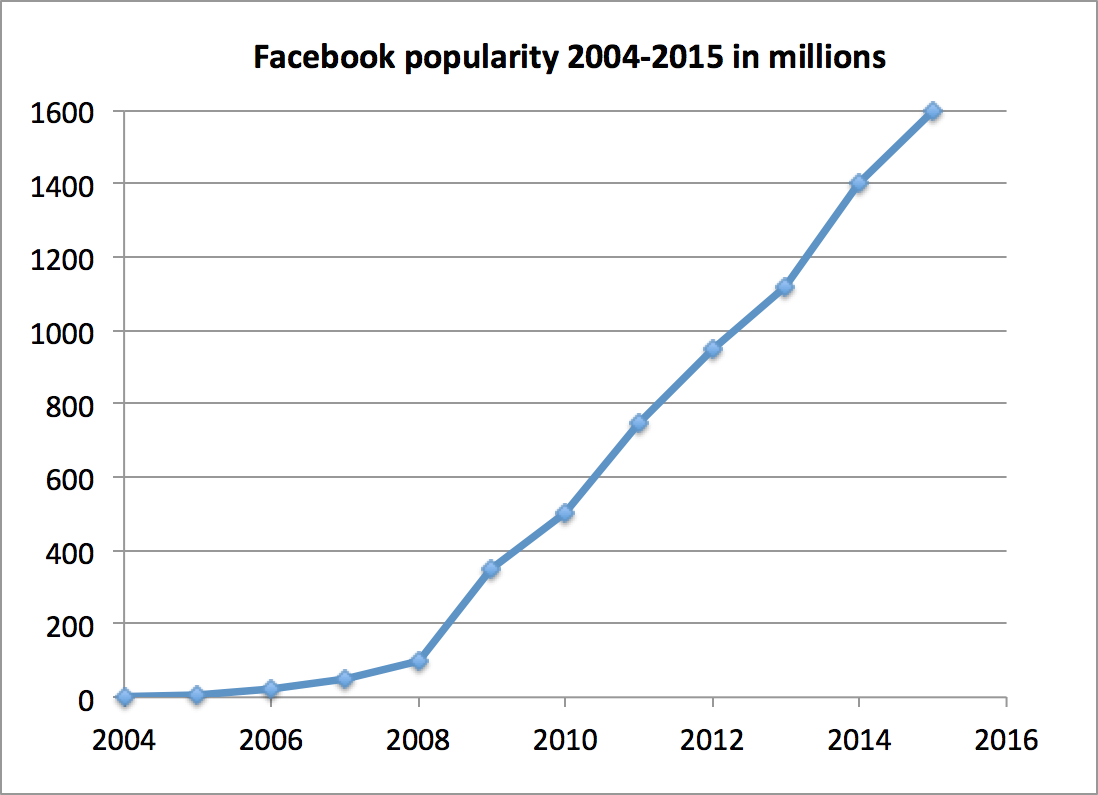
The graph below presents increase of active Facebook users from 2004
 In the further text we’re not going to discuss whether the current price of $127.35 per share is justified or not, however the bullish Elliott Wave structure doesn’t look completed yet and the stock keeps finding buyers in 3-7-11 swings.
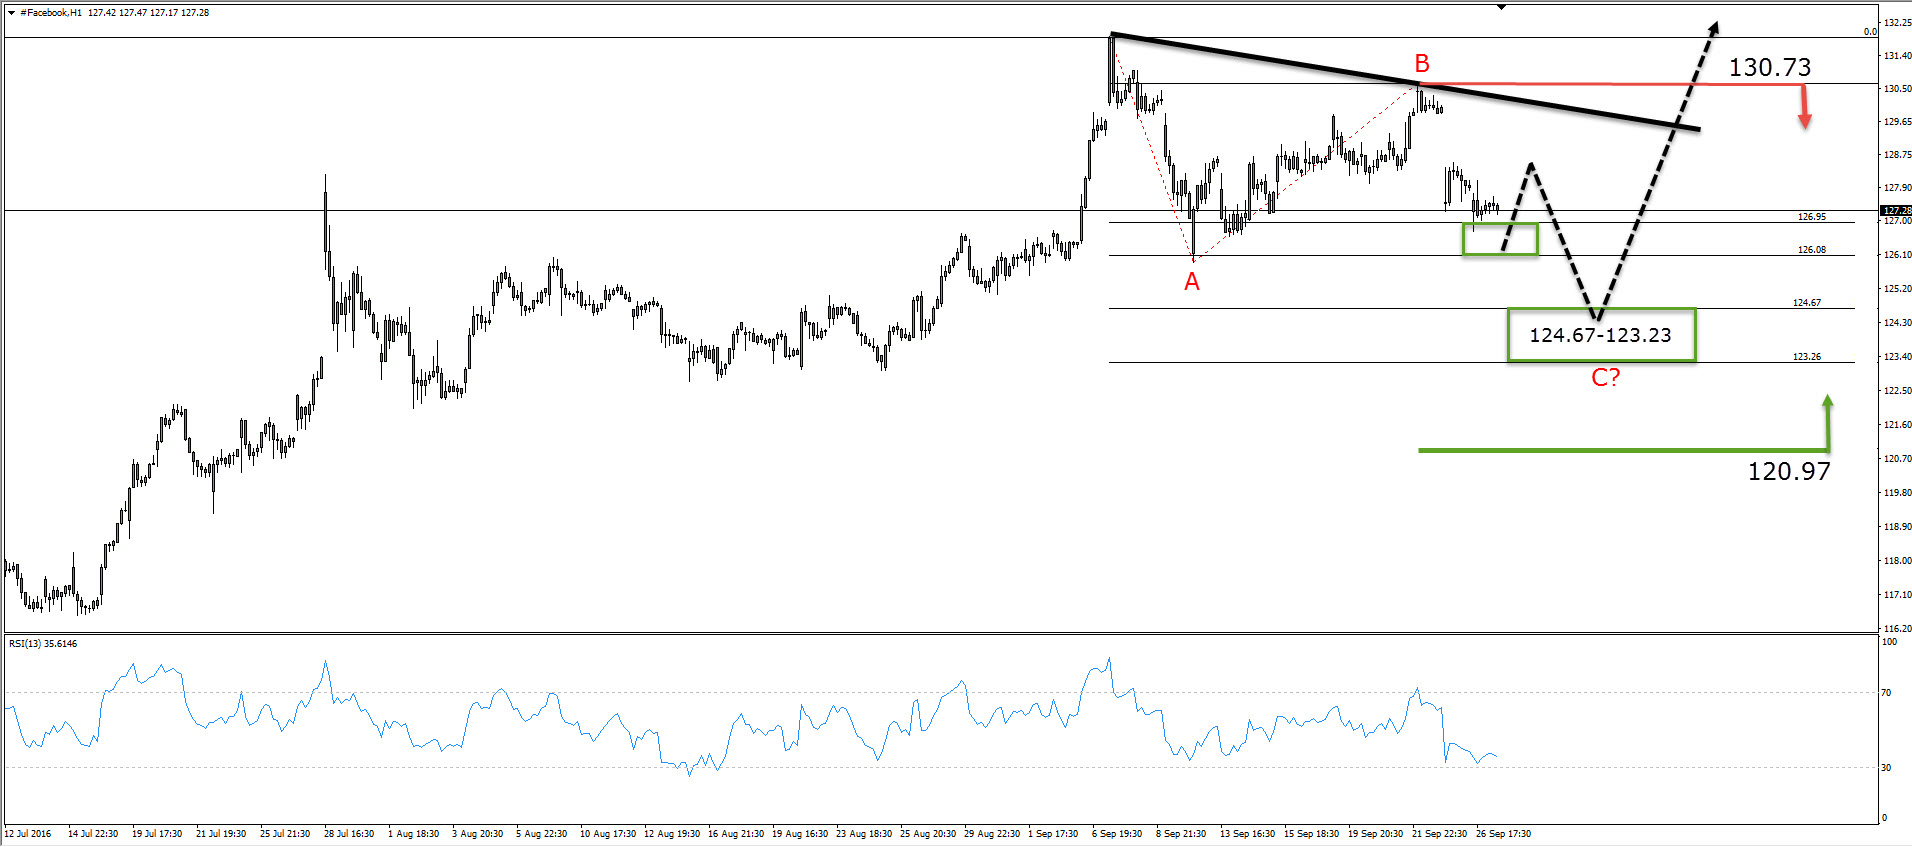
Larger time frames suggest the price is still in the cycle from the January low and it has potential to extend higher toward 139.88-147.37 area until the end of the year. Currently it’s showing a reaction from the important tech area: 127.7-132.4 ( 0.618-0.764 fib extension area measuring from the 01/20 low). Buyers are usually taking profits at that area and correction can be still in progress against the June 27th low. Pull back seems like it’is having a form of Elliott Wave ABC pattern. While the price holds below 130.73 it has a chance to reach approximately 124.67-123.23 where the buyers will be waiting and from where we can get a proposed extension toward new highs or bounce in 3 waves at least to correct the decline from 131.98 peak.
On the Facebook chart below we can see what potential short term scenario looks like
Keep in mind that market is dynamic and the view could change in mean time. Success in trading requires proper risk/money management, so does understanding of Elliott Wave theory, Cycle and Correlation analysis.
Through time we have developed a very respectable trading strategy which defines Entry, Stop Loss and Take Profit levels with high accuracy and allows you to make position Risk Free, shortly after taking it, protecting your account. If you want to learn all about it and become a professional Trader, sign up now and get 14 DAYS FREE TRIAL .
You will get access to Professional Elliott Wave analysis in 4 different time frames, Strategy of the Day/Week Video, Live Trading Room, 2 live Analysis Session done by our Expert Analysts every day, 24 Hour Chat Room support, Market Overview, Weekly technical videos and much more…
Welcome to Elliott Wave Forecast!
Back

