“What goes up must come down.” – Sir Isaac Newton
It was widely reported this week that Amazon (AMZN) founder, Jeff Bezos, lost roughly $45 Billion dollars in net worth during the October stock market selloff as shares of AMZN cratered from all-time highs set on 9/4/2018 at $2,050.50/share to the most recent low of $1,476.36/share on 10/30/2018. Yes, I realize these are just “paper” losses that essentially are meaningless depending on the level of one’s emotional intelligence and I also realize it’s hard to be concerned about the welfare of a person still worth well North of $100B. However, in this blog we’ll show you why we think Mr. Bezos has nothing to worry about and, in fact, is poised to become ever more insanely wealthy in the coming months.
This AMZN Chart Tells the Tale.
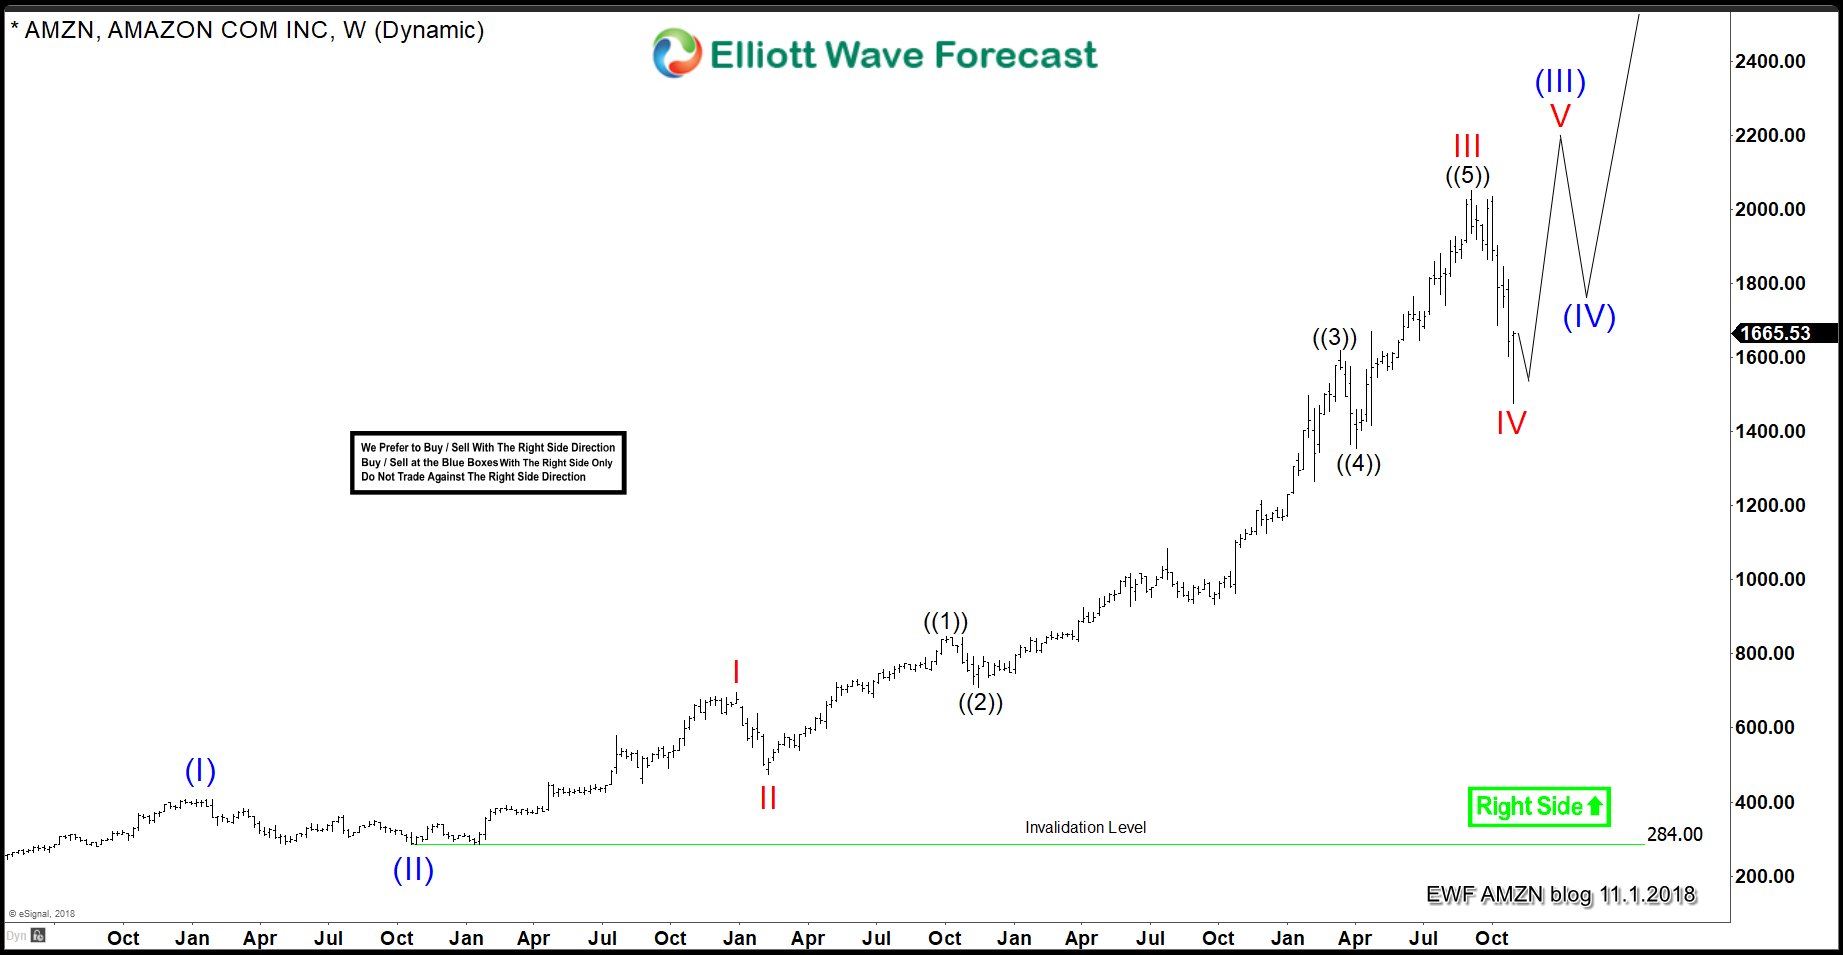
Allow me to state a blatantly obvious fact here that AMZN is trending upward. Ok, thanks for that very enlightening observation but let’s look at the details. In the chart below you can see the massive rise is value for shares of AMZN coupled with our best long term Elliott wave count. The overall Super Cycle degree wave (III) from the 2014 low of $284 is still in progress. Its Cycle degree wave I ended at $696.44. It’s Cycle degree wave II ended at $459.32 on the 2/10/2016 low. Going up from there the rally to $2049.85 ended Cycle degree wave III in an impulsive (motive) manner. We are now charting completion of the wave IV pullback in 7 swings ending at the 10/30/2018 low of $1476.36.
Opportunity Was Knocking.
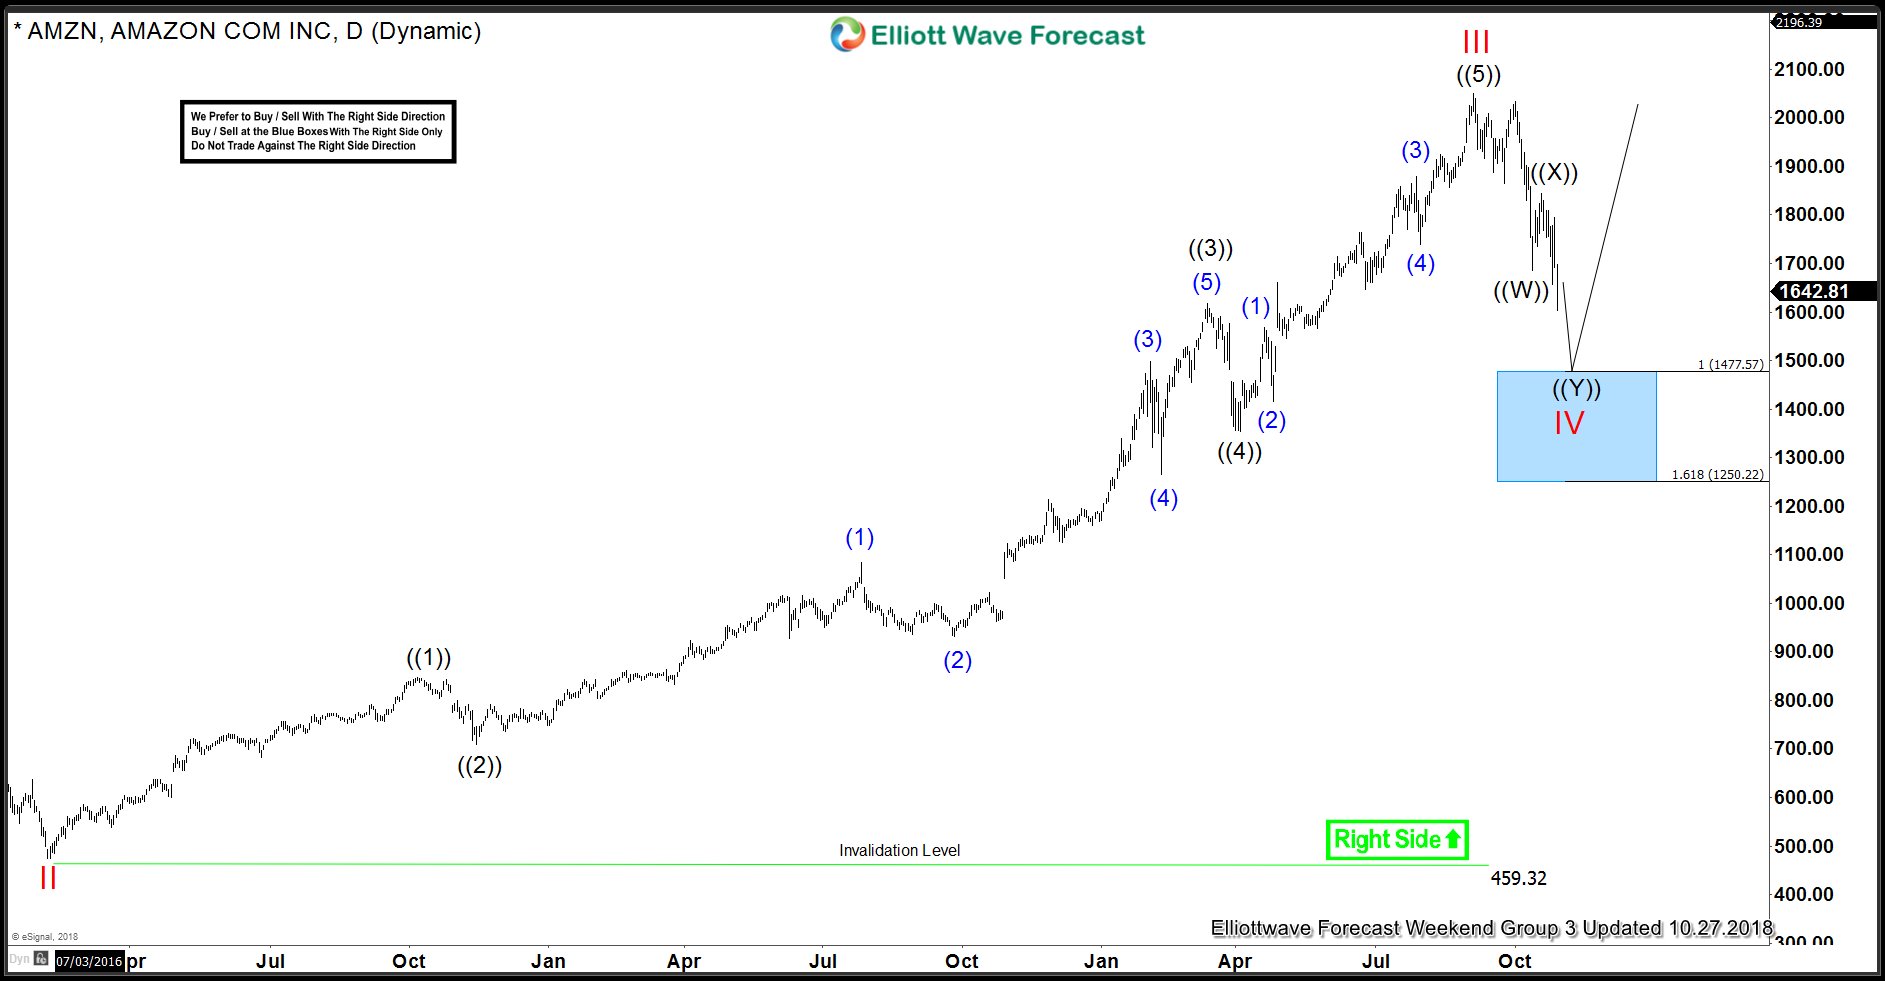
In our analytical service for our Group 3 offerings we’ve been charting this current Cycle degree correction down to the 1 hour charts. Subscribers have known for several days now that we were looking for the “Equal Leg” area to target the end of the correction and the chance to go long to profit on the coming Cycle degree wave V to the upside. In the chart below which was printed and disseminated to our subscribers over this past weekend. This crucial information was provided ahead of the final push down in Cycle degree wave IV. You can see the blue highlighted target area that starts around $1490 and extends near $1260. But, what does this blue highlighted area signify?
Opportunity is Still Knocking.
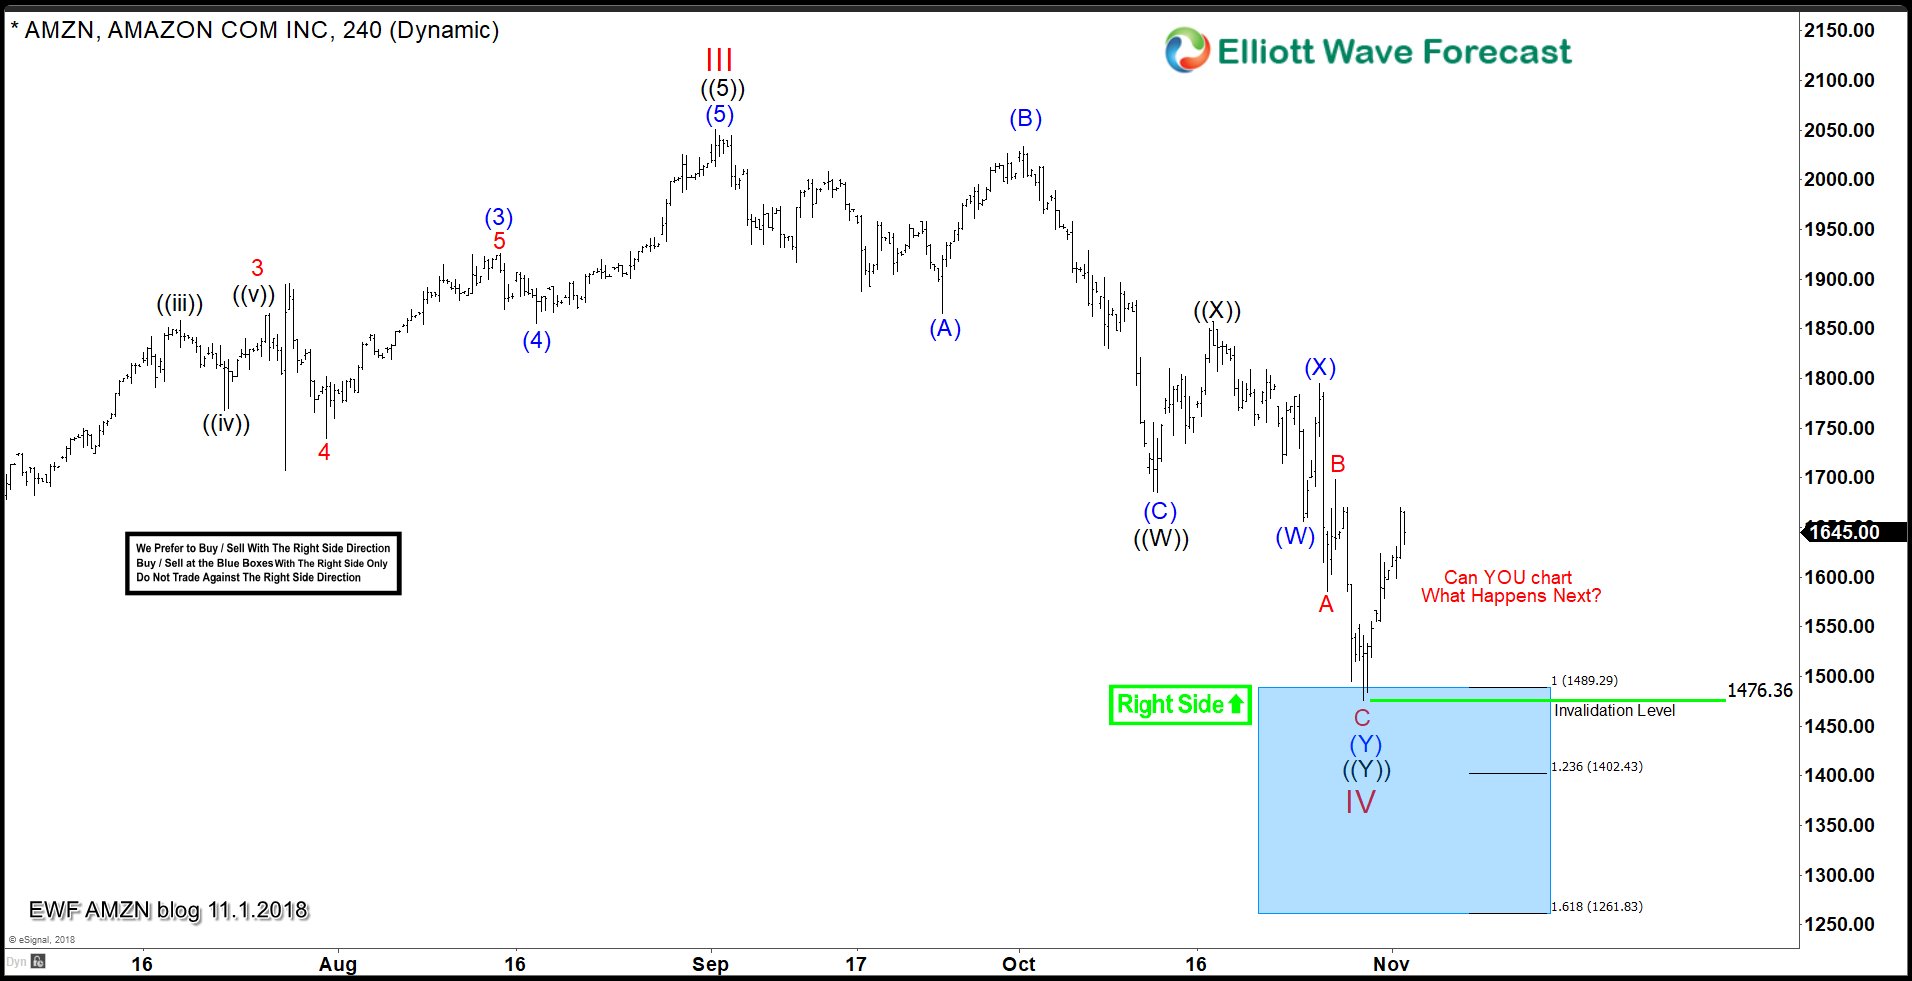
On the 4 hour time frame chart above you can see what happened at the low of $1,479.36 on 10/30/2018. If you are not already long from the top of our Blue Box around $1,490, what opportunity is there now with regards to minimal risk? That’s where our cycle and Sequence analysis comes into play. Our subscribers know what to do from here and how to manage the risk even if our analysis ends up being contrary to current analytical precisions. Do you? The 40,000 foot view was laid out above in the weekly chart depiction. You now know the eventual projected outcome. It’s safe to state that we predict Mr. Bezos will more than make back his “lost” $45B. But, that chart also portrays a broad range of risk. Come learn how we find these risk levels so that you can catch these major moves in the market risk free for 2 weeks and decide if our service is right for you as an additional tool to enhance your overall trading prowess.
As always,
Trade Safe Out There.
James
Back


