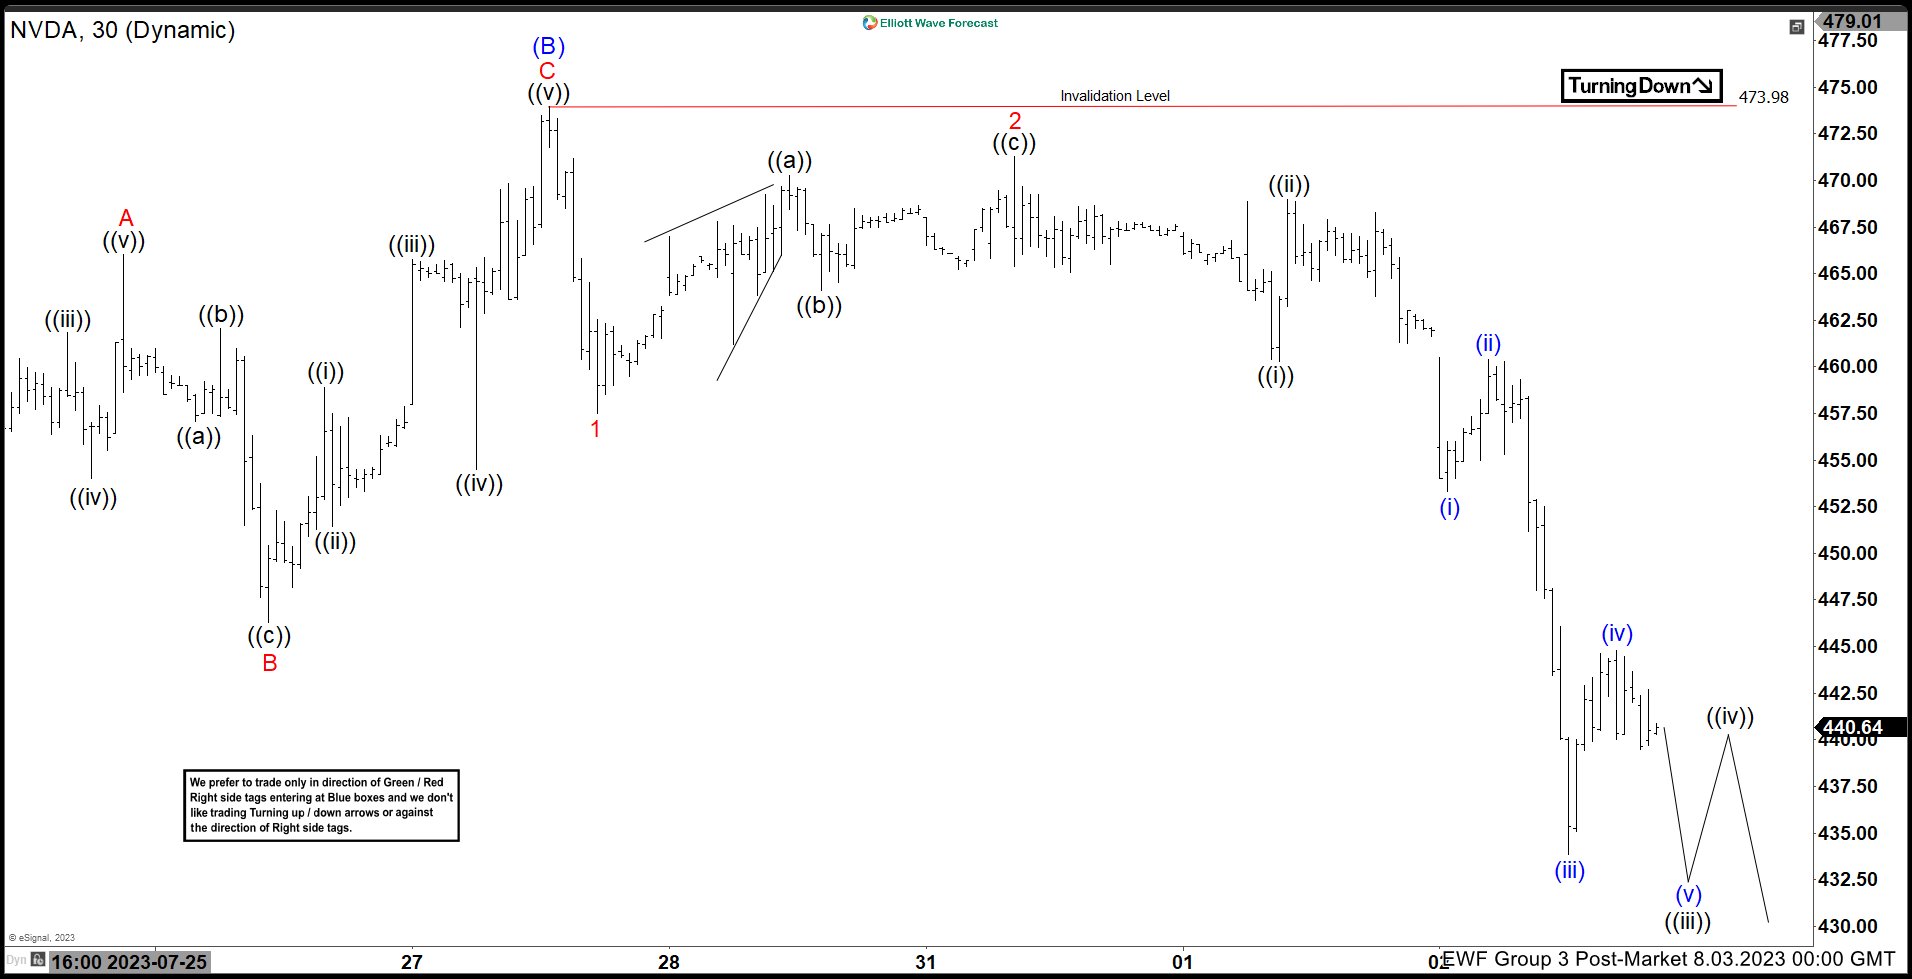
The short-term Elliott wave view in NVDA suggests that the stock has ended the cycle from the 22 February 2023 low in 5 waves impulse sequence within bigger wave ((3)) at $480.88 high. Now, while below there the stock is doing a pullback lower in wave ((4)). To correct that cycle in 3, 7, or 11 swings before the upside resumes again. So far the pullback is unfolding in 3 waves. And soon should find support either for the next leg higher or should do a 3-wave bounce at least.
Down from $480.88 high the pullback lower is taking place as Elliott wave zigzag structure where wave (A) ended at $440.40 low. Up from there, the wave (B) bounce unfolded in a lesser degree 3 waves where wave A ended at $466 high. Then wave B pullback ended at $446.30 low in a lesser degree 3 waves. Wave C ended at $473.98 high & thus completed wave (B) bounce. While below there, wave (C) remains in progress in an impulse sequence. Near-term, now as far as bounces fail below $473.98 high. The stock is expected to extend lower towards $433.05- $407.63 100%-161.8% Fibonacci extension area of (A)-(B). Then from there, the stock is expected to resume the upside or should see a minimum reaction higher in 3 swings at least.


