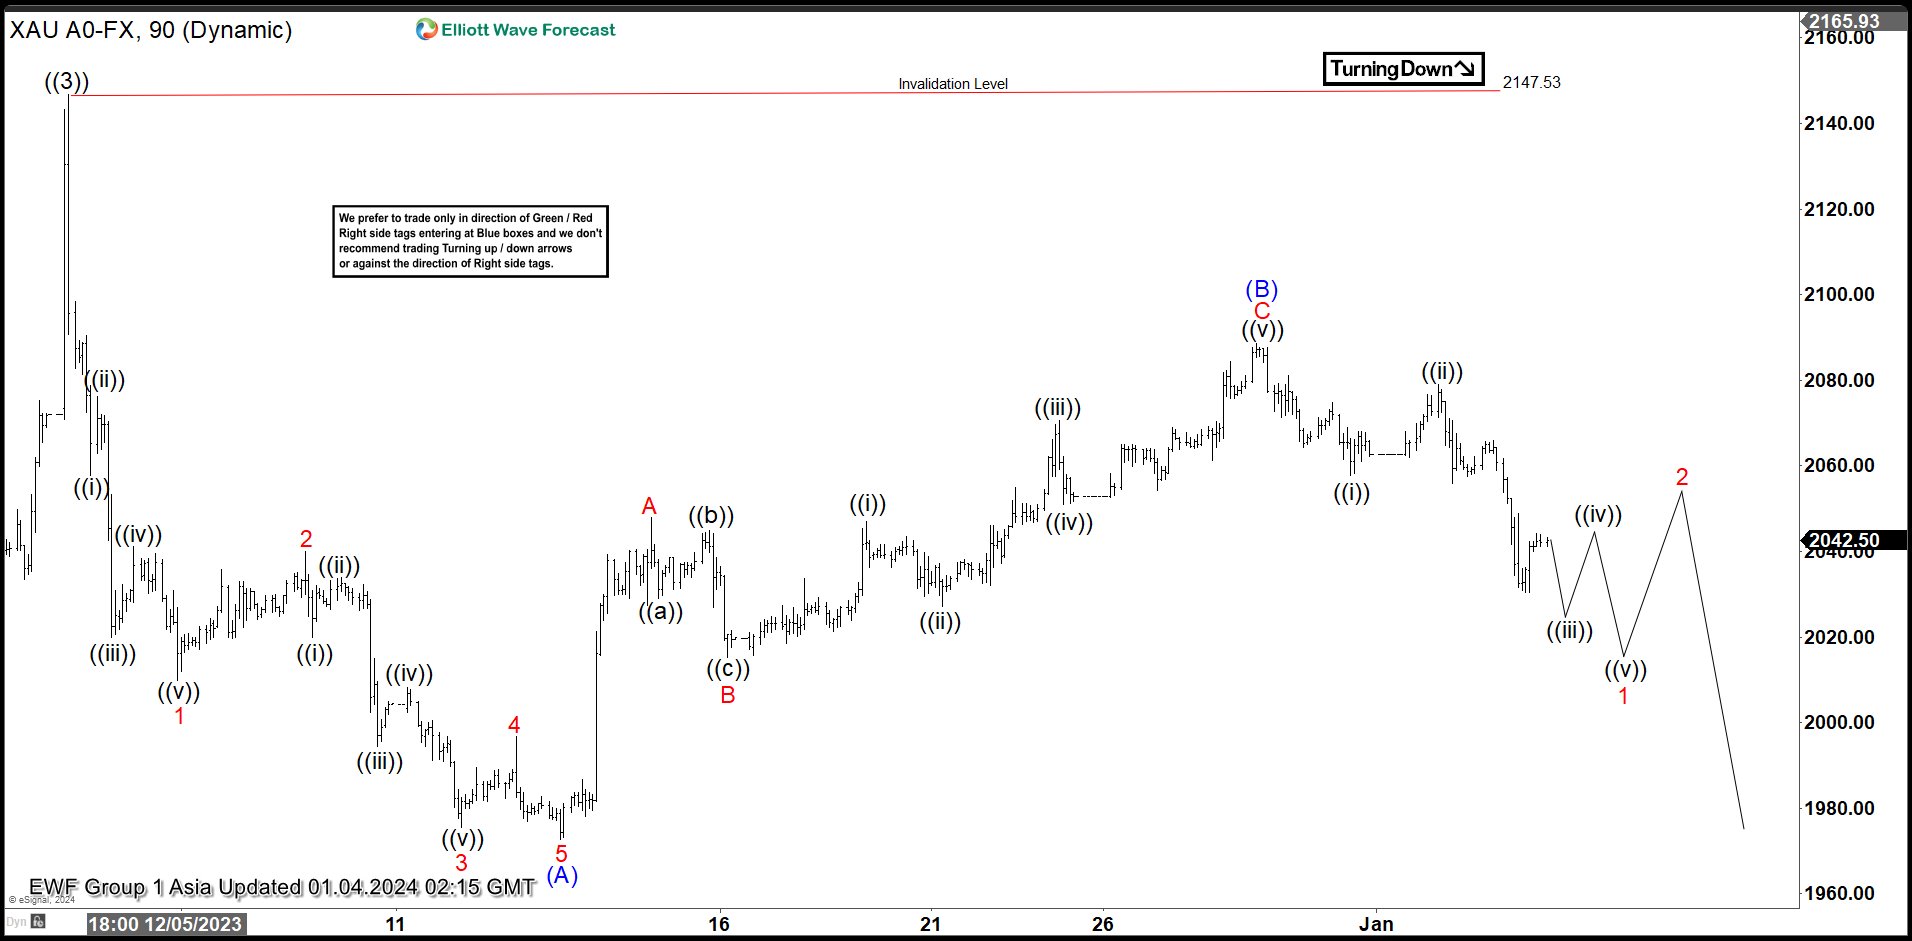
GOLD (XAUUSD) shows a bullish sequence from September 2022 low favoring further upside. The rally higher from 09.28.2022 is unfolding as Elliott Wave leading diagonal. Up from 09.28.2022 low, wave ((1)) ended at 2081.82 and pullback in wave ((2)) ended at 1810.58 low. Wave ((3)) finished at 2147.53 high as the 1 hour chart below shows. Pullback as wave ((4)) is currently in progress with internal subdivision of (A), (B) and (C).
Down from ((3)), wave (A) built an impulse structure. Wave 1 ended 2009.78 low and bounce in three swings completed wave 2 at 2039.93. Wave 3 ended at 1975.50, wave 4 ended at 1996.73, and final wave 5 lower ended at 1972.60. This completed wave (A) in higher degree. Wave (B) pullback developed an internal subdivision as a zig zag. Up from wave (A), wave A ended at 2047.91, wave B ended at 2015.30, and wave C ended at 2088.48. This completed wave (B) and gold turned lower. Expect the metal to continue to the downside in wave (C) to break 1972.60 low to confirm the view of the wave ((4)) correction. As far as pivot at 2147 high stays intact, expect rally to fail for further downside.


