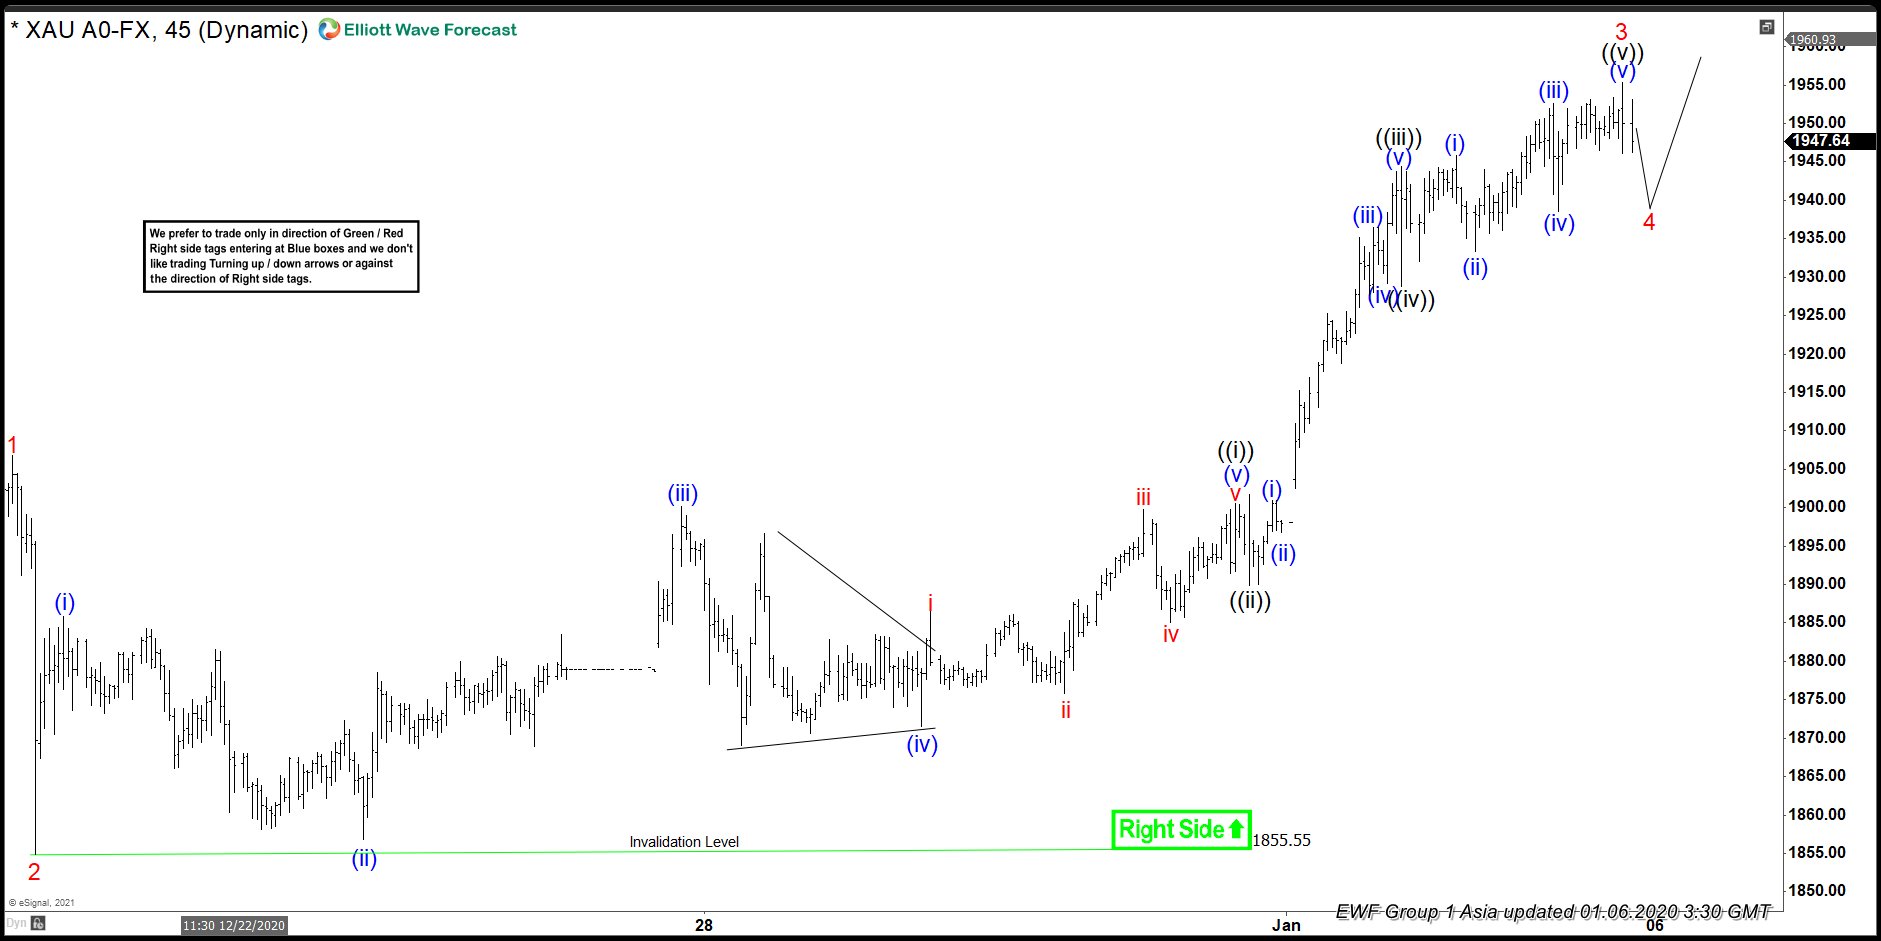
Since bottoming on December 1, 2020 low at $1764., Gold has steadily risen. Short Term Elliott Wave View suggests the rally from December 14, 2020 low is unfolding as a 5 waves impulse Elliott Wave structure. In the 45 minutes chart below, we can see wave 1 of this impulse ended at $1906.74 and dips in wave 2 ended at $1855.55. Up from there, wave ((i)) ended at $1900.56 as 5 waves impulse in lesser degree. Dips in wave ((ii)) ended at $1893.90. Gold then rallied higher again in wave ((iii)) which ended $1943.80, then wave ((iv)) pullback ended at $1928.80.
Final leg wave ((v)) ended at $1955.32 and this completed wave 3 in higher degree. Wave 4 pullback is now in progress to correct cycle from December 21 low before the rally resumes. Potential target for wave 4 is 23.6 – 38.2% Fibonacci retracement of wave 3 which comes at $1916 – $1931. From this area, Gold may find support and resume higher again. As far as December 21 low pivot at $1855.55 low remains intact, expect dips to find support in 3, 7, or 11 swing for more upside.


