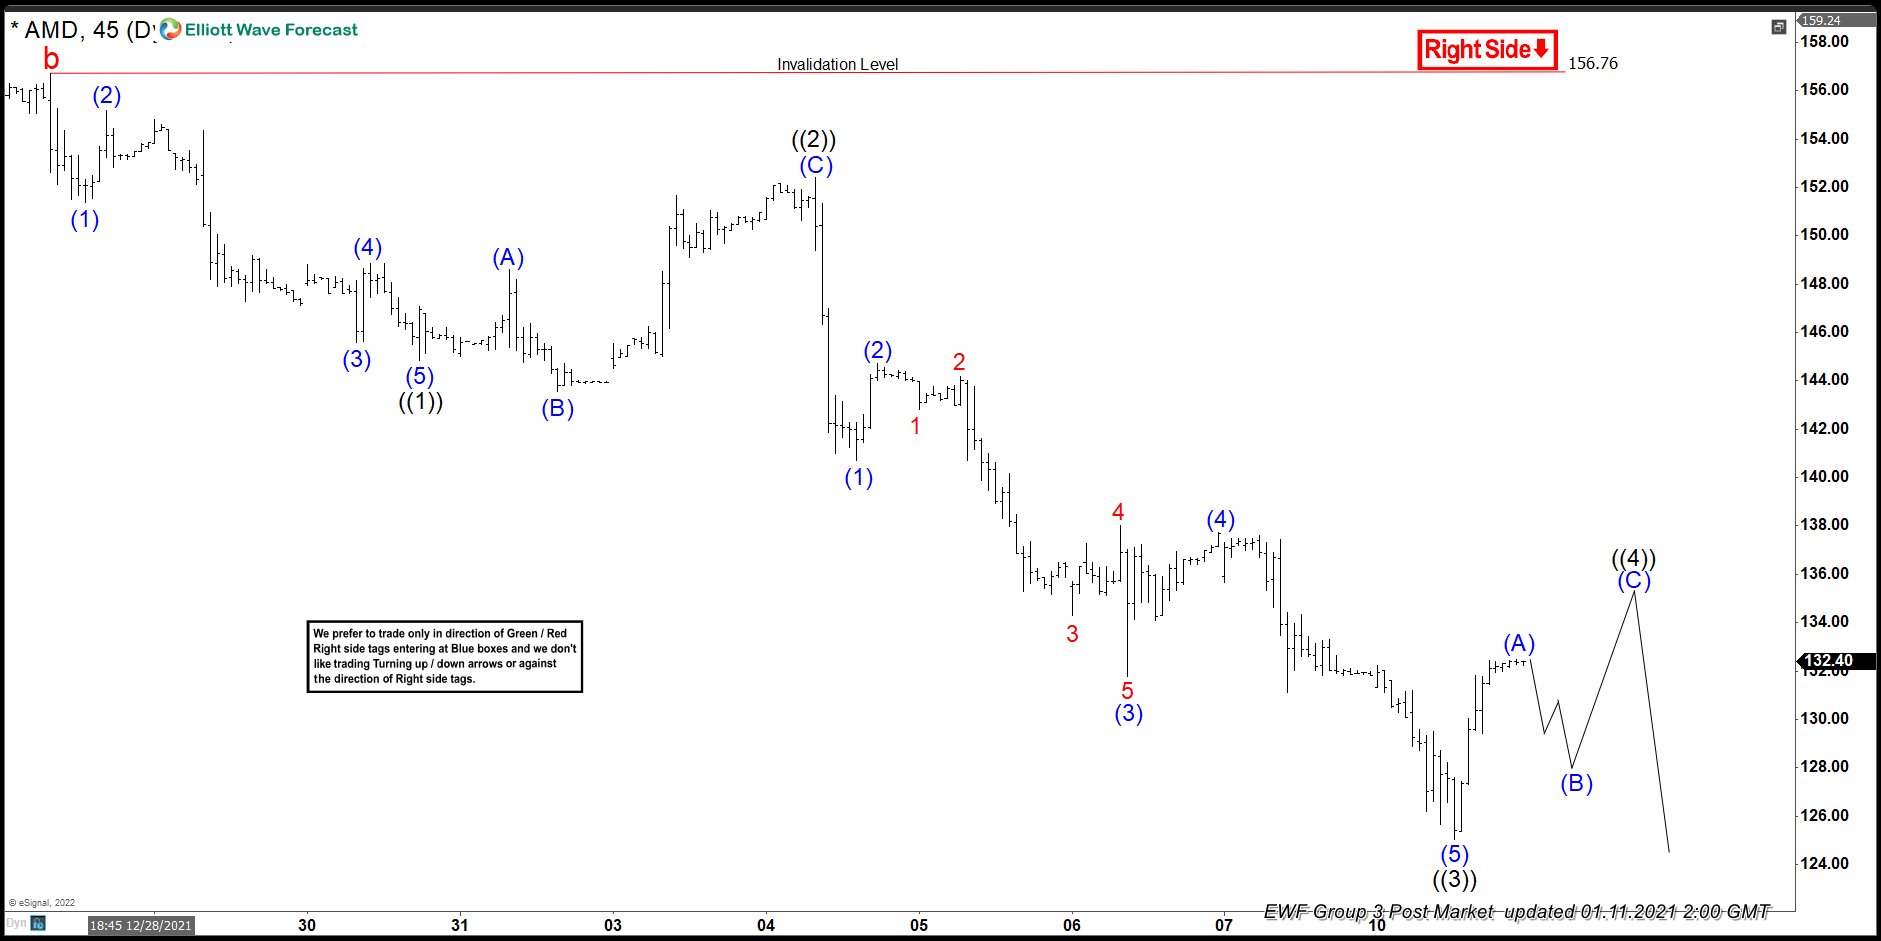
Short Term Elliott Wave View in AMD suggests the decline from December 28, 2021 peak is unfolding as an impulse Elliott Wave structure. Down from December 28 high, wave ((1)) ended at 144.85. Wave ((2)) bounce made an irregular flat structure completed at 152.42. Then the stock continued dropping in 5 swings proposing other impulse as wave ((3)). In lesser degree, wave (1) of ((3)) ended at 140.70. Wave ((2)) pullback just bounced to 144.74 then it resumed the drop immediately to 131.77 and completed wave (3). Then wave (4) bounce ended at 137.72, completing the whole impulse with further downside as wave (5) to 125.03 and also wave ((3)).
Near term, we are looking to complete wave ((4)) bounce. We are suggesting a zig zag structure for this purpose, where wave (A) could be done already and we should see a pullback as wave (B) and then a last push higher to complete wave (C) and wave ((4)) as we could in the chart below. After this. we should turn lower again to complete wave ((5)) of the impulse from December 28 high. Potential target lower is 100% – 161.8% Fibonacci extension from November 30, 2021 high which comes at 101.1 – 122.3.


